

| Journal of Clinical Medicine Research, ISSN 1918-3003 print, 1918-3011 online, Open Access |
| Article copyright, the authors; Journal compilation copyright, J Clin Med Res and Elmer Press Inc |
| Journal website https://www.jocmr.org |
Original Article
Volume 16, Number 2-3, March 2024, pages 81-93

The Association Between Lean-to-Fat Mass Ratio and Cardiometabolic Abnormalities: An Analytical Cross-Sectional Study
Jamee Guerra Valenciaa, g ![]() , Antonio Castillo-Paredesb, g
, Antonio Castillo-Paredesb, g ![]() , Carolina Gibaja-Arcec
, Carolina Gibaja-Arcec ![]() , Lorena Saavedra-Garciad
, Lorena Saavedra-Garciad ![]() , Noel C. Barengoe, f
, Noel C. Barengoe, f ![]()
aFacultad de Ciencias de la Salud, Universidad Privada del Norte, Lima 15314, Peru
bGrupo AFySE, Investigacion en Actividad Fisica y Salud Escolar, Escuela de Pedagogia en Educacion Fisica, Facultad de Educacion, Universidad de Las Americas, Santiago 8370040, Chile
cFacultad de Ciencias de la Salud, Universidad Cientifica del Sur, Lima 15067, Peru
dGrupo de Investigacion en Nutricion Funcional, Carrera de Nutricion y Dietetica, Facultad de Ciencias de la Salud, Universidad San Ignacio de Loyola, Lima 15024, Peru
eDepartment of Medical Education, Herbert Wertheim College of Medicine, Florida International University, Miami, FL, USA
fEscuela Superior de Medicina, Universidad Nacional de Mar del Plata, Mar del Plata, Argentina
gCorresponding Author: Jamee Guerra Valencia, Facultad de Ciencias de la Salud, Universidad Privada del Norte, Lima 15314, Peru; Antonio Castillo-Paredes, Grupo AFySE, Investigacion en Actividad Fisica y Salud Escolar, Escuela de Pedagogia en Educacion Fisica, Facultad de Educacion, Universidad de Las Americas, Santiago 8370040, Chile
Manuscript submitted December 19, 2023, accepted February 20, 2024, published online March 16, 2024
Short title: LFMR and Cardiometabolic Abnormalities
doi: https://doi.org/10.14740/jocmr5096
| Abstract | ▴Top |
Background: Cardiovascular diseases (CVDs) are a global health threat, significantly impacting Latin America. Cardiometabolic abnormalities (CAs), encompassing lipid profile, fasting plasma glucose, and blood pressure, contribute to CVD prevalence. Despite high CA incidence, research in Latin America has primarily focused on traditional adiposity indices, overlooking the intricate relationship between fat and lean body components. The study aimed to analyze the association between the lean-to-fat mass ratio (LFMR) and CAs in the adult Peruvian population.
Methods: This was an analytical cross-sectional study using secondary data from the PERU MIGRANT study (2007, 989 participants). The main outcome variable was CA defined as having ≥ 2 out of six metabolic components (high triglycerides, impaired fasting glucose, high blood pressure, low high-density lipoprotein (HDL)-cholesterol, insulin resistance, and high C-reactive protein). The main exposure variable LFMR was divided into tertiles. A generalized linear model was used with log link and robust variance Poisson family to calculate crude (cPR) and adjusted prevalence ratios (aPRs) and 95% confidence intervals (95% CIs).
Results: A total of 959 adults aged 30 years or older were included in the analysis (53% females). The prevalence of CA was 50.9%. Females aged 30 - 44 years old showed statistically significant inverse associations for the middle (aPR: 0.57, 95% CI: 0.42 - 0.78) and highest (aPR: 0.22, 95% CI: 0.14 - 0.35) LFMR categories. Similar trends were seen for females aged 45 - 59 years and ≥ 60 years, and males aged 30 - 44 years, while for males aged 45 - 59 years, only the middle LFMR category was associated. No statistically significant association between LFMR and CA was found among old males.
Conclusions: LFMR was negatively associated with CA, among the Peruvian adult population. These findings underscore the relevance of LFMR in understanding cardiometabolic health disparities.
Keywords: Metabolic syndrome; Cardiometabolic risk factors; Body composition; Latin America; Fat mass; Lean mass
| Introduction | ▴Top |
Cardiovascular diseases (CVDs) are a major contributor to global mortality and reduced quality of life [1, 2]. In 2017, CVD ranked among the top 10 for disability-adjusted life years (DALYs), accounting for 336 million DALYs [1]. Furthermore, in 2014, CVD was the primary cause of death in Latin America representing 33.7% of total mortality [3] and by 2020 accounted for more than 2,500 age-standardized DALYS [4]. Different metabolic risk factors such as lipid profile, fasting plasma glucose, and blood pressure, have been associated with CVD [4, 5]. Additionally, these clusters of metabolic factors, along with others such as C-reactive protein (CRP) and insulin resistance (IR) are used to define unhealthy metabolic conditions [6]. Given that the prevalence of metabolic syndrome (MetS) in Latin America has been estimated at 24.9%, affecting women more frequently than men [7], CVD has become a pressing concern in this population.
As increased adiposity levels, including both overall and central fat mass, have been associated with cardiometabolic risk factors and CVD [8] research has primarily concentrated on anthropometric indices like body mass index (BMI) and waist circumference (WC) to assess adiposity and its distribution [9, 10], often overlooking other significant body composition elements. This includes the lean compartment, which is primarily composed of skeletal muscle, an active metabolic tissue that has been related to an improvement in insulin sensitivity and lower cardiometabolic abnormalities prevalence [11]. Furthermore, controversies arise when isolated assessing the association of these body compartments with cardiometabolic risk factors. Notably, individuals with normal BMI are not necessarily free of cardiometabolic abnormalities, and not all obese patients exhibit unhealthy cardiometabolic profiles [12, 13]. Similarly, studies on skeletal mass indexes have yielded diverse results with some reporting a protective effect of muscle mass against MetS only in non-obese patients [14, 15], while others have shown this trend regardless of BMI status [11, 16, 17]. The intricate crosstalk between adipose tissue and lean tissues, such as skeletal mass, liver, and pancreas [18, 19], suggests the importance of considering the interaction between fat and lean body components [20].
Introducing a novel anthropometric surrogate, the lean-to-fat mass ratio (LFMR), presents a different perspective on body composition and its relevance to health outcomes as it integrates the complex interplay between lean and fat mass. Previous studies have demonstrated an inverse association between LFMR and cardiometabolic abnormalities, such as IR in Mexican adolescents [21], and in women with and without polycystic ovarian syndrome [20]. Similarly, other populations such as cancer patients and those undergoing hemodialysis have shown an inverse association between LFMR and overall mortality [22, 23], and cardiac events [22].
While body composition can be accurately assessed using techniques like dual-energy X-ray absorptiometry (DXA), the clinical and epidemiological settings in low-middle-income countries, such as Peru, may face limitations in implementing these methods [24]. Nevertheless, validated anthropometric equations to estimate lean and fat mass have been published [25]. These equations have been developed using DXA as the reference method, considering the Latino population and its calculations rely on weight, height, and waist measured in the same units, offering high predictive capacity [25].
Considering the high prevalence of cardiometabolic abnormalities in Latin America and acknowledging that the LFMR integrates the antagonistic effects of both fat and lean mass depots, the present study aimed to examine the association between the ratio and cardiometabolic abnormalities prevalence within the Peruvian population.
| Materials and Methods | ▴Top |
Study design
An analytical cross-sectional study using data collected from the PERU MIGRANT cohort study (primary study) by CRONICAS Center of Excellence in Chronic Diseases between 2007 and 2008, was conducted. The primary study aimed to assess cardiovascular risk factor differences among urban, rural, and urban-rural migrant populations.
Population and sample
The original study enrolled men and women aged 30 years and older, excluding individuals with a history of mental illness or those who were currently pregnant, and residing in Peru. Participant recruitment from both rural and urban areas was done with a single-stage random sampling approach based on the 2006 and 2007 censuses. Rural residents were selected from San Jose de Secce, Huanta, Ayacucho, while individuals who had migrated from rural to urban areas, along with urban residents, were chosen from Las Pampas de San Juan de Miraflores, Lima, the capital of Peru. Migrants were identified as those who were permanent residents of Las Pampas de San Juan de Miraflores during the assessment but were originally born in Ayacucho. Detailed information regarding selection criteria, evaluated variables, sample size, and participation rates has been previously published in the original study protocol [26]. For the present study, only those with missing data on any of the variables of interest from the original sample were excluded (n = 30). The final sample included 959 men and women.
Variables and measurements
The outcome variable was the presence of cardiometabolic abnormalities using a modified criteria from Wildman [6] and previous studies for homeostatic model assessment-insulin resistance (HOMA-IR) and CRP [27]. Cardiometabolic abnormalities components were triglycerides ≥ 150 mg/dL, fasting glucose ≥ 100 mg/dL or on hypoglycemic treatment, systolic blood pressure (SBP) ≥ 130 mm Hg or diastolic blood pressure (DBP) ≥ 85 mm Hg or on antihypertensive treatment, high-density lipoprotein (HDL)-cholesterol < 50 mg/dL in women or < 40 mg/dL in men, IR measured by the HOMA-IR index ≥ 2.80, and CRP ≥ 3 mg/dL. Cardiometabolic abnormalities were defined as ≥ 2 risk factors.
The exposure variable was the LFMR. For lean mass and fat mass calculation, previously validated regression equations using weight, height, WC, age, and sex were used [25]. The chosen equations were validated against DXA with a coefficient of determination (R2) of 0.91 and 0.85 for lean mass in men and women, respectively. As reported by Lee et al, lean body mass excluded bone density mineral content, total fat mass, and total percent fat [25]. Fat mass R2 was 0.90 and 0.93, for men and women, respectively [25]. The LFMR was computed as the quotient between the lean mass (kg) and the fat mass (kg). Finally, LFMR was divided into tertiles (highest, middle, lowest) by sex. Similarly, lean mass index (lean mass/height in meters2), and fat mass index (fat mass/height in meters2) were computed and divided into tertiles based on sex.
Covariates included sex (male vs. female), categorized age (30 - 44 years, 45 - 59 years, and 60 years or older), migration status (urban, rural, or migrant), current smoking status (yes vs. no), alcohol consumption (high vs. low), level of physical activity (low, moderate, or high), educational level (none/incomplete primary, complete primary, incomplete/complete secondary), and socioeconomic status (low, medium, and high). Migration status was defined based on participants’ baseline values as rural, migrant, or urban. Smoking and alcohol consumption responses were reported using an adapted version of the World Health Organization (WHO) STEPS questionnaire [28], while physical activity levels were defined according to the International Physical Activity Questionnaire (IPAQ) protocol [29].
WC was measured at the midpoint between the lower rib and the iliac crest. Height was measured with a precision of 0.1 cm using a stadiometer and standard stools. Weight was recorded with a precision of 0.05 kg, considering the individual lightly dressed, using an electronic scale (SECA model 940). The BMI was calculated using the formula (weight/height in meters2).
SBP and DBP measurements were taken in a seated position on the right arm at chest level. Three separate measurements were recorded with at least 5 min between each, using a previously validated oscillometer device for adults (Omron M5-i, Omron, Japan). The average of the last two SBP and DBP measurements was used for analysis.
Trained personnel performed all laboratory assessments. Venous samples were collected in the morning, after a minimum fasting period of 8 h. Fasting glucose and fasting insulin measurements were performed in plasma and whole blood, respectively. IR was evaluated using the HOMA-IR index, calculated as = (glucose (mg/dL) × insulin (µU/mL))/405. Triglyceride and HDL-cholesterol levels were determined in serum, while CRP was quantified in plasma [26].
Statistical analysis
STATA v17.0 was employed. Descriptive analyses were presented as absolute frequencies and percentages for categorical variables and median and interquartile ranges for numerical variables. Bivariate analysis was conducted using the Chi-squared test for independence and the Mann-Whitney test for categorical and numerical variables, respectively. For regression analysis, a generalized linear model with a log link and Poisson family with robust variance was fitted, obtaining crude and adjusted prevalence ratios (cPR and aPR) with 95% confidence interval (CI). Covariates in adjusted models included migration status, smoking, alcohol intake, physical activity level, educational attainment, and socioeconomic status (model 1). Two additional adjusted models, incorporating all covariates, along with the presence of overweight/obesity and abdominal obesity (model 2), and blood pressure and blood glucose control medication (model 3) were developed and run. Analyses were stratified by sex and age group. A significance level of P < 0.05 was considered for all analyses. In response to the identification of outliers, values of the LFMR equal to or exceeding 7 were excluded for sensitivity analysis. Subsequent regression models were then performed to ensure the robustness of the findings. To assess whether the LMFR showed superiority in assessing the association with cardiometabolic abnormalities compared to the individual lean mass and fat mass indexes, separate regression analyses were conducted for each index.
Ethical considerations
Ethical approval was obtained from the Universidad Peruana Cayetano Heredia (Ethics Committee approval number 60014). The study purpose was thoroughly explained, and informed consent was obtained. All procedures of the present study were conducted in compliance with the Helsinki Declaration for research on human beings [30]. As this study involved a secondary analysis of openly accessible data [31], there was no direct interaction with participants, mitigating potential risks.
| Results | ▴Top |
A total of 959 participants were included from the original sample of the PERU MIGRANT study. Excluded participants represented 3.03% of the original sample. The detailed exclusion process of the missing data on interest variables is shown in Figure 1.
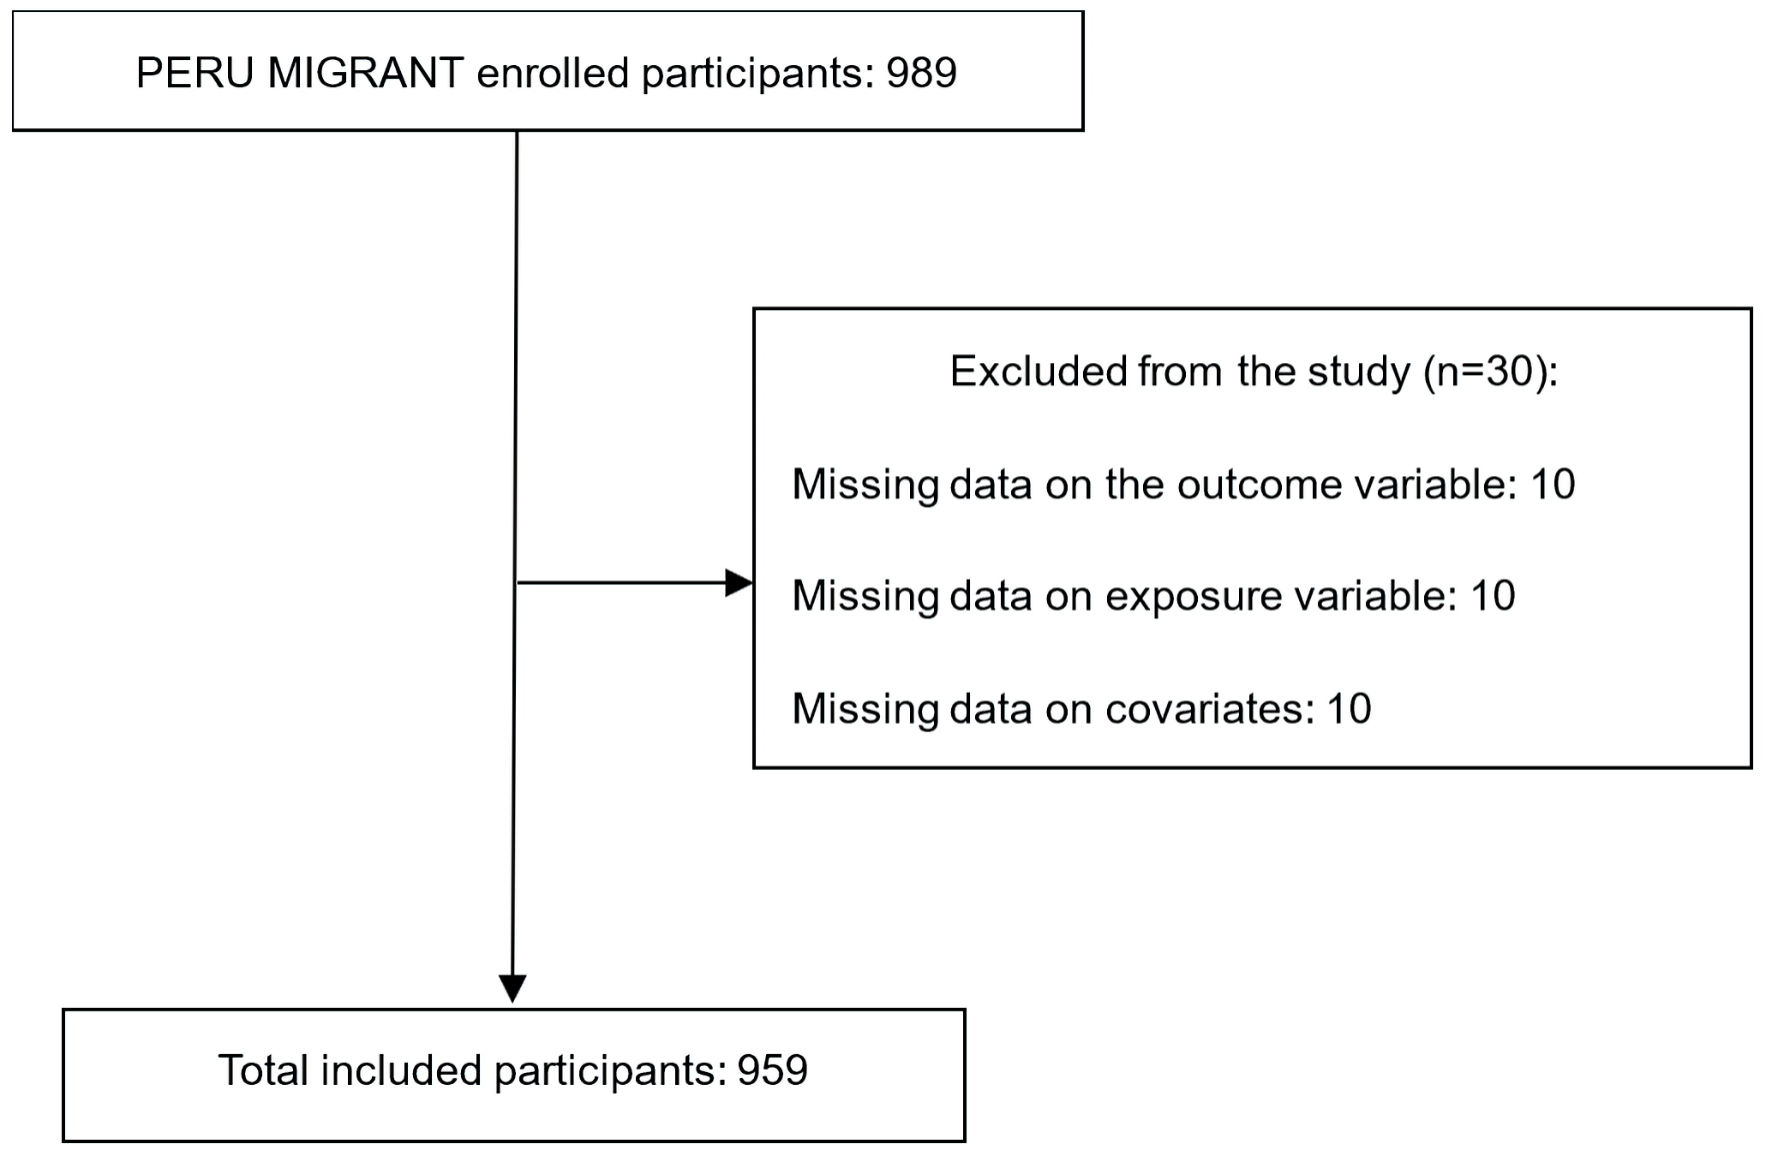 Click for large image | Figure 1. Flow diagram of participant selection. |
Females represented 53.18% of the sample. Only 14.91% were aged 60 years or older, more than half pertained to the migrant group, and socioeconomic status was equally distributed. The prevalence of smoking (11.26%) and alcohol intake (8.86%) was low, while most of the participants had moderate/high physical activity level. Neither blood pressure (3.75%) nor blood glucose control (0.94%) medication was frequent (Table 1). The LFMR tended to decrease with age both in males and females (Fig. 2). Those in the highest tertiles of the ratio showed the lowest values for weight, WC, lean mass, and fat mass adjusted by height both in men and women regardless of age (Supplementary Material 1, 2, www.jocmr.org).
 Click to view | Table 1. Sample Characteristics According to Cardiometabolic Abnormalities Presence |
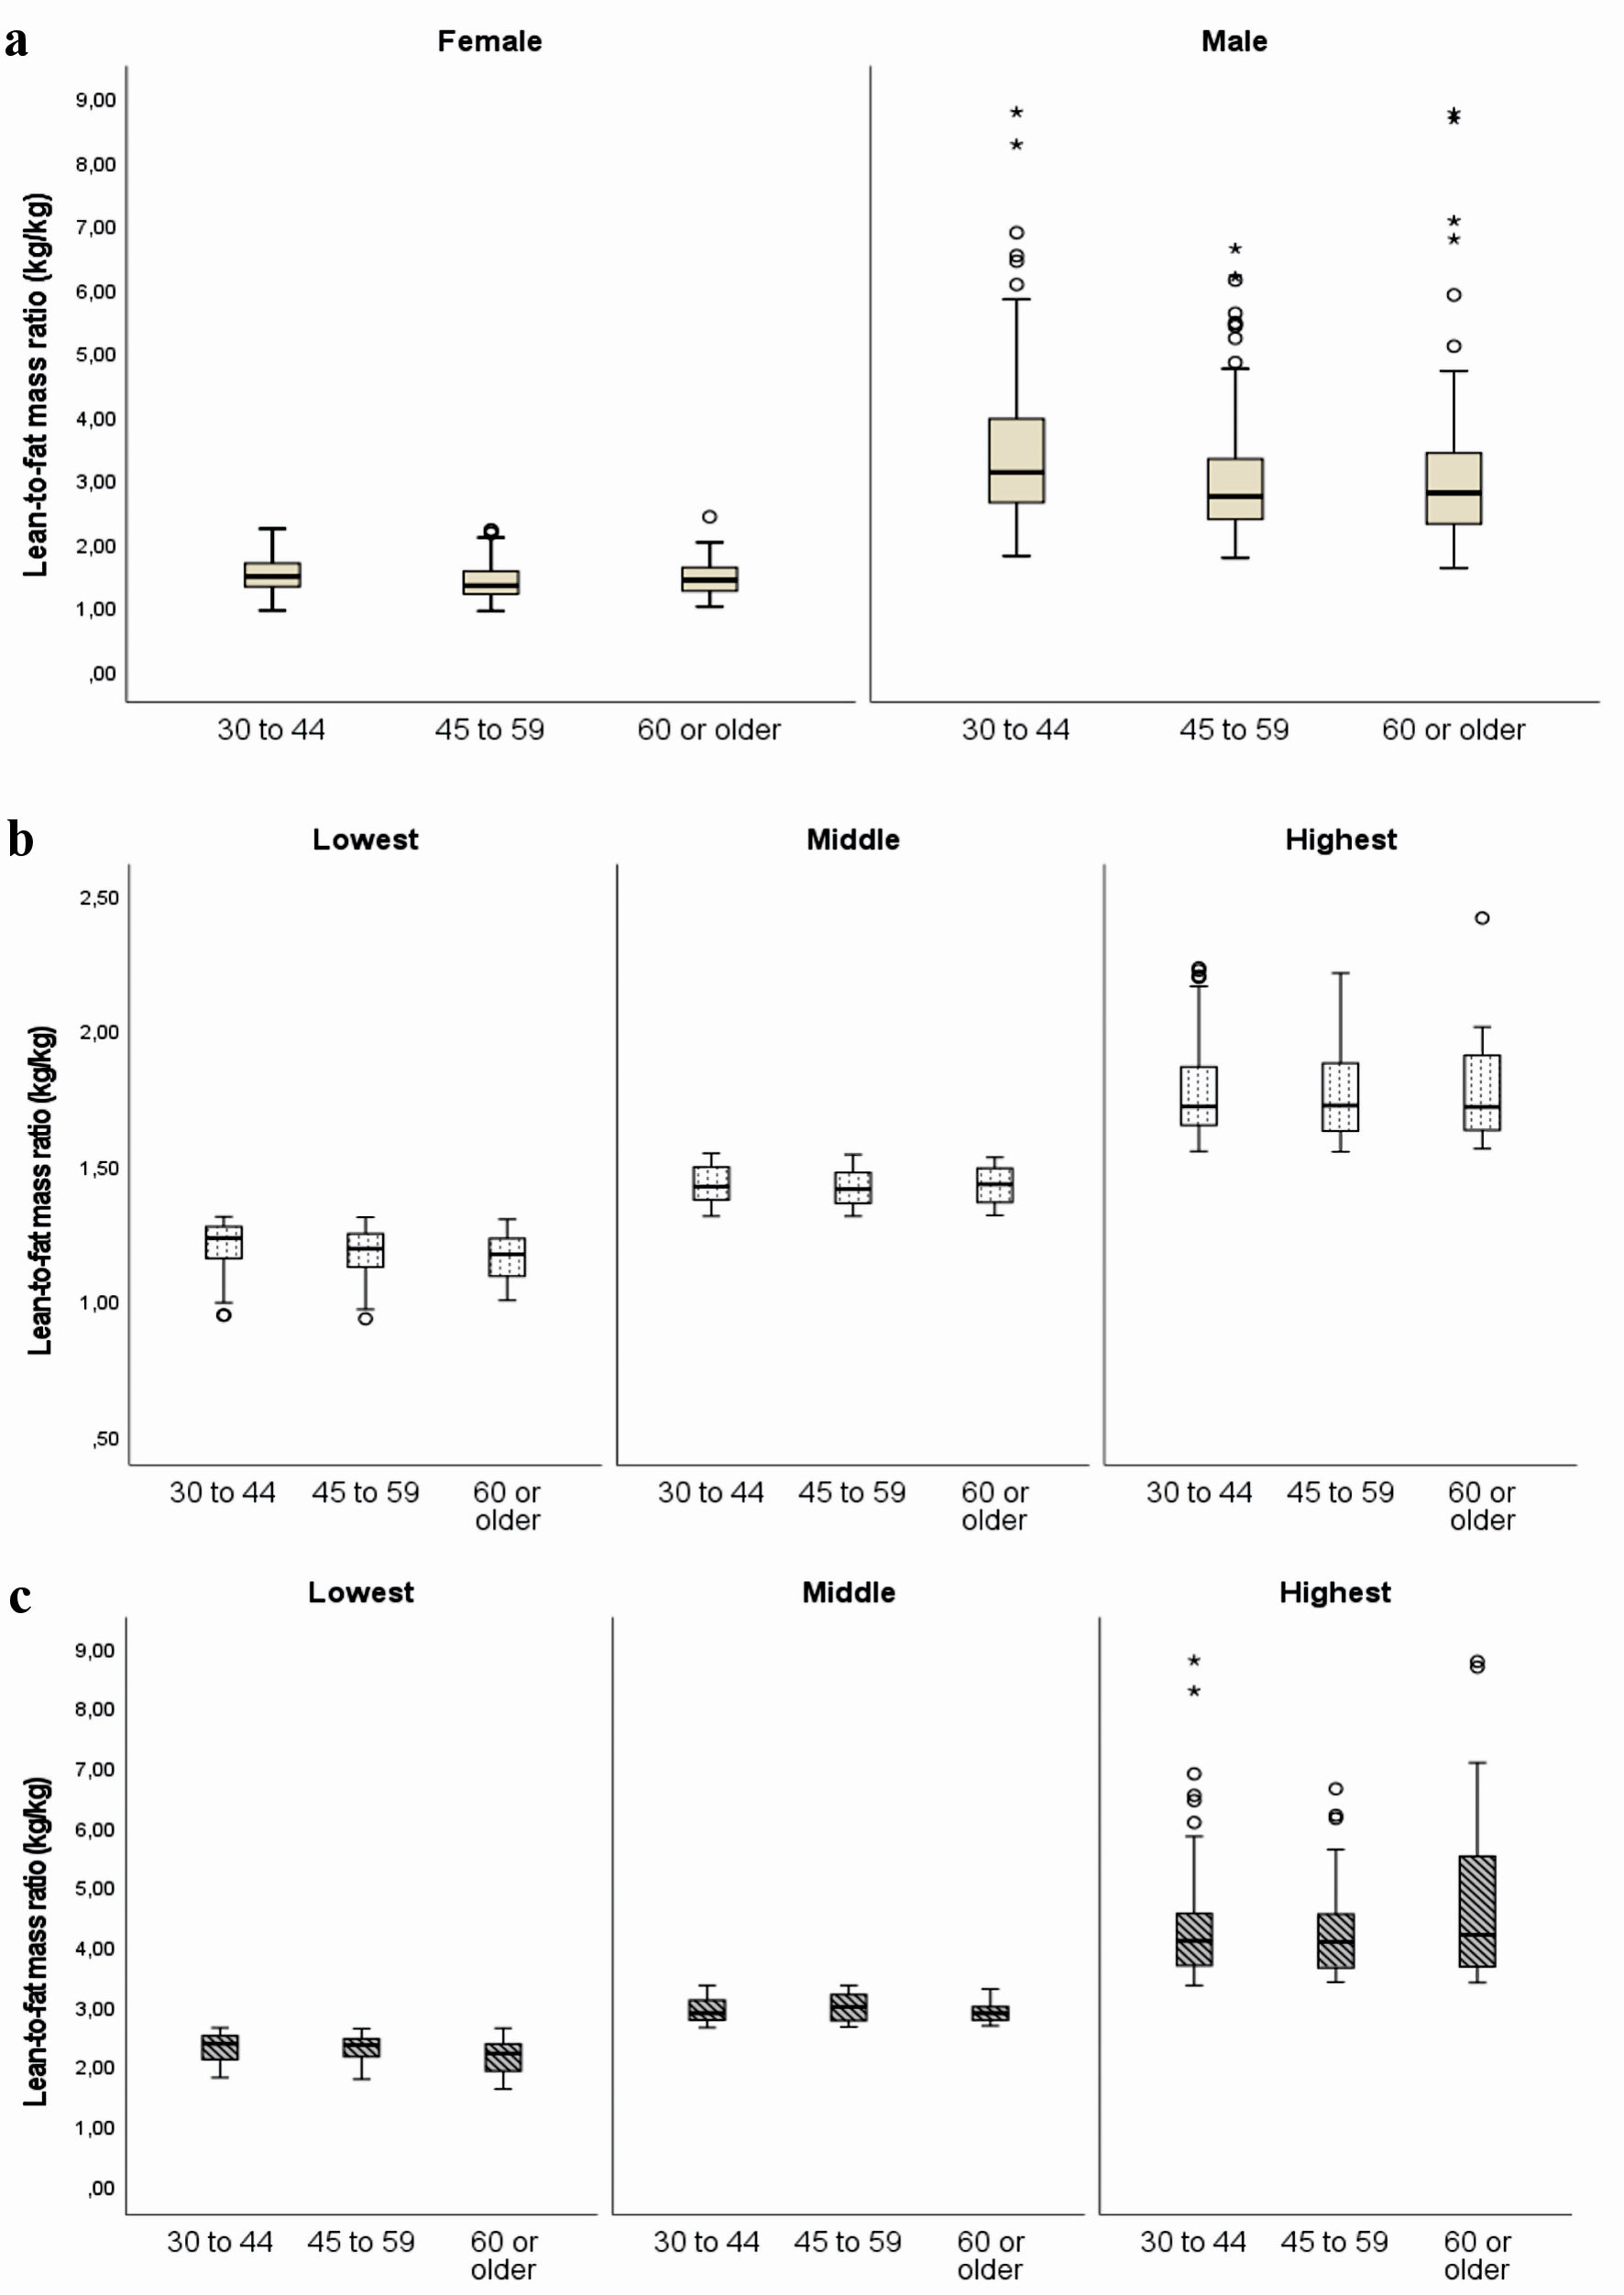 Click for large image | Figure 2. Lean-to-fat mass ratio (kg/kg) according to sex and age group (a). Lean-to-fat mass ratio (kg/kg) according to sex and age group, stratified by tertiles of the ratio are shown in (b) for women and (c) for men. |
Cardiometabolic abnormalities prevalence was present in 50.9% of the study population. The bivariate analysis showed that all the evaluated factors, but smoking, and socioeconomic status were statistically significantly differently distributed according to the presence of cardiometabolic abnormalities. Lean and fat mass adjusted by height were higher in the cardiometabolic abnormalities group compared to their healthy peers. Conversely, those with cardiometabolic abnormalities exhibited lower values of LFMR compared with their non-metabolically altered peers (Table 1). Each component of cardiometabolic abnormalities was less frequent among those in the highest LFMR group (Supplementary Material 3, www.jocmr.org). Furthermore, there was a significant variation in the number of cardiometabolic abnormalities based on the LFMR. More than half of individuals without abnormalities displayed a high ratio, while those with four or more abnormalities showed a notably high frequency of the lowest ratio (Fig. 3). Additionally, it was found that among those exhibiting cardiometabolic abnormalities, the most prevalent abnormality was low HDL-cholesterol (82.82%), followed by hypertriglyceridemia (67.69%). On the contrary, dysglycemia was the least prevalent abnormality (18.40%).
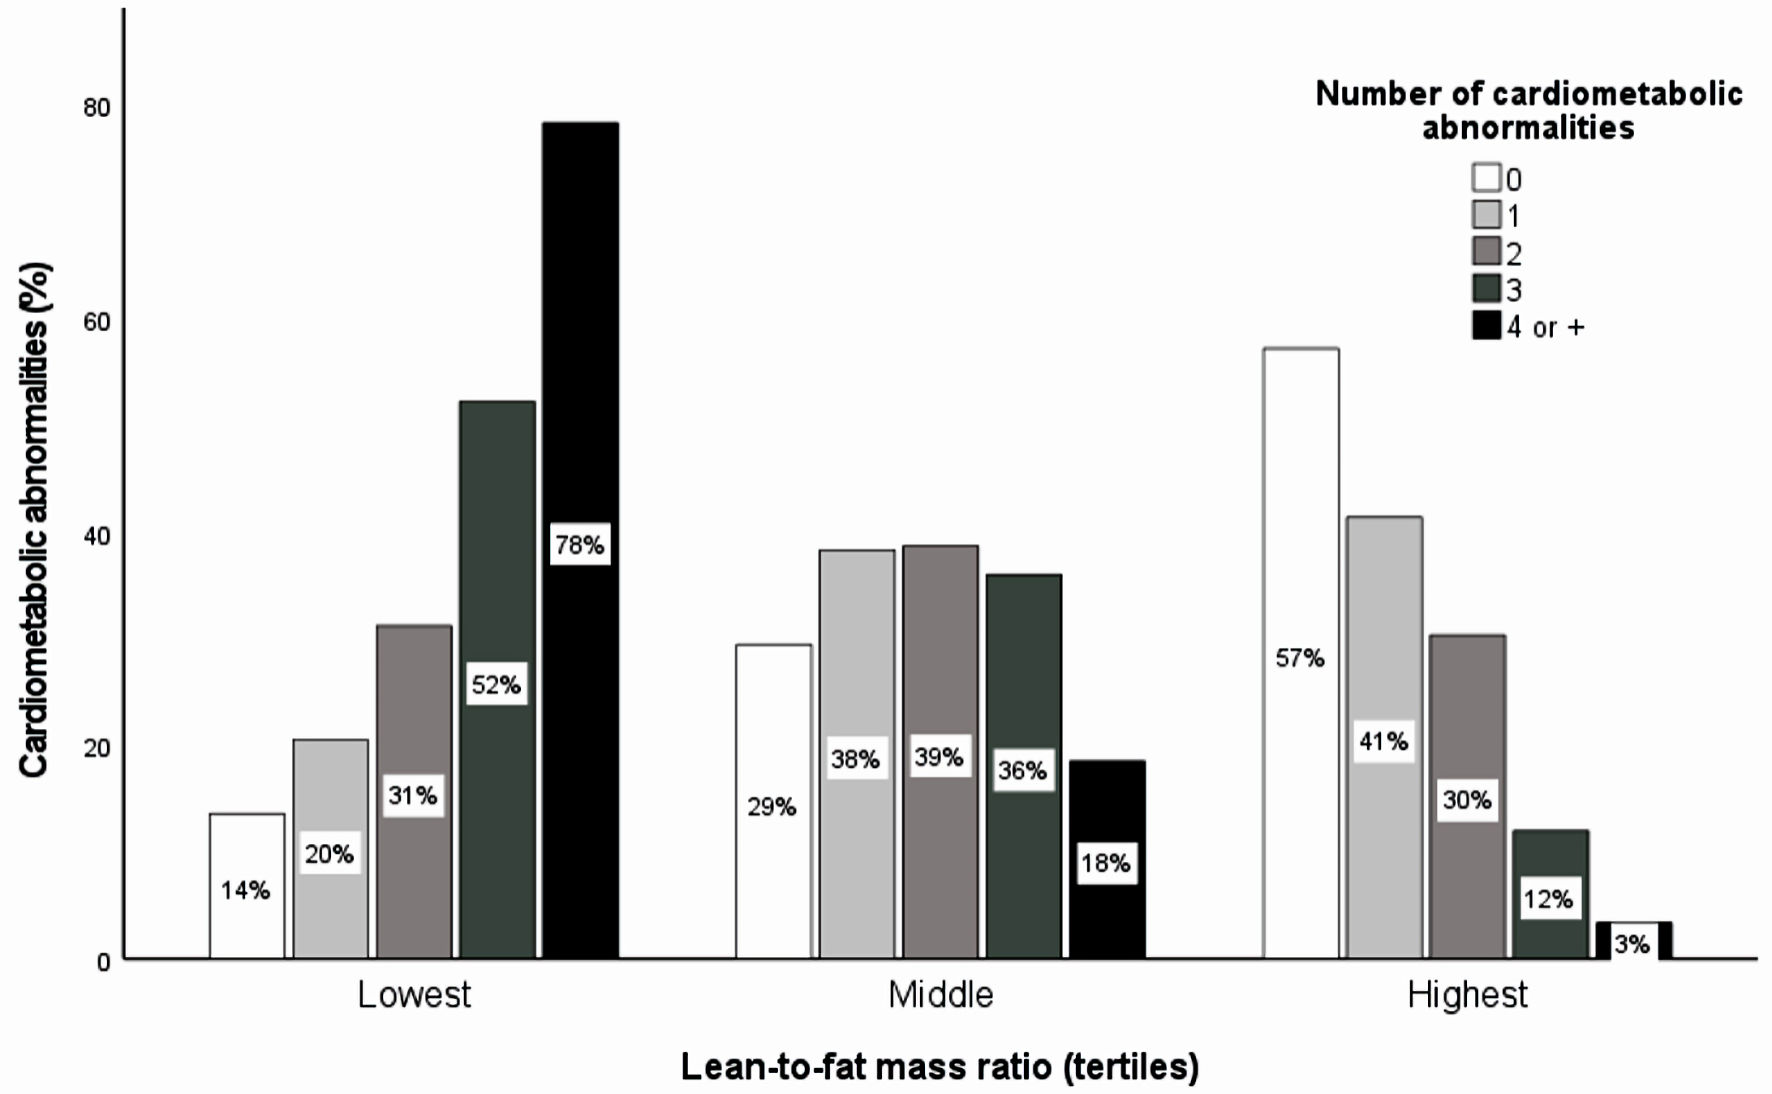 Click for large image | Figure 3. The proportion of cardiometabolic abnormalities according to lean-to-fat mass ratio tertiles by sex. Cardiometabolic abnormality was defined as a clustering of abnormalities that comprise hypertriglyceridemia, dysglycemia, altered blood pressure, low HDL-cholesterol, insulin resistance, and high C-reactive protein. The Chi-squared test for independence was performed for bivariate analysis between the number of cardiometabolic abnormalities and lean-to-fat mass ratio tertiles by sex (P < 0.001). HDL: high-density lipoprotein. |
The adjusted regression analysis for the association between the LFMR and cardiometabolic abnormalities was stratified by sex and age group. Among females aged 30 to 44 years, both the middle and highest ratio categories showed statistically significant inverse associations. The prevalence ratio (PR) was 0.57 (95% CI: 0.42 - 0.78) for the middle category and 0.22 (95% CI: 0.14 - 0.35) for the highest category. This trend persisted for females in the 45 to 59 years age group (PR: 0.74, 95% CI: 0.60 - 0.92; and PR 0.68, 95% CI: 0.50 - 0.92, respectively) and those aged 60 or older (PR: 0.61, 95% CI: 0.41 - 0.88; and PR 0.55, 95% CI: 0.35 - 0.84, respectively). In contrast, among men, a reduction in PR associated with increasing LFMR was observed only within the 30 to 44 years age group (PR: 0.5, 95% CI: 0.33 to 0.74; and PR 0.21, 95% CI: 0.11 to 0.37, for middle and highest categories, respectively). For men aged 45 to 59 years, an inverse association with cardiometabolic abnormalities was evident solely for the highest ratio category, while no statistically significant association emerged among men aged 60 or older. Further adjustments for the presence of overweight/obesity and abdominal (model 2), as well as blood pressure and blood glucose control medication (model 3), showed consistent patterns, indicating a decrease in cardiometabolic abnormalities prevalence as the LFMR increased (Table 2). These trends persisted after the exclusion of outliers in the sensitivity analysis.
Click to view | Table 2. Crude and Adjusted Regression Analysis for the Association of the Lean-to-Fat Mass Ratio and Cardiometabolic Abnormalities, Stratified by Sex and Age |
When separately assessing the associations of fat mass and lean mass indexes with cardiometabolic abnormalities, the highest tertiles of the lean mass index showed a positive association in all groups, except in men aged 45 to 59 years (Table 3). Similarly, the highest tertiles of the fat mass index were positively associated with cardiometabolic abnormalities for all groups but men aged 45 and older (Table 4). In the fully adjusted models for LFMR and the individual mass indexes, stronger associations for LFMR were revealed. Notably, women aged 30 to 44 exhibited a 7.69 times lower prevalence of abnormalities in the highest LFMR tertile, while the highest tertiles of lean and fat mass indexes showed a four-fold higher prevalence. Similar patterns were observed among women aged 60 or older and men aged 40 to 59, while in men aged 30 to 44, associations magnitudes of the LFMR, lean, and fat mass indexes were comparable.
Click to view | Table 3. Crude and Adjusted Regression Analysis for the Association of the Lean Mass Index and Cardiometabolic Abnormalities, Stratified by Sex and Age |
Click to view | Table 4. Crude and Adjusted Regression Analysis for the Association of the Fat Mass Index and Cardiometabolic Abnormalities, Stratified by Sex and Age |
| Discussion | ▴Top |
Main findings
Our study makes a distinctive contribution to the understanding of body composition and its implications for cardiometabolic health. Unlike many previous investigations solely focusing on larger lean mass or low body fat, we specifically explored the LFMR which offers a different perspective on the interplay between lean and fat mass components, providing insights beyond conventional assessments. Our examination of LFMR allows for a more nuanced understanding of these lean and fat mass relationships.
Our data revealed a statistically significant inverse association between the LFMR and the prevalence of cardiometabolic abnormalities. This inverse association was consistently observed in females across all age groups, following a dose-related pattern. In contrast, among males, the same relationship was evident only in those under the age of 60 years. Furthermore, LFMR showed superiority compared to the individual lean and fat mass indexes.
Comparison with previous studies
The prevalence of cardiometabolic abnormalities identified in the present study aligns with earlier investigations in the North American population, reporting a prevalence of 46% [6, 32]. Similarly, a systematic review highlighted a wide-ranging prevalence of MetS among Latin Americans, ranging from 18.8% to 43.3%. It is noteworthy that the criteria used in this review were based on the Adult Treatment Panel-III, which incorporates WC as one of the cardiometabolic components. In contrast, our study utilized a modified version of the Wildman criteria [6]. Nevertheless, our findings, particularly regarding low HDL-cholesterol and hypertriglyceridemia, were consistent with the results of the present study. This can be explained by the genetic-related ethnic differences in lipid metabolism favoring a lower HDL-cholesterol and higher serum triglycerides in the Latin American population [33-35].
Previous research has demonstrated that the reciprocal of LFMR (i.e., fat-to-lean mass ratio) is associated with a higher prevalence of hyperinsulinemia [21], MetS [36], glucose intolerance, altered fasting glucose, and type-2 diabetes [37]. It has also shown positive correlations with the HOMA index [20] and inflammatory markers like CRP and interleukin-6 [22]. Collectively these findings suggest that maintaining a higher proportion of lean mass relative to fat mass may serve as a protective factor against metabolic disturbances. This aligns with the conceptual framework of the metabolic load and metabolic capacity model postulated by Wells [38], wherein fat mass is construed as the metabolic load and lean mass as the metabolic capacity. According to this model, not only the levels of fat mass but also its interaction with lean tissues contribute to modifying the metabolic response. Dysfunctional hypertrophic adipose tissue is linked to increased leptin secretion, reduced omentin, and adiponectin release, therefore increasing pro-inflammatory cytokines release and promoting adipose tissue IR and systemic metabolically induced inflammation [39]. Furthermore, a low-grade leakage of fatty acids from hypertrophic adipose tissue contributes to lipid ectopic deposition in lean organs such as the skeletal muscle, further contributing to metabolic dysfunctions [40]. Lean mass is primarily composed of skeletal muscle, an active metabolic tissue known for its role in insulin sensitivity and glucose uptake [41] and has been positively related to metabolic health [41-43]. Consistent with this idea, other studies analyzing the muscle-to-fat mass ratio demonstrated its high diagnostic accuracy for MetS [44] and insulin sensitivity measured by hyperinsulinemic-euglycemic clamp [45, 46]. Individuals presenting low values of this index were more likely to exhibit a higher prevalence of MetS and its components [44]. Similarly, a 12-year cohort study reported that the highest quintile of the fat-to-muscle ratio, indicative of a low muscle-to-fat ratio, showed nearly a 30% higher risk for CVD mortality among men, regardless of age [47]. Our findings may be attributed, at least in part, to the intricate relationships between adipose and lean tissues.
In the present study, the protective effect of a high LFMR was notably absent in older men even after further adjustments for BMI, abdominal obesity status, and medication. Several factors, including age [48], and ethnicity [49] related to accretion, distribution, and function of the fat and lean mass may contribute to nullifying the protective effect of a high LFMR against metabolic perturbations. A 15-year cohort study found that a high lean mass was not protective against type 2 diabetes mellitus development among elderly Europeans [50]. Notably, individuals with the highest levels of both lean and fat mass exhibited the most adverse metabolic profile when compared to other combinations of lean and fat mass phenotypes. This can be explained by the association of high-fat mass with increased muscle lipid infiltration, potentially impairing normal muscle metabolic function [48]. Furthermore, aging might promote sex-specific body fat accretion, function, and distribution patterns. For instance, fat mass accretion peaks at 65 to 75 in men, occurring later in women [19, 51]. While aging-induced redistribution of subcutaneous adipose tissue (SAT) to visceral adipose tissue (VAT) is acknowledged, evidence of a higher capacity of VAT expandability in the female sex and lower macrophage infiltration in the liver compared to male has emerged from animal studies [52]. Varghese et al found that a high-fat diet significantly increased VAT in females but not in male older mice, whereas the males increased their liver lipid content [52]. Moreover, when comparing young and old female mice, no difference was found regarding pro-inflammatory adipose tissue macrophage infiltration, but the opposite was observed for aged male mice [52]. Aging in males may lead to reduced VAT expandability, potentially increasing the ectopic fat accretion in lean tissues such as skeletal muscle [48] and reducing its capacity to protect against cardiometabolic risk. These findings suggest that sex differences, coupled with the effects of aging, could help elucidate the divergent role of a high LFMR among older individuals. However, further research is necessary to confirm the observed trends among elderly men.
Implications of the findings
Our study highlights key findings on body composition and metabolic health. A higher LFMR was associated with significantly lower cardiometabolic abnormalities prevalence (up to 87% in women and 74% in men). LFMR demonstrated stronger associations with cardiometabolic abnormalities compared to individual indexes of lean and fat mass. Contrary to the paradigm of a larger lean mass as a metabolic health-protecting factor, our findings challenge this notion. Across age groups and sexes, those with the highest LFMR had the lowest lean and fat mass indexes. Conversely, those with cardiometabolic abnormalities had the highest values of these indexes. This is in line with previous reports that interventional studies aiming at increasing lean mass have not shown a protective role in metabolic health [53]. This underscores the significance of assessing both lean and fat mass in an integrated manner, rather than relying on conventional individual assessments.
Different methodological approaches have been used in integrating these two components, leading to different findings. In a study among non-elderly adult Koreans, body composition phenotypes based on the separate median values of muscle and fat mass found that the high-muscle/low-fat phenotype was not significantly associated with MetS when compared to the low-muscle/low-fat peers [16]. Conversely, studies analyzing the fat-to-lean mass ratio have consistently shown its association with different cardiometabolic health alterations [20-22, 36, 37].
The absence of a protective effect of LFMR for cardiometabolic abnormalities among older men underscores the need for more tailored interventions and emphasizes the potential role of other factors such as hormonal changes, age-related metabolic alterations [54], genetic polymorphisms for lean and fat mass interaction [55], and skeletal mass strength assessment [56]. Further research is needed to fully understand the mechanisms and develop age-specific strategies.
With roughly 21% of CVD stemming from cardiometabolic disorders, leading to 4.3-year reductions in life expectancy [57], our findings underscore the potential of LFMR as an assessment tool for optimizing body composition and differentiation of metabolic subtypes, therefore promoting metabolic health, and substantially mitigating CVD risk. This is particularly relevant in ethnically diverse populations, such as those in Latin America, where cardiometabolic alterations are highly prevalent [7].
Study limitations
The present study had several limitations that should be considered. Lean and fat mass components were not directly assessed with objective methods, rather they were estimated by regression equations validated against the DXA data derived from the National Health and Nutrition Examination Survey (NHANES) in the USA which included the Latino population, relying on weight, height, and waist. While these equations demonstrated high accuracy, it is essential to recognize that direct measurements of lean and fat mass might provide even greater precision. Furthermore, the use of high-cost methods like DXA in clinical and epidemiological settings, especially in low-middle-income countries like Peru, may encounter practical limitations. Several potentially confounding variables, including dietary intake, energy expenditure, dyslipidemia medication, muscle strength, and visceral fat measurements, were not considered due to their unavailability in the original dataset. Similarly, endocrine diseases, other than diabetes mellitus were not considered in the original design of the PERU MIGRANT study. These variables could influence the observed relationships, and their absence represents a limitation. Nevertheless, additional adjustments using WC and BMI as well as blood pressure and glucose control medication were made, with significant trends persisting. Similarly, endocrine diseases, other than diabetes mellitus, have a low prevalence in community settings [58], so different trends in the reported findings are not expected. Finally, the cross-sectional nature of the study limits our ability to establish causal relationships. While it provides valuable insights into associations, it cannot elucidate the direction of causality or the temporal evolution of the observed effects.
Conclusions
The present findings suggest that a high LFMR may serve as a protective factor against cardiometabolic abnormalities. By integrating the contrasting influences of fat and lean mass depots, this ratio may provide a more suitable surrogate for differentiating metabolic subtypes. Nevertheless, it is crucial to recognize that the protective effect may vary with age and sex, as observed in the case of elderly men who did not exhibit significant protection. Therefore, further investigations that consider regional body composition and the dynamic interaction of these key components across different age groups are warranted.
| Supplementary Material | ▴Top |
Suppl 1. Body composition variables according to sex, age, and LFMR tertiles in men.
Suppl 2. Body composition variables according to sex, age, and LFMR tertiles in women.
Suppl 3. Bivariate analysis of the sample characteristics according to LFMR in tertiles.
Acknowledgments
We are grateful to “CRONICAS Centro de Excelencia en Enfermedades Cronicas” for generously sharing the resources of the PERU MIGRANT study database with the public, and to Walter Suárez-Carmona for his comments during revising of this manuscript.
Financial Disclosure
There was no specific funding source to be mentioned.
Conflict of Interest
The authors declare no conflict of interest.
Informed Consent
All subjects provided written informed consent.
Author Contributions
Jamee Guerra Valencia and Antonio Castillo-Paredes participated in the genesis of the idea and project design. Jamee Guerra Valencia, Antonio Castillo-Paredes, and Carolina Gibaja-Arce have drafted the manuscript and did critical editing. Jamee Guerra Valencia and Lorena Saavedra-Garcia were in charge of the data curation, analysis, and interpretation of results. Lorena Saavedra-Garcia and Noel C. Barengo have carefully supervised this manuscript’s preparation and writing.
Data Availability
The data supporting the findings of this study can be accessed by the original research paper at the following link: https://doi.org/10.1186/1471-2261-9-23.
Abbreviations
CVDs: cardiovascular diseases; CAs: cardiometabolic abnormalities; LFMR: lean-to-fat mass ratio; cPR: crude prevalence ratio; aPR: adjusted prevalence ratio; DALYs: disability-adjusted life years; CRP: C-reactive protein; MetS: metabolic syndrome; BMI: body mass index; WC: waist circumference; DXA: dual-energy X-ray absorptiometry; HOMA-IR: homeostatic model assessment-insulin resistance; SBP: systolic blood pressure; DBP: diastolic blood pressure; IR: insulin resistance; IPAQ: International Physical Activity Questionnaire; SAT: subcutaneous adipose tissue; VAT: visceral adipose tissue; NHANES: National Health and Nutrition Examination Survey
| References | ▴Top |
- DALYs GBD, Collaborators H. Global, regional, and national disability-adjusted life-years (DALYs) for 359 diseases and injuries and healthy life expectancy (HALE) for 195 countries and territories, 1990-2017: a systematic analysis for the Global Burden of Disease Study 2017. Lancet. 2018;392(10159):1859-1922.
doi pubmed pmc - WHO. Cardiovascular diseases (CVDs). Worl Health Organization; 2021. Available from: https://www.who.int/news-room/fact-sheets/detail/cardiovascular-diseases-(cvds).
- Fernando L, Pamela S, Alejandra L. Cardiovascular disease in Latin America: the growing epidemic. Prog Cardiovasc Dis. 2014;57(3):262-267.
doi pubmed - Vaduganathan M, Mensah GA, Turco JV, Fuster V, Roth GA. The global burden of cardiovascular diseases and risk: a compass for future health. J Am Coll Cardiol. 2022;80(25):2361-2371.
doi pubmed - Mottillo S, Filion KB, Genest J, Joseph L, Pilote L, Poirier P, Rinfret S, et al. The metabolic syndrome and cardiovascular risk a systematic review and meta-analysis. J Am Coll Cardiol. 2010;56(14):1113-1132.
doi pubmed - Wildman RP, Muntner P, Reynolds K, McGinn AP, Rajpathak S, Wylie-Rosett J, Sowers MR. The obese without cardiometabolic risk factor clustering and the normal weight with cardiometabolic risk factor clustering: prevalence and correlates of 2 phenotypes among the US population (NHANES 1999-2004). Arch Intern Med. 2008;168(15):1617-1624.
doi pubmed - Marquez-Sandoval F, Macedo-Ojeda G, Viramontes-Horner D, Fernandez Ballart JD, Salas Salvado J, Vizmanos B. The prevalence of metabolic syndrome in Latin America: a systematic review. Public Health Nutr. 2011;14(10):1702-1713.
doi pubmed - Hamjane N, Benyahya F, Nourouti NG, Mechita MB, Barakat A. Cardiovascular diseases and metabolic abnormalities associated with obesity: What is the role of inflammatory responses? A systematic review. Microvasc Res. 2020;131:104023.
doi pubmed - Piqueras P, Ballester A, Dura-Gil JV, Martinez-Hervas S, Redon J, Real JT. Anthropometric indicators as a tool for diagnosis of obesity and other health risk factors: a literature review. Front Psychol. 2021;12:631179.
doi pubmed pmc - Rico-Martin S, Calderon-Garcia JF, Sanchez-Rey P, Franco-Antonio C, Martinez Alvarez M, Sanchez Munoz-Torrero JF. Effectiveness of body roundness index in predicting metabolic syndrome: A systematic review and meta-analysis. Obes Rev. 2020;21(7):e13023.
doi pubmed - Fan L, Qiu J, Zhao Y, Yin T, Li X, Wang Q, Jing J, et al. The association between body composition and metabolically unhealthy profile of adults with normal weight in Northwest China. PLoS One. 2021;16(3):e0248782.
doi pubmed pmc - Saklayen MG. The Global Epidemic of the Metabolic Syndrome. Curr Hypertens Rep. 2018;20(2):12.
doi pubmed pmc - Wang B, Zhuang R, Luo X, Yin L, Pang C, Feng T, You H, et al. Prevalence of metabolically healthy obese and metabolically obese but normal weight in adults worldwide: a meta-analysis. Horm Metab Res. 2015;47(11):839-845.
doi pubmed - Hwang YC, Cho IJ, Jeong IK, Ahn KJ, Chung HY. Differential association between sarcopenia and metabolic phenotype in Korean young and older adults with and without obesity. Obesity (Silver Spring). 2017;25(1):244-251.
doi pubmed - Kim BC, Kim MK, Han K, Lee SY, Lee SH, Ko SH, Kwon HS, et al. Low muscle mass is associated with metabolic syndrome only in nonobese young adults: the Korea National Health and Nutrition Examination Survey 2008-2010. Nutr Res. 2015;35(12):1070-1078.
doi pubmed - Kim K, Park SM. Association of muscle mass and fat mass with insulin resistance and the prevalence of metabolic syndrome in Korean adults: a cross-sectional study. Sci Rep. 2018;8(1):2703.
doi pubmed pmc - Kim TN, Park MS, Yang SJ, Yoo HJ, Kang HJ, Song W, Seo JA, et al. Body size phenotypes and low muscle mass: the Korean sarcopenic obesity study (KSOS). J Clin Endocrinol Metab. 2013;98(2):811-817.
doi pubmed - Xourafa G, Korbmacher M, Roden M. Inter-organ crosstalk during development and progression of type 2 diabetes mellitus. Nat Rev Endocrinol. 2024;20(1):27-49.
doi pubmed - Zamboni M, Mazzali G, Brunelli A, Saatchi T, Urbani S, Giani A, Rossi AP, et al. The role of crosstalk between adipose cells and myocytes in the pathogenesis of sarcopenic obesity in the elderly. Cells. 2022;11(21):3361.
doi pubmed pmc - Ezeh U, Pall M, Mathur R, Azziz R. Association of fat to lean mass ratio with metabolic dysfunction in women with polycystic ovary syndrome. Hum Reprod. 2014;29(7):1508-1517.
doi pubmed pmc - Gamboa-Gomez CI, Guerrero-Romero F, Aradillas-Garcia C, Rodriguez-Moran M, Simental-Mendia LE. The fat-to-lean mass ratio is associated with hyperinsulinemia in healthy Mexican adolescents. J Am Coll Nutr. 2021;40(3):219-223.
doi pubmed - Lee HS, Kim SG, Kim JK, Lee YK, Noh JW, Oh J, Kim HJ, et al. Fat-to-lean mass ratio can predict cardiac events and all-cause mortality in patients undergoing hemodialysis. Ann Nutr Metab. 2018;73(3):241-249.
doi pubmed - Xue H, Du H, Xie Y, Zhai Y, Song S, Luo B, Qiu H, et al. Association between fat mass to lean body mass ratio and all-cause mortality among middle-aged and elderly cancer patients without obesity: a multi-center observational study in China. Front Nutr. 2022;9:914020.
doi pubmed pmc - Gonzalez MC, Orlandi SP, Santos LP, Barros AJD. Body composition using bioelectrical impedance: Development and validation of a predictive equation for fat-free mass in a middle-income country. Clin Nutr. 2019;38(5):2175-2179.
doi pubmed - Lee DH, Keum N, Hu FB, Orav EJ, Rimm EB, Sun Q, Willett WC, et al. Development and validation of anthropometric prediction equations for lean body mass, fat mass and percent fat in adults using the National Health and Nutrition Examination Survey (NHANES) 1999-2006. Br J Nutr. 2017;118(10):858-866.
doi pubmed - Miranda JJ, Gilman RH, Garcia HH, Smeeth L. The effect on cardiovascular risk factors of migration from rural to urban areas in Peru: PERU MIGRANT Study. BMC Cardiovasc Disord. 2009;9:23.
doi pubmed pmc - Stefan N. Metabolically Healthy and Unhealthy Normal Weight and Obesity. Endocrinol Metab (Seoul). 2020;35(3):487-493.
doi pubmed pmc - Riley L, Guthold R, Cowan M, Savin S, Bhatti L, Armstrong T, Bonita R. The World Health Organization STEPwise approach to noncommunicable disease risk-factor surveillance: methods, challenges, and opportunities. Am J Public Health. 2016;106(1):74-78.
doi pubmed pmc - IPAQ. Guidelines for data processing and analysis of the international physical activity questionnaire (IPAQ) - short and long forms. IPAQ web site: IPAQ; 2005. Available from: https://sites.google.com/view/ipaq/score.
- WMA. WMA declaration of Helsinki - ethical principles for medical research involving human subjects: World Medical Association (WMA); 2022. Available from: https://www.wma.net/policies-post/wma-declaration-of-helsinki-ethical-principles-for-medical-research-involving-human-subjects/.
- PERU Migrant Study | Baseline and 5yr follow-up dataset [Internet]. Figshare. 2017. [cited August 1st, 2023].
- Shea JL, Randell EW, Sun G. The prevalence of metabolically healthy obese subjects defined by BMI and dual-energy X-ray absorptiometry. Obesity (Silver Spring). 2011;19(3):624-630.
doi pubmed - Aguilar-Salinas CA, Canizales-Quinteros S, Rojas-Martinez R, Mehta R, Villarreal-Molina MT, Arellano-Campos O, Riba L, et al. Hypoalphalipoproteinemia in populations of Native American ancestry: an opportunity to assess the interaction of genes and the environment. Curr Opin Lipidol. 2009;20(2):92-97.
doi pubmed - Mora-Garcia G, Gomez-Camargo D, Alario A, Gomez-Alegria C. A common variation in the caveolin 1 gene is associated with high serum triglycerides and metabolic syndrome in an admixed Latin American population. Metab Syndr Relat Disord. 2018;16(9):453-463.
doi pubmed pmc - Torres-Valadez R, Roman S, Ojeda-Granados C, Gonzalez-Aldaco K, Panduro A. Differential distribution of gene polymorphisms associated with hypercholesterolemia, hypertriglyceridemia, and hypoalphalipoproteinemia among Native American and Mestizo Mexicans. World J Hepatol. 2022;14(7):1408-1420.
doi pubmed pmc - Seo YG, Song HJ, Song YR. Fat-to-muscle ratio as a predictor of insulin resistance and metabolic syndrome in Korean adults. J Cachexia Sarcopenia Muscle. 2020;11(3):710-725.
doi pubmed pmc - Gamboa-Gomez CI, Simental-Mendia LE, Rodriguez-Moran M, Guerrero-Romero F. The fat-to-lean mass ratio, a novel anthropometric index, is associated to glucose metabolic disorders. Eur J Intern Med. 2019;63:74-78.
doi pubmed - Wells JCK. Body composition and susceptibility to type 2 diabetes: an evolutionary perspective. Eur J Clin Nutr. 2017;71(7):881-889.
doi pubmed - Hagberg CE, Spalding KL. White adipocyte dysfunction and obesity-associated pathologies in humans. Nat Rev Mol Cell Biol. 2023.
doi pubmed - Kiefer LS, Fabian J, Rospleszcz S, Lorbeer R, Machann J, Kraus MS, Roemer F, et al. Distribution patterns of intramyocellular and extramyocellular fat by magnetic resonance imaging in subjects with diabetes, prediabetes and normoglycaemic controls. Diabetes Obes Metab. 2021;23(8):1868-1878.
doi pubmed - Lee MJ, Kim EH, Bae SJ, Choe J, Jung CH, Lee WJ, Kim HK. Protective role of skeletal muscle mass against progression from metabolically healthy to unhealthy phenotype. Clin Endocrinol (Oxf). 2019;90(1):102-113.
doi pubmed - Carvalho CJ, Longo GZ, Kakehasi AM, Pereira PF, Segheto KJ, Juvanhol LL, Ribeiro AQ. Skeletal mass indices are inversely associated with metabolically unhealthy phenotype in overweight/obese and normal-weight men: a population-based cross-sectional study. Br J Nutr. 2021;126(4):501-509.
doi pubmed - Zanetti MM, Lima e Silva Ld, Sena MAdB, Neves EB, Ferreira PF, Keese F, et al. Correlacion entre parametros antropometricos y riesgo cadiometabolico en militares (Correlation between anthropometric parameters and cardiometabolic risk in military). Retos. 2022;44(0):1099-1103.
- Park J, Kim S. Validity of muscle-to-fat ratio as a predictor of adult metabolic syndrome. J Phys Ther Sci. 2016;28(3):1036-1045.
doi pubmed pmc - Kurinami N, Sugiyama S, Yoshida A, Hieshima K, Miyamoto F, Kajiwara K, Jinnouch K, et al. Body muscle-to-fat ratio gender-specific cut-off values for impaired insulin sensitivity in patients with treatment-naive type 2 diabetes mellitus. Endocrine. 2019;66(3):503-508.
doi pubmed - Kurinami N, Sugiyama S, Yoshida A, Hieshima K, Miyamoto F, Kajiwara K, Jinnouch K, et al. Body muscle-to-fat ratio, rather than fat-to-muscle ratio, significantly correlates with measured insulin resistance in patients with type 2 diabetes mellitus. J Clin Med Res. 2021;13(7):387-391.
doi pubmed pmc - Yu B, Sun Y, Du X, Zhang H, Chen C, Tan X, Yang Z, et al. Age-specific and sex-specific associations of visceral adipose tissue mass and fat-to-muscle mass ratio with risk of mortality. J Cachexia Sarcopenia Muscle. 2023;14(1):406-417.
doi pubmed pmc - Gueugneau M, Coudy-Gandilhon C, Theron L, Meunier B, Barboiron C, Combaret L, Taillandier D, et al. Skeletal muscle lipid content and oxidative activity in relation to muscle fiber type in aging and metabolic syndrome. J Gerontol A Biol Sci Med Sci. 2015;70(5):566-576.
doi pubmed - Lear SA, Kohli S, Bondy GP, Tchernof A, Sniderman AD. Ethnic variation in fat and lean body mass and the association with insulin resistance. J Clin Endocrinol Metab. 2009;94(12):4696-4702.
doi pubmed - Rehunen SKJ, Kautiainen H, Korhonen PE, Eriksson JG. A high lean body mass is not protecting from type 2 diabetes in the presence of a high body fat mass. Diabetes Metab. 2021;47(6):101219.
doi pubmed - Kim IH, Xu J, Liu X, Koyama Y, Ma HY, Diggle K, You YH, et al. Aging increases the susceptibility of hepatic inflammation, liver fibrosis and aging in response to high-fat diet in mice. Age (Dordr). 2016;38(4):291-302.
doi pubmed pmc - Varghese M, Griffin C, McKernan K, Eter L, Abrishami S, Singer K. Female adipose tissue has improved adaptability and metabolic health compared to males in aged obesity. Aging (Albany NY). 2020;12(2):1725-1746.
doi pubmed pmc - Lagace JC, Brochu M, Dionne IJ. A counterintuitive perspective for the role of fat-free mass in metabolic health. J Cachexia Sarcopenia Muscle. 2020;11(2):343-347.
doi pubmed pmc - Varghese M, Song J, Singer K. Age and Sex: Impact on adipose tissue metabolism and inflammation. Mech Ageing Dev. 2021;199:111563.
doi pubmed pmc - Karasik D, Zillikens MC, Hsu YH, Aghdassi A, Akesson K, Amin N, Barroso I, et al. Disentangling the genetics of lean mass. Am J Clin Nutr. 2019;109(2):276-287.
doi pubmed pmc - Wei L, Zeng J, Fan M, Chen B, Li X, Li Y, Xu S. Associations between handgrip strength and skeletal muscle mass with all-cause mortality and cardiovascular mortality in people with type 2 diabetes: A prospective cohort study of the UK Biobank. J Diabetes. 2024;16(1):e13464.
doi pubmed pmc - Cao X, Zhang L, Wang X, Chen Z, Zheng C, Chen L, Zhou H, et al. Cardiovascular disease and all-cause mortality associated with individual and combined cardiometabolic risk factors. BMC Public Health. 2023;23(1):1725.
doi pubmed pmc - Wu J, Lin X, Huang X, Shen Y, Shan PF. Global, regional and national burden of endocrine, metabolic, blood and immune disorders 1990-2019: a systematic analysis of the Global Burden of Disease study 2019. Front Endocrinol (Lausanne). 2023;14:1101627.
doi pubmed pmc
This article is distributed under the terms of the Creative Commons Attribution Non-Commercial 4.0 International License, which permits unrestricted non-commercial use, distribution, and reproduction in any medium, provided the original work is properly cited.
Journal of Clinical Medicine Research is published by Elmer Press Inc.