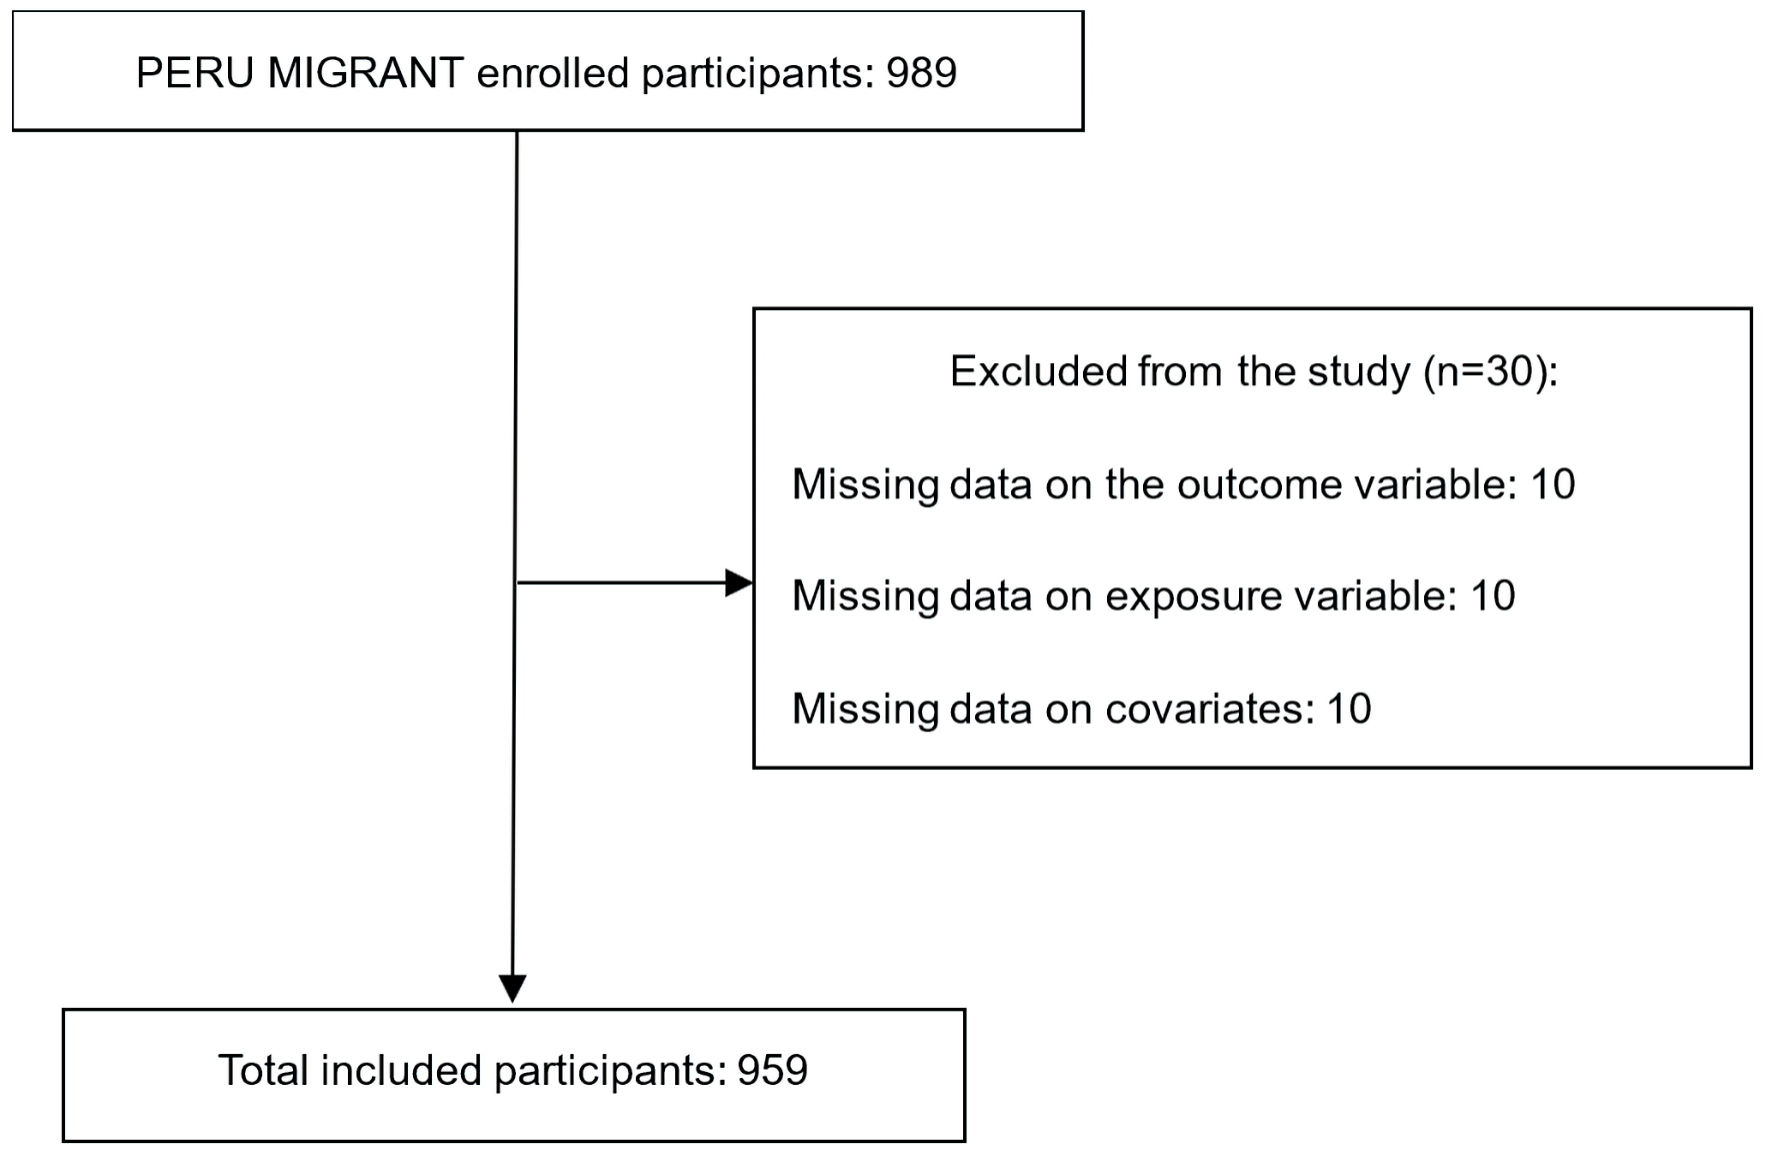
Figure 1. Flow diagram of participant selection.
| Journal of Clinical Medicine Research, ISSN 1918-3003 print, 1918-3011 online, Open Access |
| Article copyright, the authors; Journal compilation copyright, J Clin Med Res and Elmer Press Inc |
| Journal website https://www.jocmr.org |
Original Article
Volume 16, Number 2-3, March 2024, pages 81-93
The Association Between Lean-to-Fat Mass Ratio and Cardiometabolic Abnormalities: An Analytical Cross-Sectional Study
Figures
Tables
| Characteristics | Total (n = 959) | Cardiometabolic abnormalities | Pa | |
|---|---|---|---|---|
| No (n = 470), n (%) | Yes (n = 489), n (%) | |||
| aAnalysis was performed with the Chi-square test for independence. bAnalysis was performed with Fisher’s exact test. cMedian (interquartile ranges). dAnalysis was performed with the Mann-Whitney test. *The significative P value (P < 0.05). BMI: body mass index. | ||||
| Sex | < 0.001* | |||
| Female | 510 (53.18) | 217 (42.55) | 293 (57.45) | |
| Male | 449 (46.82) | 253 (56.55) | 196 (43.65) | |
| Age | < 0.001* | |||
| 30 to 44 years | 421 (43.9) | 259 (61.52) | 162 (38.48) | |
| 45 to 59 years | 395 (41.19) | 161 (40.76) | 234 (59.24) | |
| 60 or older | 143 (14.91) | 50 (34.97) | 93 (65.03) | |
| Migration status | < 0.001* | |||
| Rural | 189 (19.71) | 118 (62.43) | 71 (37.57) | |
| Migrant | 574 (59.85) | 274 (47.74) | 300 (52.26) | |
| Urban | 196 (20.44) | 78 (39.80) | 118 (60.20) | |
| Current smoker | 0.300 | |||
| No | 851 (88.74) | 412 (48.41) | 439 (51.59) | |
| Yes | 108 (11.26) | 58 (53.70) | 50 (56.30) | |
| Alcohol intake | 0.034* | |||
| Low | 874 (91.14) | 419 (47.94) | 455 (52.06) | |
| High | 85 (8.86) | 51 (60.00) | 34 (40.00) | |
| Physical activity level | 0.001* | |||
| Low | 249 (25.96) | 106 (42.57) | 143 (57.43) | |
| Moderate | 282 (29.41) | 126 (44.68) | 156 (55.32) | |
| High | 428 (44.63) | 238 (55.61) | 190 (44.39) | |
| Educational level | 0.020* | |||
| None/incomplete primary | 312 (32.53) | 133 (42.63) | 179 (57.57) | |
| Complete primary | 148 (15.43) | 80 (54.05) | 68 (45.95) | |
| Secondary | 499 (52.03) | 257 (51.50) | 242 (48.50) | |
| Socioeconomic status | 0.099 | |||
| Low | 329 (34.91) | 176 (53.5) | 153 (46.5) | |
| Medium | 324 (33.79) | 156 (48.15) | 168 (51.85) | |
| High | 306 (31.91) | 138 (45.10) | 168 (54.90) | |
| Hypertensive medication | 0.003* | |||
| No | 923 (96.25) | 461 (49.95) | 462 (50.05) | |
| Yes | 36 (3.75) | 9 (25.00) | 27 (75.00) | |
| Blood glucose medication | 0.002b | |||
| No | 950 (99.06) | 470 (49.47) | 480 (50.53) | |
| Yes | 9 (0.94) | 0 (0.00) | 9 (100.00) | |
| BMI categories | < 0.001* | |||
| Normal | 393 (40.98) | 253 (64.38) | 140 (35.62) | |
| Overweight | 373 (38.89) | 185 (49.60) | 188 (50.40) | |
| Obesity | 193 (30.12) | 32 (16.58) | 161 (83.42) | |
| Lean-to-fat mass ratio (tertiles) | < 0.001* | |||
| Lowest | 322 (33.58) | 84 (26.09) | 238 (73.91) | |
| Middle | 325 (33.89) | 164 (50.46) | 161 (49.54) | |
| Highest | 312 (33.53) | 222 (71.15) | 90 (28.85) | |
| Lean mass index (kg/m2)c | 17.00 (15.33 - 18.45) | 16.83 (15.11 - 18.24) | 17.1 (15.63 - 18.79) | 0.002d |
| Fat mass index (kg/m2)c | 8.55 (6.32 - 1.30) | 7.40 (5.38 - 9.64) | 9.82 (7.37 - 13.01) | < 0.001d |
| Lean-to-fat mass ratioc | 1.86 (1.40 - 2.84) | 2.26 (1.56 - 3.33) | 1.59 (1.27 - 2.45) | < 0.001d |
| Lean-to-fat mass ratio | Female (n = 510) | Male (n = 449) | |||||
|---|---|---|---|---|---|---|---|
| 30 - 44 years (n = 224) | 45 - 59 years (n = 211) | 60 or older (n = 75) | 30 - 44 years (n = 197) | 45 - 59 years (n = 184) | 60 or older (n = 68) | ||
| PR (95% CI) | PR (95% CI) | PR (95% CI) | PR (95% CI) | PR (95% CI) | PR (95% CI) | ||
| aAdjusted by migration status, smoking, alcohol intake, physical activity level, educational level, and socioeconomic status. bAdjusted by the same covariables in model 1 plus overweight/obesity presence and abdominal obesity presence (men ≥ 90 cm, women ≥ 80 cm). cAdjusted by the same covariables in model 2 plus hypertension and blood glucose medication. *The significative P value (P < 0.05). PR: prevalence ratio; CI: confidence interval. | |||||||
| Crude model | Lowest | Reference | Reference | ||||
| Middle | 0.58 (0.43 - 0.77)* | 0.75 (0.61 - 0.92)* | 0.62 (0.44 - 0.87)* | 0.52 (0.36 - 0.76)* | 0.77 (0.55 - 1.07) | 1.02 (0.71 - 1.45) | |
| Highest | 0.24 (0.15 - 0.38)* | 0.64 (0.49 - 0.82)* | 0.60 (0.39 - 0.89)* | 0.22 (0.13 - 0.38)* | 0.44 (0.25 - 0.76)* | 0.59 (0.33 - 1.07) | |
| Adjusted model 1a | Lowest | Reference | Reference | ||||
| Middle | 0.57 (0.42 - 0.78)* | 0.74 (0.60 - 0.92)* | 0.61 (0.41 - 0.88)* | 0.50 (0.33 - 0.74)* | 0.77 (0.54 - 1.08) | 1.02 (0.73 - 1.42) | |
| Highest | 0.22 (0.14 - 0.35)* | 0.68 (0.50 - 0.92)* | 0.55 (0.35 - 0.84)* | 0.21 (0.11 - 0.37)* | 0.44 (0.25 - 0.78)* | 0.69 (0.35 - 1.33) | |
| Adjusted model 2b | Lowest | Reference | Reference | ||||
| Middle | 0.58 (0.43 - 0.79)* | 0.73 (0.57 - 0.92)* | 0.49 (0.28 - 0.88)* | 0.59 (0.32 - 1.12) | 0.62 (0.33 - 1.19) | 1.33 (0.69 - 2.54) | |
| Highest | 0.13 (0.02 - 0.86)* | 0.60 (0.35 - 1.03) | 0.38 (0.17 - 0.84)* | 0.25 (0.09 - 0.69)* | 0.34 (0.14 - 0.82)* | 0.92 (0.31 - 2.66) | |
| Adjusted model 3c | Lowest | Reference | Reference | ||||
| Middle | 0.58 (0.42 - 0.80)* | 0.73 (0.57 - 0.92)* | 0.45 (0.25 - 0.82)* | 0.60 (0.31 - 1.17) | 0.62 (0.32 - 1.18) | 1.41 (0.74 - 2.70) | |
| Highest | 0.13 (0.02 - 0.87)* | 0.60 (0.36 - 1.00) | 0.36 (0.17 - 0.80)* | 0.26 (0.09 - 0.72)* | 0.33 (0.14 - 0.81)* | 0.99 (0.33 - 3.00) | |
| Lean mass index | Cardiometabolic abnormalities | ||||||
|---|---|---|---|---|---|---|---|
| Female (n = 510) | Male (n = 449) | ||||||
| 30 - 44 years (n = 224) | 45 - 59 years (n = 211) | 60 or older (n = 75) | 30 - 44 years (n = 197) | 45 - 59 years (n = 184) | 60 or older (n = 68) | ||
| PR (95% CI) | PR (95% CI) | PR (95% CI) | PR (95% CI) | PR (95% CI) | PR (95% CI) | ||
| aAdjusted by migration status, smoking, alcohol intake, physical activity level, educational level, and socioeconomic status. bAdjusted by the same covariables in model 1 plus hypertension and blood glucose medication. *The significative P value (P < 0.05). PR: prevalence ratio; CI: confidence interval. | |||||||
| Crude Model | Lowest | Reference | Reference | ||||
| Middle | 1.72 (0.94 - 3.16) | 1.17 (0.88 - 1.55) | 1.19 (0.82 - 1.74) | 1.25 (0.67 - 2.33) | 1.53 (0.98 - 2.37) | 1.52 (0.92 - 2.49) | |
| Highest | 3.68 (2.12 - 6.41)* | 1.53 (1.21 - 1.93)* | 1.4 (0.99 - 1.96) | 2.35 (1.36 - 4.06)* | 1.65 (1.07 - 2.5)* | 1.97 (1.29 - 3.00)* | |
| Adjusted Model 1a | Lowest | Reference | Reference | ||||
| Middle | 1.88 (1.04 - 3.40)* | 1.10 (0.81 - 1.50) | 1.18 (0.79 - 1.76) | 1.22 (0.65 - 2.30) | 1.48 (0.95 - 2.31) | 1.45 (0.88 - 2.38) | |
| Highest | 4.03 (2.36 - 6.90)* | 1.43 (1.08 - 1.88)* | 1.51 (1.05 - 2.15)* | 2.22 (1.27 - 3.86)* | 1.48 (0.95 - 2.29) | 1.81 (1.14 - 2.86)* | |
| Adjusted Model 2b | Lowest | Reference | Reference | ||||
| Middle | 1.84 (1.01 - 3.35)* | 1.08 (0.80 - 1.47) | 1.18 (0.79 - 1.75) | 1.19 (0.63 - 2.25) | 1.48 (0.95 - 2.31) | 1.51 (0.89 - 2.53) | |
| Highest | 4.05 (2.36 - 6.94)* | 1.43 (1.09 - 1.87)* | 1.56 (1.10 - 2.24)* | 2.17 (1.24 - 3.80)* | 1.46 (0.93 - 2.28) | 1.80 (1.15 - 2.83)* | |
| Fat mass index | Cardiometabolic abnormalities | ||||||
|---|---|---|---|---|---|---|---|
| Female (n = 510) | Male (n = 449) | ||||||
| 30 - 44 years (n = 224) | 45 - 59 years (n = 211) | 60 or older (n = 75) | 30 - 44 years (n = 197) | 45 - 59 years (n = 184) | 60 or older (n = 68) | ||
| PR (95% CI) | PR (95% CI) | PR (95% CI) | PR (95% CI) | PR (95% CI) | PR (95% CI) | ||
| aAdjusted by migration status, smoking, alcohol intake, physical activity level, educational level, and socioeconomic status. bAdjusted by the same covariables in model 1 plus hypertension and blood glucose medication. *The significative P value (P < 0.05). PR: prevalence ratio; CI: confidence interval. | |||||||
| Crude model | Lowest | Reference | Reference | ||||
| Middle | 2.19 (1.30 - 3.70)* | 1.14 (0.85 - 1.52) | 0.82 (0.49 - 1.35) | 2.16 (1.15 - 4.05)* | 1.27 (0.76 - 2.13) | 1.68 (1.00 - 2.82) | |
| Highest | 3.71 (2.29 - 6.03)* | 1.55 (1.21 - 1.97)* | 1.47 (1.07 - 2.02)* | 4.47 (2.57 - 7.78)* | 1.83 (1.15 - 2.90)* | 1.56 (0.92 - 2.64) | |
| Adjusted model 1a | Lowest | Reference | Reference | ||||
| Middle | 2.33 (1.40 - 3.89)* | 1.06 (0.76 - 1.47) | 0.79 (0.48 - 1.29) | 2.17 (1.09 - 4.30)* | 1.20 (0.70 - 2.08) | 1.49 (0.88 - 2.54) | |
| Highest | 3.92 (2.42 - 6.35)* | 1.43 (1.08 - 1.91)* | 1.50 (1.04 - 2.18)* | 4.85 (2.53 - 9.28)* | 1.64 (1.00 - 2.69) | 1.39 (0.80 - 2.41) | |
| Adjusted model 2b | Lowest | Reference | Reference | ||||
| Middle | 2.30 (1.38 - 3.85)* | 1.05 (0.77 - 1.45) | 0.76 (0.46 - 1.25) | 2.15 (1.09 - 4.26)* | 1.18 (0.68 - 2.06) | 1.54 (0.91 - 2.64) | |
| Highest | 3.94 (2.43 - 6.40)* | 1.44 (1.09 - 1.91)* | 1.56 (1.07 - 2.28)* | 4.76 (2.48 - 9.14)* | 1.64 (0.98 - 2.72) | 1.40 (0.82 - 2.42) | |