

| Journal of Clinical Medicine Research, ISSN 1918-3003 print, 1918-3011 online, Open Access |
| Article copyright, the authors; Journal compilation copyright, J Clin Med Res and Elmer Press Inc |
| Journal website http://www.jocmr.org |
Original Article
Volume 10, Number 2, February 2018, pages 88-105
A Multiple Treatment Comparison of Eleven Disease-Modifying Drugs Used for Multiple Sclerosis
Vida Hamidia, Elisabeth Coutoa, Tove Ringerikea, Marianne Klempa, b, c
aNorwegian Institute of Public Health, Norway
bDepartment of Pharmacology, University of Oslo, Norway
cCorresponding Author: Marianne Klemp, Division of Diagnostics and Intervention, Department of Pharmacology, University of Oslo, PO Box 1057, Blindern, 0316 Oslo, Norway
Manuscript submitted August 18, 2017, accepted September 5, 2017
Short title: Comparison of Multiple Sclerosis Drugs
doi: https://doi.org/10.14740/jocmr3168w
| Abstract | ▴Top |
Background: Several disease-modifying drug therapies are available for the treatment of multiple sclerosis (MS). To ensure the most appropriate MS management, we assessed the effectiveness and cost-effectiveness of the disease-modifying medicines used for MS.
Methods: We conducted a systematic review including 11 disease-modifying drugs used for treatment of adult patients diagnosed with relapsing-remitting MS. We performed a network meta-analysis using both direct and indirect evidence. We examined the endpoints, annual relapse, disability progression, mortality, serious adverse events and withdrawal from the study due to adverse events. Cost-effectiveness was assessed by developing a decision model. The model calculated costs and quality-adjusted life years (QALYs) with different treatment strategies. Uncertainties in the parameter values were explored with a probabilistic sensitivity analysis and several scenario analyses.
Results: Alemtuzumab 12 mg was the most effective against annual relapse (high quality evidence). For disability progression, dimethyl fumarate 240 mg and fingolimod 0.5 mg and 1.25 mg were more effective treatment alternatives (high quality evidence). For withdrawal due to adverse events, the conclusion is unclear due to the low quality of the available evidence. Peg-interferon beta-1a was associated with more adverse events (than the other treatments). None of the examined treatments had an effect on overall mortality compared to placebo. The economic analysis indicated that alemtuzumab was more effective in terms of QALYs and less costly than the other treatment alternatives. Discarding alemtuzumab, three treatment alternatives (interferon beta-1b (Extavia), peg-interferon beta-1a and natalizumab) could be considered cost-effective depending on the willingness-to-pay (WTP) threshold. Assuming a WTP below EUR 111,690 per QALY, interferon beta-1b (Extavia) was approximately 36% likely to be the most cost-effective treatment, followed by peg-interferon beta-1a (approximately 34% likely).
Conclusions: Our results showed that alemtuzumab can be considered as more effective and less costly than the other treatment alternatives. There is a substantial potential cost saving if more patients start on the more effective and less costly treatment alternatives.
Keywords: Multiple sclerosis; Relapsing-remitting; Pharmaceutical; Economics; Multiple treatment comparison
| Introduction | ▴Top |
Multiple sclerosis (MS) is a chronic inflammatory disorder of the central nervous system (CNS) with secondary neurodegeneration [1]. MS is one of the most common causes of disability in young adults [2]. The disease usually starts around the age of 30 (range 20 - 40), and prevalence rates peak at the age of 50 [3]. The median time to death is around 30 years from disease onset, representing a reduction in life expectancy of 5 - 10 years [1].
Incidence surveys show an increase in MS incidence in later years [3], from 1.9 (95% CI: 1.2 - 2.6) for the period from 1953 to 1957, to 8.5 (95% CI: 7.3 - 9.7) for the period from 1978 to 2007 [4]. In Europe, the incidence and prevalence of MS are higher in women than in men [5].
Clinical manifestations depend on the affected area of the CNS. Symptoms reflect an involvement of motor-, sensory-, visual- and autonomic systems [1]. Symptoms evolve over time. MS appears in several degrees of severity from a mild form (with few attacks) to a more progressive disease that is potentially highly disabling and that has large impact on the quality of life of patients and their families [1].
Relapsing-remitting MS (RRMS) is the most common type of MS. About 85-90% of MS patients will initially be diagnosed with RRMS [6]. RRMS is characterized by acute symptomatic attack episodes of worsening of function followed by partial or complete recovery [7]. Approximately half of the patients with RRMS will develop secondary progressive MS (SPMS) [8]. SPMS is associated with disease progression without clinical attacks and of highly variable degrees [9].
Disease progression is usually monitored by relapse rate and disease progression. The gradual increasing level of disability is often measured with the expanded disability status scale (EDSS), an ordinal scale ranging from 0 (normal clinical status) to 10 (death due to MS) in steps of 0.5 points [10].
Disease-modifying medicines are the standard treatment for patients with MS. It is possible to treat the underlying disease, relapses and MS-related symptoms. Disease-modifying drugs may inhibit the inflammatory process to prevent progression and reduce disabilities due to the disease. The different treatment options have different mechanisms of action, routes of administration, approved indications and other differences influencing their use. The various medications are presented in Table 1.
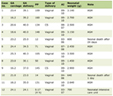 Click to view | Table 1. Overview of Included Interventions |
The use of MS medicines has been described as “uneven” with “questionable effects on the long-term accumulation of disability and disease progression” [1]. Disease-modifying treatments are expensive. Currently, a number of new disease-modifying therapies are available for the treatment of MS, but it is uncertain whether the new medicines are cost-effective in the Norwegian setting. To ensure proper MS management, it is important to assess the effectiveness and cost-effectiveness of all disease-modifying medicines used for MS.
| Materials and Methods | ▴Top |
Literature search and selection of studies
We searched for published health technology assessment (HTA) reports and systematic reviews (SRs). We included only reports and reviews of high quality that met our inclusion criteria. We supplemented the evidence with data from recently published randomized controlled trials (RCTs).
We were interested in the following interventions: dimethyl fumarate, teriflunomide, interferon beta, peg-interferon, glatiramer acetate, natalizumab, fingolimod, and alemtuzumab compared to placebo or any drug treatment. The drugs could be used as monotherapy or in combination with each other.
The outcomes of interest were: clinical relapse, disability progression measured using the EDSS, mortality, withdrawal from study due to adverse events, hospitalization, and serious adverse events (SAEs) in patients aged 18 or older diagnosed with RRMS.
A systematic literature search was performed in February 2015, and updated in November 2015. We searched the following databases: Ovid MEDLINE(R) In-Process & Other Non-Indexed Citations and Ovid MEDLINE(R) version 1946 to Present; Embase version 1974 to present; Cochrane Central Register of Controlled Trials (Central); ISI web of Science; PubMed (epub ahead of print) and Epistemonikos. We searched also the following websites: Canadian Agency for Drugs and Technologies in Health (CADTH), Agency for Healthcare Research and Quality (AHRQ), FinOHTA - Finnish Office for Health Technology Assessment, Statens beredning for medicinsk utvardering (SBU), EUnetHTA POP database (POP = Planned and Ongoing Projects), and PROSPERO - Centre for Reviews and Dissemination. The complete search strategies are presented in Supplementary material 1 (www.jocmr.org). We contacted the pharmaceutical companies having marketing authorization for the included drugs in Norway to obtain additional studies. We checked bibliographies of selected articles for additional publications meeting our inclusion criteria. Finally, we looked for ongoing trials in ClinicalTrials.gov and WHO International Clinical Trials Registry Platform (ICTRP) to identify relevant ongoing or unpublished trials.
To identify relevant HTA reports and SRs, two reviewers read titles and abstracts retrieved by the literature search, and excluded obviously irrelevant literature. We included the most recently published HTA report that met all our inclusion criteria.
To identify possible RCTs published after the identified HTA report, two reviewers independently inspected all titles and abstracts retrieved by the literature. We included the relevant articles that met our list of inclusion criteria. Disagreements were resolved by discussion or by consulting a third reviewer. The same process was used to select publications sent by companies having marketing authorization for MS medicines in Norway.
One reviewer extracted data from the included articles and another reviewer checked these for accuracy.
Statistical analyses and presentation of results
We conducted an SR and network meta-analyses (NMAs) of existing literature, following the methods recommended in the PRISMA statement for reporting SRs and meta-analyses of studies that evaluate healthcare interventions [11]. The protocol for the SR can be seen in Supplementary material 2 (www.jocmr.org).
We expressed the comparative effectiveness of the treatments as the relative risk (RR) for dichotomous outcomes, annualized rate ratios (ARRs) for count data and the mean difference (MD) for continuous outcomes. For all outcomes, 95% confidence intervals (CIs) or credible intervals (CrIs) were calculated for the RR, ARR, and MD. The CrI is the Bayesian analogue to CIs used in traditional frequentist statistical approaches. We considered a difference to be “significant” if the CrI did not include RR = 1 or MD = 0.
For count data (number of relapses), we used a Poisson regression based approach to obtain ARR from the total number of relapses and patient-years of follow-up.
We performed an NMA for each clinical endpoint individually. We combined direct and indirect effects of the interventions of interest for each endpoint. The analysis was based on multiple treatments meta-analysis (MTM) as described by Salanti et al [12]. We used the arm-based NMA method (a Bayesian method based on Markov Chain Monte Carlo simulation). All NMAs were performed using Winbugs version 1.4.3 (Imperial College and MRC, UK).
We used a random effects model. Incoherence between direct and indirect evidence was checked by “node-splitting” [11]. In addition, the direct and indirect estimates of effect and the corresponding Bayesian “P-values” for incoherence were presented. A ranking of the included treatments for each primary endpoint is presented using the surface under the cumulative ranking curve (SUCRA) [12]. We interpreted the rankings cautiously taking the quality of evidence into account.
For the endpoint “number of relapses”, we performed imputations to derive needed values where included trials did not report the total number of relapses or exposure time (person-years). Missing number of total relapses was derived using the exposure time (person-years) and the reported mean ARR values. For missing exposure-time (in person-years), the values were imputed using treatment duration and number of patients completing the study (100% was assumed in cases where the percentage of completers was not reported).
For disability progression, measured as a dichotomous outcome, we assumed that participants who dropped out experienced the event (a likely scenario). For all other endpoints, we did not perform imputations for missing data. We based the statistical analyses on the intention to treat principle (all participants analyzed in the group to which they were allocated, and all available data included in the analyses).
The quality of the evidence
We assessed the quality of the SR part of the identified HTA using the checklist for SR in the handbook of The Norwegian Knowledge Centre for the Health Services (21).
The quality of the resent published RCTs which were not included in the HTA was assessed using the Cochrane Collaboration’s tool for Risk of Bias assessment [13]. We assessed the overall quality of evidence for each endpoint, for direct evidence, indirect evidence, and the combined evidence from the NMAs, using GRADE (Grading of Recommendations Assessment, Development, and Evaluation) [14, 15]. To grade the indirect evidence, we considered the direct evidence that contributed to that indirect evidence. To select the direct evidence that might have contributed to the indirect evidence, we chose the evidence that involved fewest head-to-head comparisons. For a specified comparison, the grade of the NMA evidence was the highest GRADE between the direct and indirect evidence for that comparison. The categories for confidence in the effect estimates are: high, moderate, low and very low. The quality of the direct evidence, indirect evidence, and the combined evidence from the NMAs was evaluated using the GRADE approach for NMAs [14].
Cost-effectiveness analysis
In the economic evaluation, we assumed that a typical RRMS patient is on average 30 years at diagnosis [3], and 68% are female (based on the included studies in our SR and clinical expert opinion).
The analysis was carried out from a healthcare perspective. Both costs and effects were discounted at a rate of 4% per annum. The results of the economic evaluations were expressed as mean incremental cost-effectiveness ratio (ICER).
Model structure
In order to assess the cost-effectiveness of different disease-modifying medicines for patients with RRMS, a probabilistic decision-analytic model was developed in TreeAge pro® 2015. The model is of the Markov type where a cohort of patients is followed over a given period of time. This was considered appropriate as MS is a chronic condition requiring continuous treatment [16, 17].
The model simulates the natural history of MS using the state transition methodology (Supplementary material 3, www.jocmr.org). Health states were defined according to the Kurtzke EDSS [18]. Disability status was modeled from 0 to 10 for RRMS and from 2 to 10 for SPMS [18].
During one cycle, all patients could 1) remain in the current health state, 2) progress to the next more severe state, 3) transit to a secondary-progressive health state, or 4) die (Supplementary material 3, www.jocmr.org). Patients with an EDSS scale of 5 or lower could also improve to a less severe disease state, or stop treatment. Improvement in lower health states was modeled by assuming that a maximum of two EDSS-point improvements could be achieved [19]. Patients would discontinue treatment once they progressed to an EDSS of 6 or SPMS (based on clinical experts’ opinion).
In the base-case analysis, we assumed no treatment effect once patients progressed to an EDSS of 6. It is also documented that with advancing disease (EDSS > 6), less relapses occur [19]. We, therefore, assumed that relapses would occur only in patients with EDSS of 5 or lower.
We assessed the costs and utilities associated with different treatment options over 20 years for the base-case analysis. The time period was based on experts’ opinion describing that most of the patients will not continue with disease-modifying medicines beyond 20 years. Alternative horizons of 10 years and 30 years were considered in scenario analyses. We used a cycle length of 1 year, meaning that any transitions between different states could happen only once a year. Patients could only be in one of the pre-defined states at any time. Upon completion of each cycle, patients could, depending on transition probabilities, transfer to another state or remain in the same state until death or the end of the simulation. Each state and event is associated with specific health outcomes and costs. Death is modeled as an absorbing state, implying that once an individual dies, no further incurred costs or health outcomes are included in the analysis.
Disease-modifying therapies are usually initiated in patients with an EDSS score lower than 5, and mostly for patients with an EDSS score between 1 and 3 (clinical expert opinion and [20]). EDSS distributions used in our analysis are presented in Supplementary material 4 (www.jocmr.org).
Based on reporting of withdrawals in studies included in our SR, we set annual treatment discontinuation rate at 15% for the first 2 years in the base-case analysis. A previous study showed that the proportion of patients who discontinued treatment and the degree of treatment adherence were similar across different treatment options [21]. We, therefore, assumed the same discontinuation rate across all treatment options. We assumed no discontinuation after 2 years (based on expert opinion). Any patient who discontinued therapy subsequently progressed according to natural history rates with no additional cost of therapy.
Based on the result of our SR, none of the examined treatments had a survival benefit. The annual risk of dying of other causes is, therefore, assumed to be the same as the general population. We collected age- and gender-specific Norwegian all-cause mortality [22]. A weighted average was calculated based on the assumption that 68% of RRMS patients were female.
Model parameters
Table 2 [23-29] shows the key parameters used in the base-case analysis. The sources and methods used to derive the model parameters are described below.
Click to view | Table 2. Key Parameters Used in the Base-Case Analysis |
Natural history transitional probabilities
We did not find Norwegian data compatible to the developed model, so the transitional probabilities are based on estimates reported in the published literature. However, the transferability of the data to the Norwegian context was critically discussed and modified based on expert advice.
Disability progression
Probabilities for disability progression within RRMS health states, transitioning from RRMS to SPMS, as well as disability progression within SPMS health states were derived from a large 25-year patient-level cohort study (untreated patients) undertaken in London, Ontario, Canada [23, 30]. The reported data were eligible for our model, and used by several previously published economic studies [24, 31].
Instantaneous hazard rates for disability progression without disease-modifying treatment are presented in Table 2. All rates were transformed into transition probabilities for use in the model [32]. All natural history probabilities were incorporated in the model as beta distributions.
Relapse rate
There were no available Norwegian data on annual relapse rates compatible to our model. We considered therefore the best available sources. Annual relapse rates have been estimated based on Ontario cohort data [23], and published evidence suggested that the frequency of relapse is affected by a patient’s age and disease duration (with the frequency of relapse decreasing over time) [33, 34]. Based on Ontario cohort data, the mean relapse rate after 2 years since disease onset was reported to be 0.835 and 1.423 for patients in EDSS 0 - 2 and 3+, respectively [23]. These estimates were adjusted such that the patients enter the model with an average time since disease onset of 5 years and onwards (based on the studies included in our SR) (Supplementary material 5, www.jocmr.org). These annual relapse rates were judged applicable to the Norwegian context by our clinical experts. We used a Gamma distribution for annual relapse rates based on the assumption that events with a known average rate occur in a fixed interval of time.
Based on published literature and expert opinion, we assumed that 23% of relapses were severe [25]. In addition, we assumed that the average length of mild or moderate relapses was 45 days. For severe relapses, it was assumed to be 90 days [24, 25].
Improvements in MS disability
Tremlett and colleagues [19] concluded that improvements in MS disability over 1 or 2 years were not unusual. The result of their study indicated that 8.3% of patients had an improvement of at least one point in the EDDS scale after 1 year, and 2.2% showed greater than or equal to two-point improvements. In our model, we considered a maximum of two EDSS-point improvements. Based on expert opinions, the rates of annual disability improvements were used in the model only for the EDSS states lower than 6.
Clinical efficacy parameters
Clinical efficacy data used in the model were derived from our SR of relapse rates and disability progression (Table 2). The RRs of sustained disability progression were multiplied to the transitional probabilities of patients moving to higher health states, as well as to progression to SPMS health states. Patients transitioned as natural history of disease transitional probabilities between SPMS health states and we assumed that treatments had no effect on the transition between SPMS states. Patients who discontinued treatment progressed according to transitional probabilities for natural disability progression, but retained any previously accrued benefits.
The expected numbers of relapses for each treatment alternative were estimated in the model by multiplying the treatment effect on the relapse rates for each treatment alternative (Table 2) to the average number of relapses experienced with “no treatment”.
Based on expert opinions, we considered a reduction in treatment effect over time. Full effect of treatments was assumed to be 100% for the first 4 years, 75% from year 5 to 10, and 50% beyond 10 years.
Treatment-related adverse events
Generally, disease-modifying therapies are well tolerated. Our SR showed no statistically significant differences between the therapies for SAEs. Moreover, most of the adverse events related to the RRMS treatments were transient, and some of them may potentially be related to the disease process (e.g. depression). Based on the assumption that the costs and disutility associated with adverse events would not have a significant impact on the results, we did not include adverse events, except for progressive multifocal leukoencephalopathy (PML), in the model. However, some of the differences for resource use related to the adverse events have been considered when estimating monitoring costs associated with each of the treatment strategies. For more information, see Supplementary material 6 (Table 6.2-6.4) (www.jocmr.org).
Natalizumab has been reported to be associated with the development of PML, which is a rare but serious infectious or inflammatory disease. PML is a viral infection (JC-virus) leading to inflammation and finally demyelination, often resulting in severe disability or death [35]. It has been shown that there is a risk of developing PML of 2.84 cases per 1,000 patients who received natalizumab for MS [36]. It was also reported that 22% of the reported natalizumab-associated PML patients died [36].
Recently PML has also been reported in a small number of patients treated with other disease-modifying therapies, such as dimethyl fumarate and fingolimod. Due to insufficient data, we included PML only for natalizumab in the model.
Costs
An annual cost per patient associated with different treatment alternatives was calculated for each health state and event in the model. The costs included in the model are drug costs, monitoring costs associated with the use of drugs, costs related to MS patients care (excluding drugs) at different EDSS levels, and costs related to the treatments of relapses and PML (Table 2). All costs were measured in 2015 Norwegian kroner (NOK) and converted into Euros based on the average exchange rate for Norwegian kroner to Euros in 2015 (EUR 1.00 ≈ NOK 8.9530) reported by the Norwegian Central Bank).
Annual drug costs
Drug costs were calculated based on recommended doses and the maximum pharmacy retail prices that we received from the drug procurement cooperation (Table 1 and Supplementary material 6, www.jocmr.org).
Monitoring costs associated with the use of medicines
Monitoring costs associated with use of medicines were calculated based on the estimates we received from the drug procurement cooperation. The monitoring costs were estimated separately for the first and second year. Based on the information from clinical experts, we calculated the monitoring costs beyond the second year. The estimated monitoring costs are summarized in Table 2 and Supplementary material 6 (www.jocmr.org).
Costs associated with MS care (exclusive costs associated with interventions)
The costs associated with different health states (EDSS levels), and relapse (mild and severe) were obtained from a Norwegian survey study carried out in 2013, and including 546 MS patients [26]. The costs related to diagnosis, treatment, nursing care, assistive devices and equipment were included in the cost calculation of different health states. The difference between the monthly costs for patients who had experienced relapse and for those who had not, was estimated to be approximately EUR 1,631. The costs associated to different EDSS states and relapses are presented in Table 2.
Costs associated with the treatment of PML
We assumed that most of the patients who developed PML needed hospital treatment. The costs were estimated based on prices from the Norwegian DRG system (DRG code 421). Patients who survived PML also needed 3 - 6 months extra treatments at rehabilitation centers. We assumed EUR 335 cost per day for stay at rehabilitation center [37].
Health-related quality of life
In order to obtain utility weights, we performed a systematic search for published values. For consistency, and as the use of different utility instruments would yield different results, we focused on values based on EQ-5D, the most commonly used instrument [38].
In the base-case, we used the utility values reported by Orme and colleagues [27]. The study was a cross-sectional study of people comprising all courses of MS (RRMS, SPMS and PPMS) from the UK. Based on the systematic search for health related quality of life data, this is the only study that has presented the utility weights associated with each EDSS state, SPMS and relapse by using the EQ-5D method.
As Orme and colleagues [27] did not make a distinction between mild or moderate and severe relapse, we assumed that the reported disutility was for mild or moderate relapses. Therefore, the ratio between disutility associated with mild or moderate relapse and severe relapse estimated by Prosser and co-workers [25] was applied to estimate the disutility associated with severe relapse. As mentioned, it was assumed that the average length of mild or moderate relapse and severe relapse would be 45 and 90 days, respectively [24, 25].
We assigned a disutility of 0.4 (0.3 - 0.5) to the year a patient experienced PML [28]. We did not identify reliable data on the effect on patients’ utility of the different methods of administrating the medication. Therefore, the possible disutility associated with injections is not included in the model. The mean values and standard errors of the utility (quality-adjusted life year (QALY)) weights used in our model are presented in Table 2 and Supplementary material 7 (www.jocmr.org).
Sensitivity analysis
The model was created as a probabilistic model. This means that all uncertain parameters (treatment efficacy, costs, epidemiological data, etc.) were modeled as probability distributions rather than point estimates. To explore the consequences of uncertainties in the base-case parameter values, we performed a probabilistic sensitivity analysis in which all input parameters were randomly drawn from probability distributions and the model was run 10,000 times. For probabilities, the beta or gamma-distributions were constructed on plausible ranges for parameters. For costs, we modeled gamma-distributions where limits were within 30% of the base-case value. Efficacy and safety parameters were assumed to have a log-normal distribution where mean and CIs from our NMA were used to estimate the parameters. Beta or log-normal distributions were used for utility values in the model (Supplementary material 7, www.jocmr.org).
In addition, we performed an analysis of the expected value of perfect information (EVPI) on all uncertain parameters (costs, treatment efficacy, QALYs and probabilities) to explore the uncertainty surrounding specific groups of parameters and to show which group has the most impact on the results.
| Results | ▴Top |
Description of included studies
We included the most recent HTA report [24] that met our specified inclusion criteria from the initial search for SRs/HTAs (Fig. 1). We supplemented the evidence with data from recently published RCTs (from 2013 to the last date of our literature search November 2015) (Fig. 1). Details on selection processes, and included studies are provided in Supplementary material 8 (www.jocmr.org). The excluded publications including reasons for the exclusions are given in Supplementary material 9 (www.jocmr.org). In addition, possible relevant ongoing trails are listed in Supplementary material 10 (www.jocmr.org).
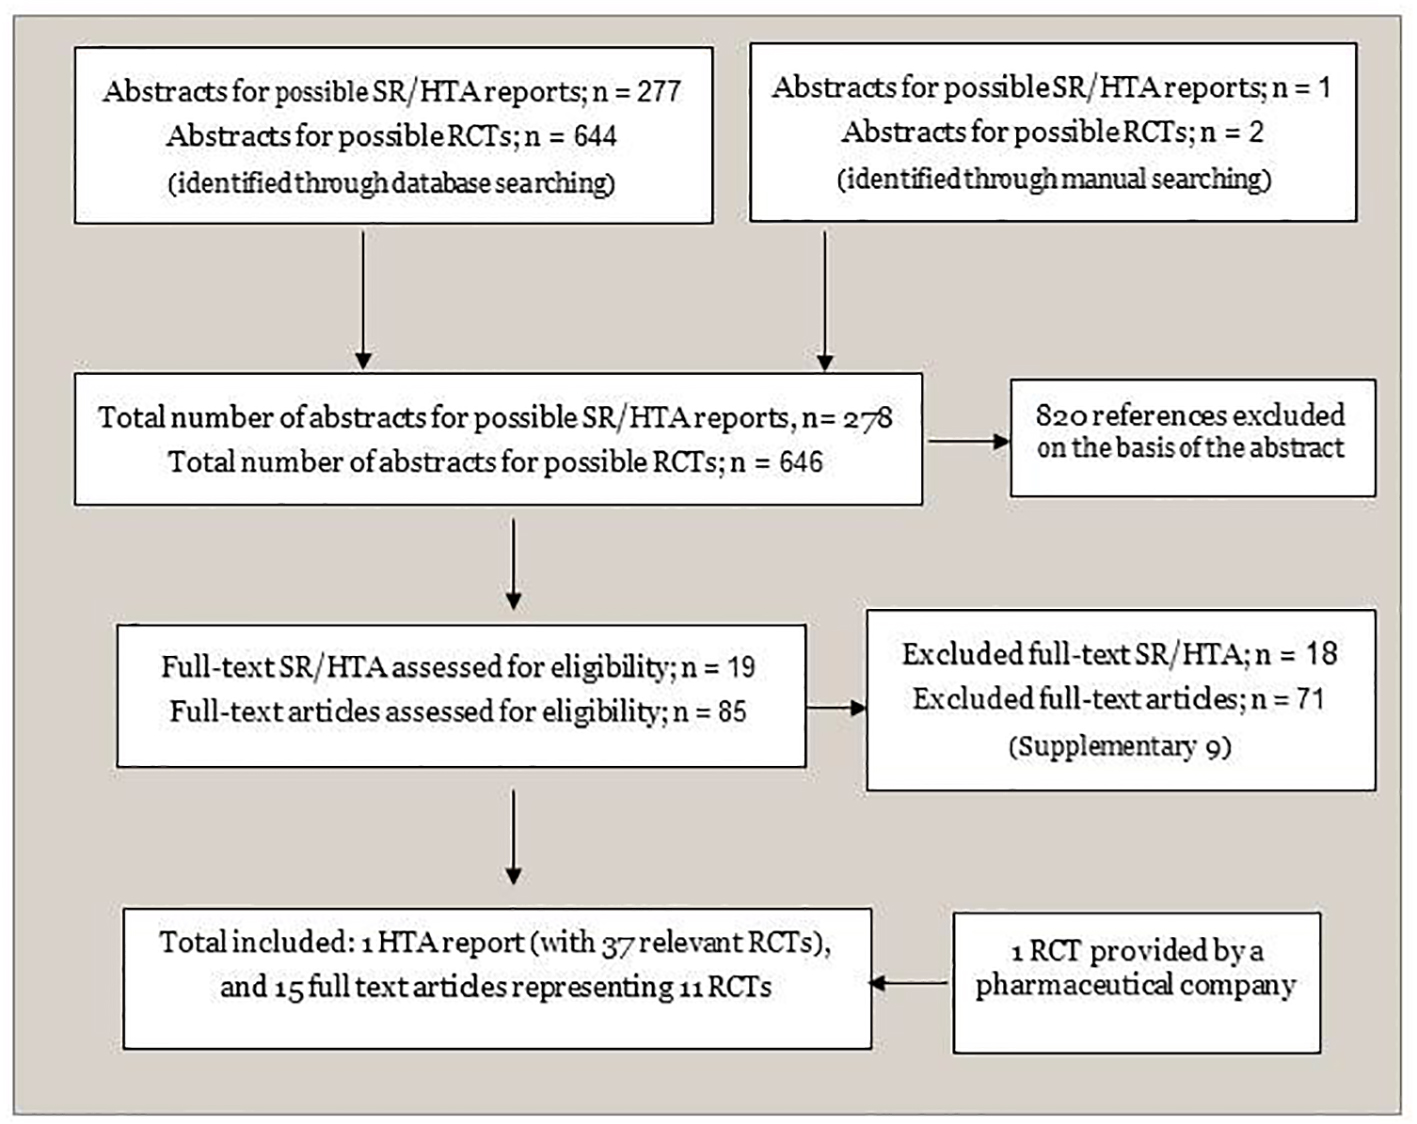 Click for large image | Figure 1. Flowchart of identification and selection of documentation. SR: systematic review; HTA: health technology assessment; RCT: randomized controlled trial. |
Altogether, we included 37 studies: 26 from the selected HTA reports [24], and 11 RCTs [13, 15, 39-47] from our supplementary search. All RCTs included RRMS patients. We had information for 39 comparisons including active treatments versus placebo, and compared with each other [13-15, 18, 39, 41-74]. Treatment histories varied, with 13 RCTs confined to treatment-naive patients, four included treatment experienced participants, 11 combined treatment-naive and treatment experienced patients, and treatment history was unclear in nine studies. Many of the published studies did not examine medications separating first- and second-line treatments. An overview of the included RCTs is presented in Supplementary material 11 (www.jocmr.org).
Clinical effectiveness
The relative effectiveness comparisons of the included drugs are based on the NMA. For annualized relapse rate, disability progression, withdrawals due to adverse events, change in expanded disability scale, SAEs and mortality, all interventions were included in the NMA. We used placebo as the common comparator in the network. Due to insufficient data, we could not perform an NMA for the endpoint hospitalization.
The evidence network for annualized relapse rate is shown in Figure 2. The results of the random effect NMA for the relative comparison between the interventions, as well as a grading of the evidence are presented in Table 3 and Supplementary material 12 (www.jocmr.org).
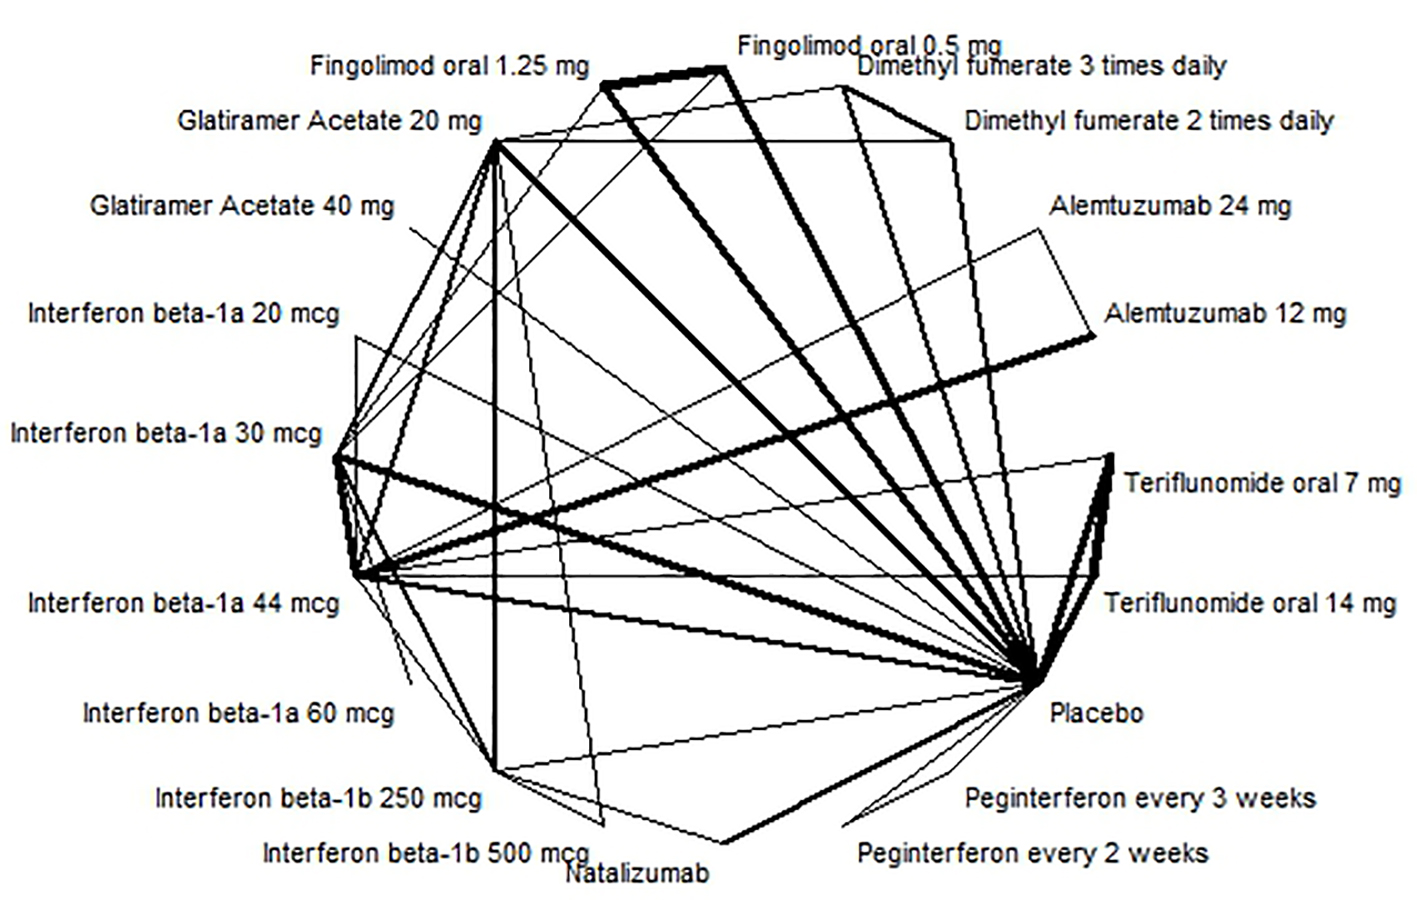 Click for large image | Figure 2. Evidence network for annualised relapse rate. |
Click to view | Table 3. Relative Risk for Annual Relapse and Disability Progression From Network Meta-Analysis |
Alemtuzumab 12 mg had the highest probability of preventing annual relapses (RR: 0.29; 95% CI: 0.23 - 0.35) and had a high quality of evidence.
Disability progression was examined as a dichotomous variable, considering whether someone was less disabled or not when using a certain treatment. The evidence network for disability progression is shown in Figure 3. The results of the NMA showed that alemtuzumab 24 mg (RR: 0.36; 95% CI: 0.16 - 0.74) and alemtuzumab 12 mg (RR: 0.40; 95% CI: 0.27 - 0.60) were the most effective treatment against disability progression; however, the quality of the evidence was assessed to be low or very low. For high quality evidence, dimethyl fumarate 240 mg and fingolimod 0.5 mg and 1.5 mg were more effective treatments (Table 3 and Supplementary material 13, www.jocmr.org).
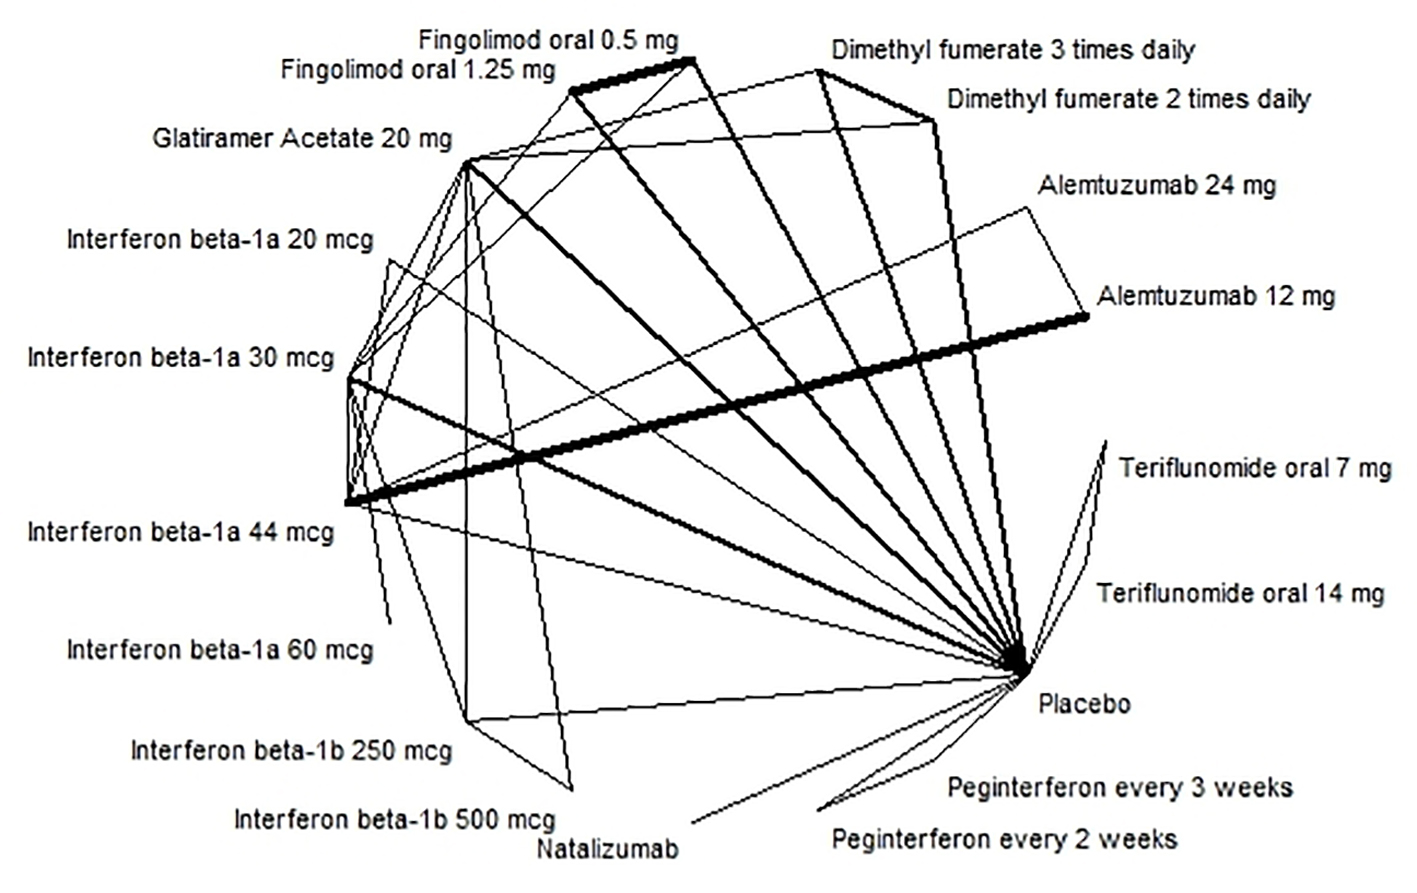 Click for large image | Figure 3. Evidence network for disability progression. |
For withdrawal due to adverse events, the conclusion is unclear due to the low quality of the available evidence. However, our results indicated that fingolimod 1.25 mg with moderate quality of evidence (RR: 2.21; 95% CI: 1.42 - 2.58) and interferon beta-1a 44 µg with low quality evidence (RR: 2.21; 95% CI: 1.29 - 3.97) were associated with more withdrawal due to adverse events than the other treatment alternatives (Supplementary material 14, www.jocmr.org).
The results of the NMA indicated that alemtuzumab 24 mg (mean difference: -0.91; 95% CI: -1.48 to -0.40), alemtuzumab 12 mg (mean difference: -0.6; 95% CI: -1.02 to -0.24) were more effective than the other treatment regarding change in EDSS (Supplementary material 15, www.jocmr.org).
Based on the NMA results, no treatments were found to increase statistically significantly SAEs. Alemtuzumab 12 mg was associated with fewer SAEs (RR: 0.67; 95% CI: 0.37 - 1.28), and peg-interferon beta-1 was associated with more adverse events (RR: 1.66; 95% CI: 1.21 - 2.28) than other treatment (Supplementary material 16, www.jocmr.org).
In addition, none of the examined treatments were associated with a statistically significantly higher risk for mortality than placebo (Supplementary material 17, www.jocmr.org).
The full NMA results comparing all available treatment strategies for all clinical outcomes are presented in Supplementary material 18 (www.jocmr.org).
More details about the estimates of the clinical outcomes with quality rating (GRADE) for direct and indirect evidences are shown in the Summary of Finding Tables in Supplementary material 19 (www.jocmr.org).
Cost-effectiveness
Table 4 illustrates the results of the base-case analysis. Over a 20-year time horizon, alemtuzumab dominated all other alternative treatments, i.e. it was both more effective in terms of QALYs gained and less costly.
Click to view | Table 4. Results of the Base-Case Cost-Effectiveness Analysis, Time-Horizon of 20 Years (All Interventions Included; Discounted)a |
In order to show the cost-effectiveness of the other treatment strategies relative to each other, we excluded alemtuzumab (the dominate strategy), and conducted a separate analysis of the remaining interventions.
Discarding alemtuzumab, natalizumab was the most effective treatment regarding QALYs (7.63), followed by peg-interferon beta-1a (7.56). Interferon beta-1a 22 µg was the least effective strategy (7.21). However, as presented in Table 4, the gain in QALYs of included interventions compared to each other (except alemtuzumab) was not substantial.
Fingolimod was the most expensive treatment (EUR 787,446), followed by natalizumab (EUR 780,168). Interferon beta-1b (Extavia) was the least expensive treatment (EUR 673,889), and was, therefore, used as a reference (Table 4).
When all treatment strategies except alemtuzumab are included in the analysis, three treatment strategies were not dominated (interferon beta-1b (Extavia), peg-interferon beta-1a and natalizumab) by the other interventions (Supplementary material 20, www.jocmr.org). It means that for different willingness-to-pay (WTP) thresholds, these three strategies could be considered the most cost-effective. Interferon beta-1b (Extavia) could be considered as a cost-effective treatment if WTP for QALY is less than EUR 185,240. For a WTP between EUR 185,240 and EUR 1,186,195, peg-interferon beta-1a is the cost-effective treatment. If the WTP is above EUR 1,186,195, natalizumab is the cost-effective treatment. All other treatments were dominated by at least one of these undominated treatments. Therefore, they were not considered to be cost-effective (Supplementary material 20, www.jocmr.org).
Sensitivity/scenario analyses
We performed a probabilistic sensitivity analysis to show the probability of the alternatives being cost-effective subject to different levels of WTP. When all treatment alternatives were included in the analysis, alemtuzumab was more likely to be the most cost-effective strategy (above 90%) for all values of WTP.
Discarding alemtuzumab, assuming a maximum WTP per QALY of EUR 55,850, interferon beta-1a (Extavia) was the most cost-effective treatment strategy (47%), followed by peg-interferon beta-1a (27%) and teriflunomide (13%). With a WPT per QALY of EUR 111,690, interferon beta-1b (Extavia) was the most cost-effective (36%) followed by peg-interferon beta-1a (34%) and teriflunomide (14%) (Fig. 4). However, total QALYs gained of included interventions overlapped (except for alemtuzumab), which indicates the uncertainty regarding the gain in QALYs (Fig. 5).
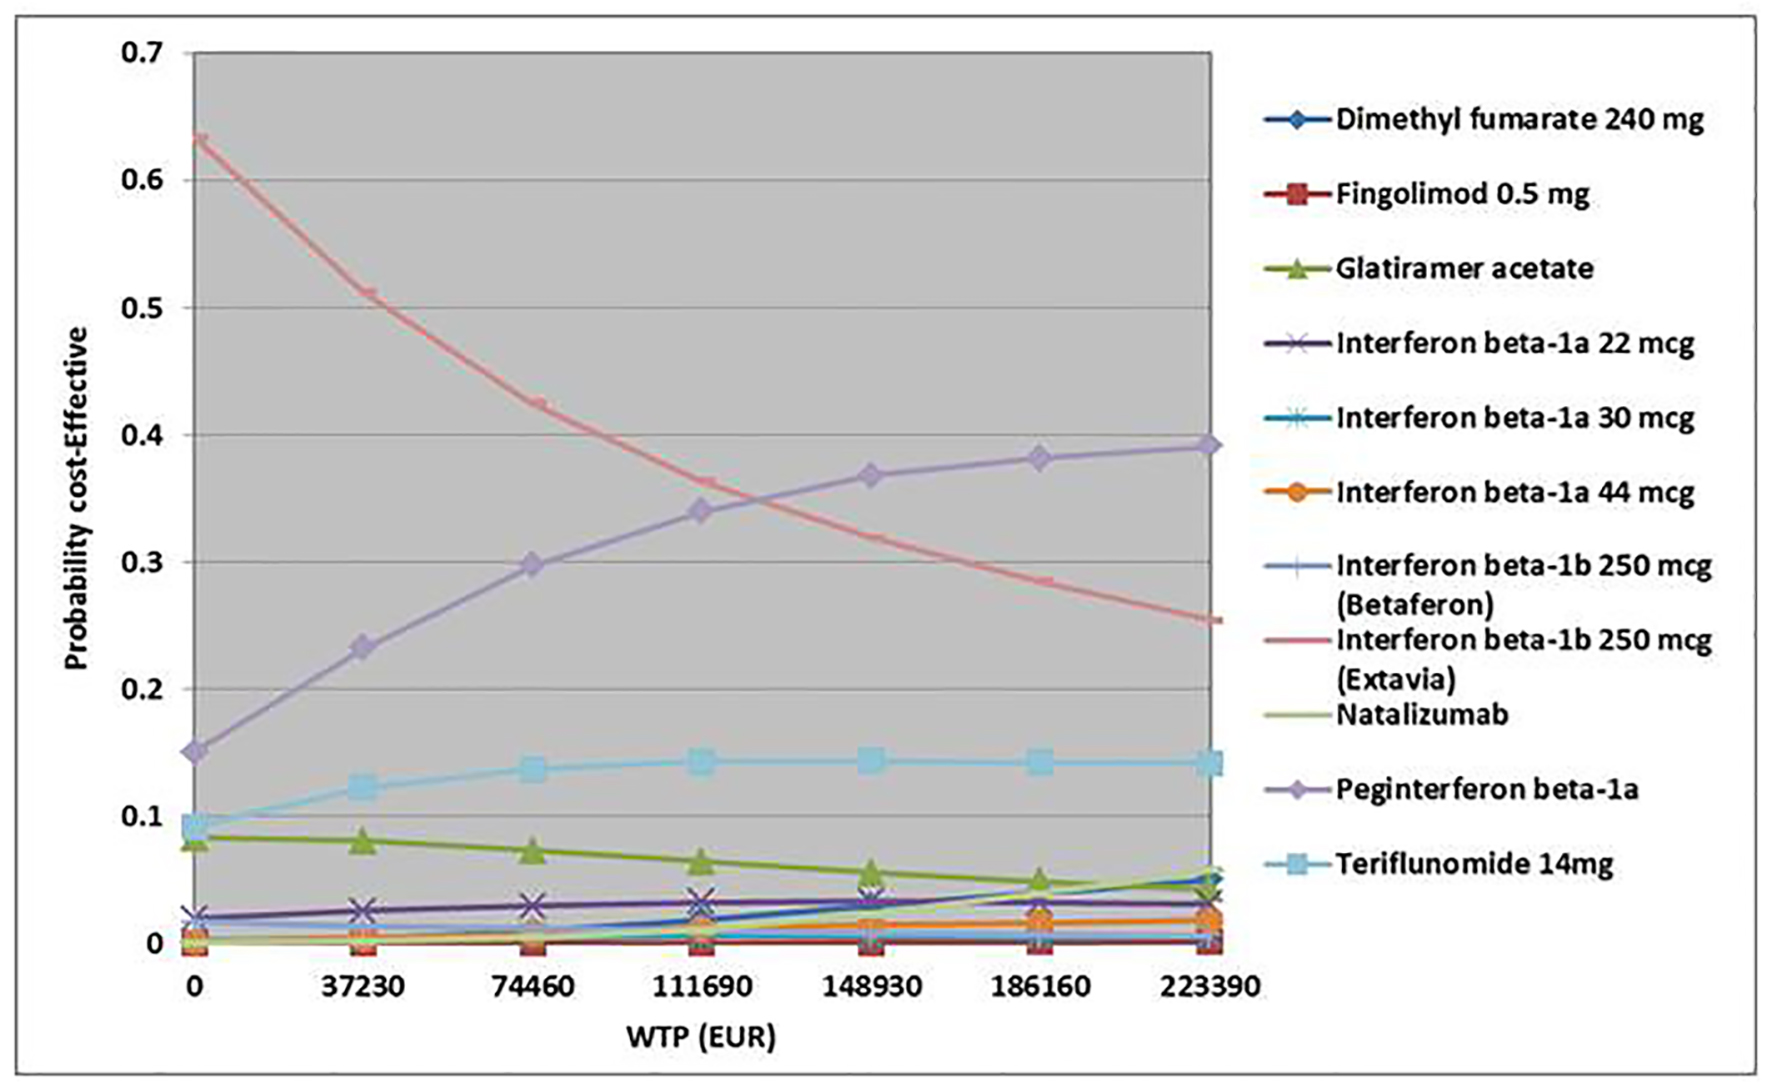 Click for large image | Figure 4. Cost-effectiveness acceptability curve (all interventions except alemtuzumab). WTP: willingness-to-pay. |
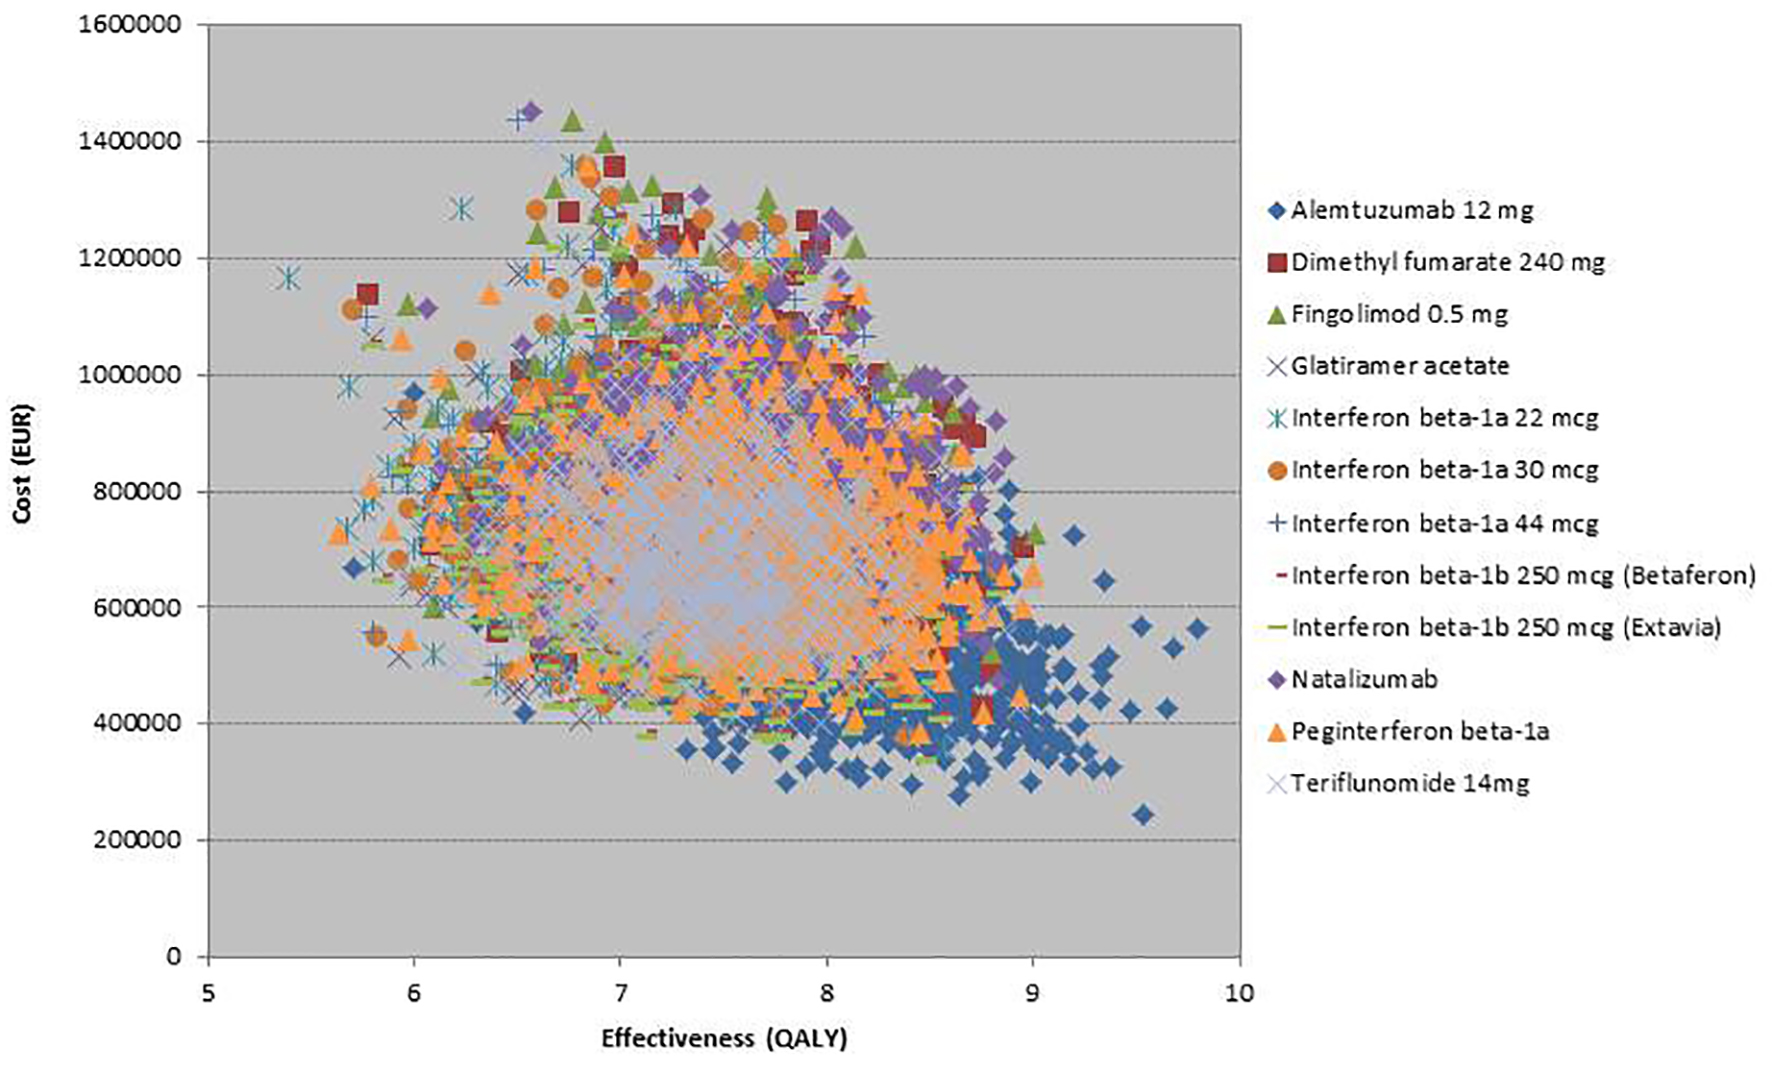 Click for large image | Figure 5. Scatter plot for 10,000 Monte-Carlo simulations (all interventions included). Simulations for alemtuzumab show that alemtuzumab was more effective and less costly relative to other treatments. |
The expected value of perfect information analysis indicated that at a WTP of EUR 44,700 per QALY, probabilities data (epidemiological data) were the most influential source of uncertainty. For values of WTP above EUR 130,000 per QALY, the treatment efficacy data had the greatest impact on decision uncertainty (Supplementary material 21, www.jocmr.org). Additional information on these data would contribute most to reducing the uncertainty surrounding which treatment modality is most cost-effective.
Scenario analysis
In the base-case analysis, we assumed that once patients progress to EDSS = 6 or SPMS, they would discontinue MS drug treatment. A scenario analysis was conducted varying the EDSS levels where drug treatment would be discontinued. The results of scenario analysis showed that ICERs were reduced when considering a stopping rule at EDSS = 7. We also assumed a stopping rule without considering SPMS progression. As we did not consider any treatment benefit for SPMS patients in our model, a scenario analysis without treatment discontinuation with progression to SPMS resulted in much higher ICERs.
We performed a scenario analysis where the time horizon varied within the range of 10 years. A time horizon of 30 years resulted in lower ICERs, and the scenario analysis indicated that a time horizon of 10 years would increase the ICERs.
We also conducted a scenario analysis where the starting age was changed within the range of 10 years. Scenario analysis showed that variation in the starting age had a very small impact on the results. However, treating younger patients would slightly decrease the ICERs.
The annual rate of treatment discontinuation was assumed to be 15% in the base-case analysis. Based on our NMA, the rate varied between 0% and 33%. We conducted two scenario-analyses where the annual rate of treatment discontinuation was considered to be 0% and 30%, respectively. The scenario analyses showed that discontinuation rate did not have a significant impact on the results.
It has been reported that more patients (about 22-28%) than assumed may need three cycles of alemtuzumab during the 5-year period (and some patients may need four (about 8-10% of patients) or five cycles (1.5%) of alemtuzumab). A scenario analysis was performed by varying the probability of patients who needed more than two cycles of alemtuzumab. The results showed that alemtuzumab still was the dominant strategy.
| Discussion | ▴Top |
We have assessed the comparative effectiveness and cost-effectiveness of 11 disease-modifying medicines used for MS in the Norwegian setting. The results are based on 37 RCTs.
The strongest effect against annual relapse was seen for alemtuzumab 12 mg. For disability progression, alemtuzumab was the most effective treatment; however, the quality of evidence was assessed to be low or very low. For evidence with high quality, dimethyl fumarate and fingolimod were the most effective treatments.
For withdrawal due to adverse events, the lower quality of the available evidence provides unclear conclusion. Results indicated that some treatments were associated with more withdrawal due to adverse events than placebo, such as fingolimod 1.25 mg and interferon beta-1a 44 µg. However, no treatments were found to increase significantly SAEs compared to placebo.
Our health economic analysis indicated that alemtuzumab was more effective and less costly than the other treatment alternatives dominating all other disease-modifying therapies.
A scenario analysis that excluded alemtuzumab (the dominant strategy) showed that natalizumab was the most effective (in terms of QALYs), and interferon beta-1a 22 mg was the least effective treatment. Fingolimod was the most expensive strategy and interferon beta-1b was the least expensive alternative. Discarding alemtuzumab, the results showed that only three treatment alternatives (interferon beta-1b (Extavia), peg-interferon beta-1a and natalizumab) could be cost-effective depending on the WTP threshold. Assuming a WTP below EUR 111,690 per QALY, interferon beta-1b (Extavia) was approximately 36% likely to be the most cost-effective treatment, followed by peg-interferon beta-1a (approximately 34% likely).
We performed several scenario analyses to test the uncertainty around the model assumptions. The results showed that, while there were numerical changes to the incremental cost-effectiveness ratio, the cost-effectiveness results were robust to variations in the model assumptions and the conclusions of the analysis would not change. The results of the probabilistic analysis showed that there is some degree of uncertainty regarding the input parameters. More research on efficacy and epidemiologic input parameters would have the greatest impact on reducing decision uncertainty.
Our results regarding clinical effectiveness are consistent with the results of the Canadian HTA report on drug therapies for RRMS [24], although we included more up to date evidence, and also evidence on more MS treatments. Our results are also in line with a recently published Cochrane SR [75].
While several cost-effectiveness studies have examined disease-modifying therapies for RRMS patients, to date, only the Canadian report [24] has compared almost all drugs in one analysis, as we have done in this NMA. It is difficult to compare our results to the Canadian results, as we included more treatment strategies, and used different input data (efficacy, costs and quality of life data).
Strengths and weaknesses
The SR included evidence on both established and emerging treatments. The available evidence for each drug treatment differs according to how long these have been on the market, with newer treatments having a smaller amount of documentation. Follow-up time of newer medicines is usually shorter, and some SAEs might only occur after a longer use of the medicine.
As MS diagnosis has changed through the years, studies conducted at a different time might differ in terms of the MS population included. Therefore, when comparing older with newer MS treatments, differences in results could partly be due to differences in patient population.
Treatment history among patients varied across the trials, being either unclear, treatment-naive, treatment experienced or a mixture. However, different statistical analyses provided similar results, and results were consistent when considering direct evidence, indirect evidence or the evidence from the whole network.
The available evidence does not allow us to investigate separately first- and second-line treatments or the sequence of using the drugs. Most published studies did not examine first and second medications separately. We, therefore, present results for all MS treatments together (independent of them being used as first- or second-line treatments). However, patients who use a first and a second treatment might differ, and discrepancies in treatments efficacy might be due to disparity in patients.
The clinical endpoints covered in the SR (clinical relapse and disability progression) are important clinical outcomes in MS which matters to patients. Magnetic resonance imaging (MRI) is a surrogate endpoint and, therefore, was not examined.
We also performed the economic evaluation of disease-modifying therapies based on a thorough SR of the literature, and estimates of treatment effectiveness on several clinical important endpoints obtained through an NMA. We used a probabilistic Markov-model, considered the appropriate approach for simulating the natural history of MS. We have tried to find the most robust and best evidence available but limitations associated with the data, and the simplifications of our health economic model should be considered when interpreting the results.
Study designs of published trials did not permit separate analyses of first- and second-line treatments, or conclusions regarding the sequential use of first- and second-line treatments. Therefore, we did not perform separate cost-effectiveness analyses for first- or second-line treatments. In addition, based on clinical expert opinion, we did not include combination therapy in our model analysis.
The transitional probabilities were based on estimates reported in the published literature, as we were not able to identify Norwegian data sources that were compatible to the developed model.
There is lack of documentation regarding the long-term effect of the newer drugs (e.g. alemtuzumab and dimethyl fumarate). Further research could change current estimates and consequently the health economic results.
In the model, we assumed that 20% of patients might need three cycles of alemtuzumab during a 5-year period [29]. We performed a scenario analysis by varying the proportion of patients who need more than two cycles of alemtuzumab during a 5-year period. The results showed that alemtuzumab still was the dominant strategy.
The results of our SR showed no significant differences between the therapies for SAEs. However, the risk of developing PML associated with natalizumab, even if it is rare, was considered important, and, therefore, included in the model. Based on the results of our SR, we assumed that the costs and disutility related to other adverse events would not have a significant impact on the results. It should also be mentioned that recently PML has also been reported in some patients treated with other disease-modifying therapies, such as dimethyl fumarate and fingolimod in post-marketing settings. Therefore, both FDA (Food and Drug Administration) and EMA (European Medicines Agency) have updated their recommendation to minimize the risk of the rare brain infection PML with dimethyl fumarate and fingolimod (ref). But, due to insufficient data, we included PML only for natalizumab in the model.
Glatiramer acetate 20 mg was included in the base-case analysis. Based on the results from our SR regarding relative rates of annual relapse and RR of disability progression, and also the estimated annual drug costs, it is highly probable that glatiramer acetate 40 mg three times per week will be as cost-effective as glatiramer acetate 20 mg per day (given that all the other parameters are the same).
Conclusion
The strongest effect against annual relapse was seen for alemtuzumab 12 mg. For disability progression, evidence of high quality indicated that dimethyl fumarate and fingolimod had the highest probability of being effective than other treatment alternatives. For withdrawal due to adverse events, the lower quality of the available evidence provides unclear conclusions. Results indicate however, that some treatments are associated with more withdrawal due to adverse events than others, such as fingolimod 1.25 and interferon beta-1a 44 µg.
Our health economic analysis indicated that alemtuzumab dominated all other disease-modifying therapies, as it was more effective and less costly than the other treatment alternatives.
A scenario analysis that excluded alemtuzumab (the dominant strategy) showed that three treatment alternatives (interferon beta-1b (Extavia), peg-interferon beta-1a and natalizumab) could be cost-effective depending on the WTP threshold. Assuming a WTP below EUR 111,690 per QALY, interferon beta-1b (Extavia) was approximately 36% likely to be the most cost-effective treatment, followed by peg-interferon beta-1a (approximately 34% likely).
The results of our analysis indicated that there is a substantial potential for cost-saving if more patients are started on the more effective and less costly treatment alternatives.
Acknowledgments
We thank research librarian Ingrid Harboe for her assistance in the literature searches, and Jan Odgaard-Jensen for his assistance with statistical analysis.
Financial Disclosure
This work was supported by the Norwegian Knowledge Centre for the Health Services.
Conflict of Interest
None of the authors have any conflict of interest related to this manuscript.
Author Contributions
VH carried out the economical part and drafted the manuscript. EC carried out the clinical part and commented on the manuscript. TR participated in the clinical part and commented on the manuscript. MK was responsible for the project and participated in its design, coordination and drafting of the manuscript.
| References | ▴Top |
- Compston A, Coles A. Multiple sclerosis. Lancet. 2008;372(9648):1502-1517.
doi - World Health Organization. Atlas multiple sclerosis in the world 2008: WHO press; 2008.
- Koch-Henriksen N, Sorensen PS. The changing demographic pattern of multiple sclerosis epidemiology. Lancet Neurol. 2010;9(5):520-532.
doi - Grytten N, Aarseth JH, Lunde HM, Myhr KM. A 60-year follow-up of the incidence and prevalence of multiple sclerosis in Hordaland County, Western Norway. J Neurol Neurosurg Psychiatry. 2016;87(1):100-105.
pubmed - Kingwell E, Evans C, Zhu F, Hashimoto S, Oger J, Tremlett H. Cancer risk following beta-interferon treatment for multiple sclerosis: Findings from the malignancy in MS [MAMS] study. Pharmacoepidemiol Drug Saf. 2013;22:21-22.
- McKay KA, Kwan V, Duggan T, Tremlett H. Risk factors associated with the onset of relapsing-remitting and primary progressive multiple sclerosis: a systematic review. Biomed Res Int. 2015;2015:817238.
doi pubmed - Lublin FD, Reingold SC, Cohen JA, Cutter GR, Sorensen PS, Thompson AJ, Wolinsky JS, et al. Defining the clinical course of multiple sclerosis: the 2013 revisions. Neurology. 2014;83(3):278-286.
doi pubmed - Tremlett H, Yinshan Z, Devonshire V. Natural history of secondary-progressive multiple sclerosis. Mult Scler. 2008;14(3):314-324.
doi pubmed - Koch M, Kingwell E, Rieckmann P, Tremlett H. The natural history of primary progressive multiple sclerosis. Neurology. 2009;73(23):1996-2002.
doi pubmed - Meyer-Moock S, Feng YS, Maeurer M, Dippel FW, Kohlmann T. Systematic literature review and validity evaluation of the Expanded Disability Status Scale (EDSS) and the Multiple Sclerosis Functional Composite (MSFC) in patients with multiple sclerosis. BMC Neurol. 2014;14:58.
doi pubmed - Dias S, Welton NJ, Caldwell DM, Ades AE. Checking consistency in mixed treatment comparison meta-analysis. Stat Med. 2010;29(7-8):932-944.
doi pubmed - Salanti G, Ades AE, Ioannidis JP. Graphical methods and numerical summaries for presenting results from multiple-treatment meta-analysis: an overview and tutorial. J Clin Epidemiol. 2011;64(2):163-171.
doi pubmed - Gobbi C, Meier DS, Cotton F, Sintzel M, Leppert D, Guttmann CR, Zecca C. Interferon beta 1b following natalizumab discontinuation: one year, randomized, prospective, pilot trial. BMC Neurol. 2013;13:101.
doi pubmed - Gold R, Kappos L, Arnold DL, Bar-Or A, Giovannoni G, Selmaj K, Tornatore C, et al. Placebo-controlled phase 3 study of oral BG-12 for relapsing multiple sclerosis. N Engl J Med. 2012;367(12):1098-1107.
doi pubmed - Zecca C, Riccitelli GC, Calabrese P, Pravata E, Candrian U, Guttmann CR, Gobbi C. Treatment satisfaction, adherence and behavioral assessment in patients de-escalating from natalizumab to interferon beta. BMC Neurol. 2014;14:38.
doi pubmed - Thompson JP, Abdolahi A, Noyes K. Modelling the cost effectiveness of disease-modifying treatments for multiple sclerosis: issues to consider. Pharmacoeconomics. 2013;31(6):455-469.
doi pubmed - Yamamoto D, Campbell JD. Cost-effectiveness of multiple sclerosis disease-modifying therapies: a systematic review of the literature. Autoimmune Dis. 2012;2012:784364.
doi - Kurtzke JF. Rating neurologic impairment in multiple sclerosis: an expanded disability status scale (EDSS). Neurology. 1983;33(11):1444-1452.
doi pubmed - Tremlett H, Zhu F, Petkau J, Oger J, Zhao Y. Natural, innate improvements in multiple sclerosis disability. Mult Scler. 2012;18(10):1412-1421.
doi pubmed - Nixon R, Bergvall N, Tomic D, Sfikas N, Cutter G, Giovannoni G. No evidence of disease activity: indirect comparisons of oral therapies for the treatment of relapsing-remitting multiple sclerosis. Adv Ther. 2014;31(11):1134-1154.
doi pubmed - Wong J, Gomes T, Mamdani M, Manno M, O’Connor PW. Adherence to multiple sclerosis disease-modifying therapies in Ontario is low. Can J Neurol Sci. 2011;38(3):429-433.
doi pubmed - Statistics Norway. 2015. [Available from: http://www.ssb.no/].
- Tappenden P, et al. Cost effectiven of beta interferons and glatiramer acetate in the management of multiple sclerosis. Sheffield (UK): School of Health and Related research (ScHARR); 2001.
- Tran K, et al. Comparative clinical and cost effectiveness of drug therapies for relapsing-remitting multiple sclerosis: PROSPERO/ CADTH; 2013. Available from: http://www.cadth.ca/media/pdf/TR0004_RRMS_ScienceReport_e.pdf.
- Prosser LA, Kuntz KM, Bar-Or A, Weinstein MC. Cost-effectiveness of interferon beta-1a, interferon beta-1b, and glatiramer acetate in newly diagnosed non-primary progressive multiple sclerosis. Value Health. 2004;7(5):554-568.
doi pubmed - Svendsen B. The cost of multiple sclerosis in Norway (not published data). 2013.
- Orme M, Kerrigan J, Tyas D, Russell N, Nixon R. The effect of disease, functional status, and relapses on the utility of people with multiple sclerosis in the UK. Value Health. 2007;10(1):54-60.
doi pubmed - Campbell JD, McQueen RB, Miravalle A, Corboy JR, Vollmer TL, Nair K. Comparative effectiveness of early natalizumab treatment in JC virus-negative relapsing-remitting multiple sclerosis. Am J Manag Care. 2013;19(4):278-285.
pubmed - Havrdova E, Arnold DL, Cohen JA, Compston DAS, Fox EJ, Hartung H-P, et al. Durable efficacy of alemtuzumab on clinical outcomes over 5 years in treatment-naive patients with active relapsing-remitting multiple sclerosis with most patients not receiving treatment for 4 years: CARE-MS I extension study: ECTRIMS Online Library; 2015. Available from: http://onlinelibrary.ectrims-congress.eu/ectrims/2015/31st/116625/eva.havrdova.durable.efficacy.of.alemtuzumab.on.clinical.outcomes.over.5.years.html?f=m3.
- Ebers G. London Ontario cohort study. London: NICE; 2001.
- Tappenden P, McCabe C, Earnshaw S, et al. The clinical effectiveness and cost-effectiveness of interferon-beta and glatiramer acetate in the management of relapsing/remitting and secondary progressive multiple sclerosis. The School of Health and Related Research, The University of Sheffield; 2006. Contract No: 01.01.2005.
- Briggs A, Sculpher M, Claxton K. Decision Modelling for Health Economic Evaluation. Oxford University Press. 2006.
- Held U, Heigenhauser L, Shang C, Kappos L, Polman C. Predictors of relapse rate in MS clinical trials. Neurology. 2005;65(11):1769-1773.
doi pubmed - Patzold U, Pocklington PR. Course of multiple sclerosis. First results of a prospective study carried out of 102 MS patients from 1976-1980. Acta Neurol Scand. 1982;65(4):248-266.
doi pubmed - Brew BJ, Davies NW, Cinque P, Clifford DB, Nath A. Progressive multifocal leukoencephalopathy and other forms of JC virus disease. Nat Rev Neurol. 2010;6(12):667-679.
doi pubmed - Dahlhaus S, Hoepner R, Chan A, Kleiter I, Adams O, Lukas C, Hellwig K, et al. Disease course and outcome of 15 monocentrically treated natalizumab-associated progressive multifocal leukoencephalopathy patients. J Neurol Neurosurg Psychiatry. 2013;84(10):1068-1074.
doi pubmed - Prestmo A, Hagen G, Sletvold O, Helbostad JL, Thingstad P, Taraldsen K, Lydersen S, et al. Comprehensive geriatric care for patients with hip fractures: a prospective, randomised, controlled trial. Lancet. 2015;385(9978):1623-1633.
doi - Wisloff T, Hagen G, Hamidi V, Movik E, Klemp M, Olsen JA. Estimating QALY gains in applied studies: a review of cost-utility analyses published in 2010. Pharmacoeconomics. 2014;32(4):367-375.
doi pubmed - Corrections to Safety and efficacy of fingolimod in patients with relapsing-remitting multiple sclerosis (FREEDOMS II): A double-blind, randomised, placebo-controlled, phase 3 trial. [Lancet Neurol 13 (2014) 545-56]. The Lancet Neurology. 2014;13(6):536.
- Calabresi PA, Kieseier BC, Arnold DL, Balcer LJ, Boyko A, Pelletier J, Liu S, et al. Pegylated interferon beta-1a for relapsing-remitting multiple sclerosis (ADVANCE): a randomised, phase 3, double-blind study. Lancet Neurol. 2014;13(7):657-665.
doi - Calabresi PA, Radue EW, Goodin D, Jeffery D, Rammohan KW, Reder AT, Vollmer T, et al. Safety and efficacy of fingolimod in patients with relapsing-remitting multiple sclerosis (FREEDOMS II): a double-blind, randomised, placebo-controlled, phase 3 trial. Lancet Neurol. 2014;13(6):545-556.
doi - Confavreux C, O’Connor P, Comi G, Freedman MS, Miller AE, Olsson TP, Wolinsky JS, et al. Oral teriflunomide for patients with relapsing multiple sclerosis (TOWER): a randomised, double-blind, placebo-controlled, phase 3 trial. Lancet Neurol. 2014;13(3):247-256.
doi - Fox RJ, Cree BA, De Seze J, Gold R, Hartung HP, Jeffery D, Kappos L, et al. MS disease activity in RESTORE: a randomized 24-week natalizumab treatment interruption study. Neurology. 2014;82(17):1491-1498.
doi pubmed - Khan O, Rieckmann P, Boyko A, Selmaj K, Zivadinov R. Three times weekly glatiramer acetate in relapsing-remitting multiple sclerosis. Ann Neurol. 2013;73(6):705-713.
doi pubmed - Mokhber N, Azarpazhooh A, Orouji E, Rao SM, Khorram B, Sahraian MA, Foroghipoor M, et al. Cognitive dysfunction in patients with multiple sclerosis treated with different types of interferon beta: a randomized clinical trial. J Neurol Sci. 2014;342(1-2):16-20.
doi pubmed - Vermersch P, Czlonkowska A, Grimaldi LM, Confavreux C, Comi G, Kappos L, Olsson TP, et al. Teriflunomide versus subcutaneous interferon beta-1a in patients with relapsing multiple sclerosis: a randomised, controlled phase 3 trial. Mult Scler. 2014;20(6):705-716.
doi pubmed - Vollmer TL, Sorensen PS, Selmaj K, Zipp F, Havrdova E, Cohen JA, Sasson N, et al. A randomized placebo-controlled phase III trial of oral laquinimod for multiple sclerosis. J Neurol. 2014;261(4):773-783.
doi pubmed - The IFNB Multiple Sclerosis Study Group. Interferon beta-1b is effective in relapsing-remitting multiple sclerosis. I. Clinical results of a multicenter, randomized, double-blind, placebo-controlled trial. Neurology. 1993;43(4):655-661.
doi pubmed - Ebers GC, PRISMS (Prevention of Relapses and Disability by Interferon beta-1a Subcutaneously in Multiple Sclerosis) Study Group. Randomised double-blind placebo-controlled study of interferon beta-1a in relapsing/remitting multiple sclerosis. Lancet. 1998;352(9139):1498-1504.
doi - Cadavid D, Wolansky LJ, Skurnick J, Lincoln J, Cheriyan J, Szczepanowski K, Kamin SS, et al. Efficacy of treatment of MS with IFNbeta-1b or glatiramer acetate by monthly brain MRI in the BECOME study. Neurology. 2009;72(23):1976-1983.
doi pubmed - Calabrese M, Bernardi V, Atzori M, Mattisi I, Favaretto A, Rinaldi F, Perini P, et al. Effect of disease-modifying drugs on cortical lesions and atrophy in relapsing-remitting multiple sclerosis. Mult Scler. 2012;18(4):418-424.
doi pubmed - Calabresi PA, Kieseier BC, Arnold DL, Balcer L, Boyko A, Pelletier J, et al. Clinical efficacy of peginterferon beta-1a in relapsingremitting multiple sclerosis: 2-year data from the phase 3 ADVANCE study. Mult Scler. 2014;(1):42-43.
- Clanet M, Radue EW, Kappos L, Hartung HP, Hohlfeld R, Sandberg-Wollheim M, Kooijmans-Coutinho MF, et al. A randomized, double-blind, dose-comparison study of weekly interferon beta-1a in relapsing MS. Neurology. 2002;59(10):1507-1517.
doi pubmed - Cohen JA, Barkhof F, Comi G, Hartung HP, Khatri BO, Montalban X, Pelletier J, et al. Oral fingolimod or intramuscular interferon for relapsing multiple sclerosis. N Engl J Med. 2010;362(5):402-415.
doi pubmed - Cohen JA, Coles AJ, Arnold DL, Confavreux C, Fox EJ, Hartung HP, Havrdova E, et al. Alemtuzumab versus interferon beta 1a as first-line treatment for patients with relapsing-remitting multiple sclerosis: a randomised controlled phase 3 trial. Lancet. 2012;380(9856):1819-1828.
doi - Coles AJ, Compston DA, Selmaj KW, Lake SL, Moran S, Margolin DH, Norris K, et al. Alemtuzumab vs. interferon beta-1a in early multiple sclerosis. N Engl J Med. 2008;359(17):1786-1801.
doi pubmed - Comi G, Filippi M, Wolinsky JS. European/Canadian multicenter, double-blind, randomized, placebo-controlled study of the effects of glatiramer acetate on magnetic resonance imaging--measured disease activity and burden in patients with relapsing multiple sclerosis. European/Canadian Glatiramer Acetate Study Group. Ann Neurol. 2001;49(3):290-297.
doi pubmed - De Stefano N, Stromillo ML, Giorgio A, Bartolozzi ML, Battaglini M, Baldini M, Portaccio E, et al. Establishing pathological cut-offs of brain atrophy rates in multiple sclerosis. J Neurol Neurosurg Psychiatry. 2016;87(1):93-99.
pubmed - Durelli L, Verdun E, Barbero P, Bergui M, Versino E, Ghezzi A, Montanari E, et al. Every-other-day interferon beta-1b versus once-weekly interferon beta-1a for multiple sclerosis: results of a 2-year prospective randomised multicentre study (INCOMIN). Lancet. 2002;359(9316):1453-1460.
doi - Etemadifar M, Janghorbani M, Shaygannejad V. Comparison of Betaferon, Avonex, and Rebif in treatment of relapsing-remitting multiple sclerosis. Acta Neurol Scand. 2006;113(5):283-287.
doi pubmed - Fox RJ, Miller DH, Phillips JT, Hutchinson M, Havrdova E, Kita M, Yang M, et al. Placebo-controlled phase 3 study of oral BG-12 or glatiramer in multiple sclerosis. N Engl J Med. 2012;367(12):1087-1097.
doi pubmed - Jacobs LD, Cookfair DL, Rudick RA, Herndon RM, Richert JR, Salazar AM, Fischer JS, et al. Intramuscular interferon beta-1a for disease progression in relapsing multiple sclerosis. The Multiple Sclerosis Collaborative Research Group (MSCRG). Ann Neurol. 1996;39(3):285-294.
doi pubmed - Johnson KP, Brooks BR, Cohen JA, Ford CC, Goldstein J, Lisak RP, Myers LW, et al. Copolymer 1 reduces relapse rate and improves disability in relapsing-remitting multiple sclerosis: results of a phase III multicenter, double-blind placebo-controlled trial. The Copolymer 1 Multiple Sclerosis Study Group. Neurology. 1995;45(7):1268-1276.
doi pubmed - Kappos L, Li D, Calabresi PA, O’Connor P, Bar-Or A, Barkhof F, Yin M, et al. Ocrelizumab in relapsing-remitting multiple sclerosis: a phase 2, randomised, placebo-controlled, multicentre trial. Lancet. 2011;378(9805):1779-1787.
doi - Kappos L, Radue EW, O’Connor P, Polman C, Hohlfeld R, Calabresi P, Selmaj K, et al. A placebo-controlled trial of oral fingolimod in relapsing multiple sclerosis. N Engl J Med. 2010;362(5):387-401.
doi pubmed - Lublin F, Cofield S, Cutter G, Salter A, Wang J, Conwit R, et al. Edss changes in combirx: Blinded, 7-year extension results for progression and improvement. Neurology. 2013;80(7 Supplement):P04.121.
- Mikol DD, Barkhof F, Chang P, Coyle PK, Jeffery DR, Schwid SR, Stubinski B, et al. Comparison of subcutaneous interferon beta-1a with glatiramer acetate in patients with relapsing multiple sclerosis (the REbif vs Glatiramer Acetate in Relapsing MS Disease [REGARD] study): a multicentre, randomised, parallel, open-label trial. Lancet Neurol. 2008;7(10):903-914.
doi - O’Connor P, Filippi M, Arnason B, Comi G, Cook S, Goodin D, Hartung HP, et al. 250 microg or 500 microg interferon beta-1b versus 20 mg glatiramer acetate in relapsing-remitting multiple sclerosis: a prospective, randomised, multicentre study. Lancet Neurol. 2009;8(10):889-897.
doi - O’Connor P, Lublin F, Wolinsky J, Comi G, Confavreux C, Freedman M. Teriflunomide reduces relapse-related sequelae, hospitalizations and corticosteroid use: A post-HOC analysis of the phase 3 tower study. 2013;80(7 Supplement):P07.109.
- O’Connor P, Wolinsky JS, Confavreux C, Comi G, Kappos L, Olsson TP, Benzerdjeb H, et al. Randomized trial of oral teriflunomide for relapsing multiple sclerosis. N Engl J Med. 2011;365(14):1293-1303.
doi pubmed - O’Connor PW, Li D, Freedman MS, Bar-Or A, Rice GP, Confavreux C, Paty DW, et al. A Phase II study of the safety and efficacy of teriflunomide in multiple sclerosis with relapses. Neurology. 2006;66(6):894-900.
doi pubmed - Panitch H, Goodin DS, Francis G, Chang P, Coyle PK, O’Connor P, Monaghan E, et al. Randomized, comparative study of interferon beta-1a treatment regimens in MS: The EVIDENCE Trial. Neurology. 2002;59(10):1496-1506.
doi pubmed - Polman CH, O’Connor PW, Havrdova E, Hutchinson M, Kappos L, Miller DH, Phillips JT, et al. A randomized, placebo-controlled trial of natalizumab for relapsing multiple sclerosis. N Engl J Med. 2006;354(9):899-910.
doi pubmed - Saida T, Kikuchi S, Itoyama Y, Hao Q, Kurosawa T, Nagato K, Tang D, et al. A randomized, controlled trial of fingolimod (FTY720) in Japanese patients with multiple sclerosis. Mult Scler. 2012;18(9):1269-1277.
doi pubmed - Tramacere I, Del Giovane C, Salanti G, D’Amico R, Filippini G. Immunomodulators and immunosuppressants for relapsing-remitting multiple sclerosis: a network meta-analysis. Cochrane Database Syst Rev. 2015;(9):CD011381.
doi
This article is distributed under the terms of the Creative Commons Attribution Non-Commercial 4.0 International License, which permits unrestricted non-commercial use, distribution, and reproduction in any medium, provided the original work is properly cited.
Journal of Clinical Medicine Research is published by Elmer Press Inc.