

| Journal of Clinical Medicine Research, ISSN 1918-3003 print, 1918-3011 online, Open Access |
| Article copyright, the authors; Journal compilation copyright, J Clin Med Res and Elmer Press Inc |
| Journal website http://www.jocmr.org |
Review
Volume 1, Number 5, December 2009, pages 249-261
Computer-aided Image Processing of Angiogenic Histological
Matvey Sprindzuka, c, Alexander Dmitruka, Vassili Kovaleva, Armen Bogusha, Alexander Tuzikova, Victor Liakhovskia, Mikhail Fridmanb
aUnited Institute of Informatics Problems, National Academy of Sciences of Belarus, Belarus
bMinsk City Hospital for Oncology, Belarus
cCorresponding author: Belarus, 220040, Minsk, Bogdanovicha lane 112/38
Manuscript accepted for publication November 27, 2009
Short title: Image Processing of Angiogenesis
doi: https://doi.org/10.4021/jocmr2009.12.1274
- Abstract
- Introduction: angiogenesis definition and its role in ovarian function and pathology
- Angiogenesis classification
- Vascular endothelial growth factor (VEGF)
- Major markers of the blood vessels
- Angiogenesis staging
- The concepts of the automated cancer diagnosis and the assessment of angiogenesis activity using image analysis for histological samples
- Conclusions
- References
| Abstract | ▴Top |
This article reviews the questions regarding the image evaluation of angiogeneic histological samples, particularly the ovarian epithelial cancer. Review is focused on the principles of image analysis in the field of histology and pathology. The definition, classification, pathogenesis and angiogenesis regulation in the ovaries are also briefly discussed. It is hoped that the complex image analysis together with the patient’s clinical parameters will allow an acquiring of a clear pathogenic picture of the disease, extension of the differential diagnosis and become a useful tool for the evaluation of drug effects. The challenge of the assessment of angiogenesis activity is the heterogeneity of several objects: parameters derived from patient’s anamnesis as well as of pathology samples. The other unresolved problems are the subjectivity of the region of interest selection and performance of the whole slide scanning.
Keywords: Angiogenesis; Image processing; Microvessel density; Cancer; Pathology
| Introduction: angiogenesis definition and its role in ovarian function and pathology | ▴Top |
The aim of this paper is to provide the reader with a brief understandable description of angiogenesis research facts and concepts, especially the histology sample image analysis strategies and its problems.
Angiogenesis, the development of the new capillaries from the already existing vessels, is an important process of the normal physiologic activities such as the cyclic ovarian function, wound healing and embryonic growth. Another definition: Angiogenesisis is the stimulation of the new endothelial cell growth and the new blood vessel development [1]. Angiogenesis was first described by Hunter in 1787 [2]. Despite the enormous amount of information concerning angiogenesis, to the best of our knowledge, there are only few literature sources describing the image analysis of angiogenesis [3-24] and even less about this topic in the field of ovarian cancer research [25-27].
Ovarian cancer is one of the major causes of female oncologic death worldwide (Fig. 1). It causes more than 140,000 deaths annually in women worldwide. About 21,650 cases of invasive ovarian cancer resulting in 15,520 deaths were predicted to occur in 2008 [28]. For decades, the classical treatment of this disease has been the platinum chemotherapy and surgery.
 Click for large image | Figure 1. Graphical description of ovarian cancer epidemiology (case incidence) in Belarus, 1995, 1999, 2004. Data taken from reference [34]. |
Angiogenesis is a key aspect of normal cyclical ovarian function. Follicular growth and the development of the corpus luteum (CL) are dependent on the proliferation of new capillary vessels. The process of selection of a dominant follicle in monovular species has been also associated with angiogenesis, as there is evidence that selected follicles possess more elaborate microvascular networks than other follicles. After blood vessel growth, the blood vessels regress, suggesting the coordinated action of inducers as well as inhibitors of angiogenesis in the course of the ovarian cycle [33].
Apparently, angiogenesis can be investigated on the level of the entire organism, as on the levels of an organ system, a separate organ, a tissue and cells. Angiogenesis on the histology sample section is assessed by the eye of the trained pathologist (manually), using the graticule, via Chalkey stereologic method and applying the image processing software.
| Angiogenesis classification | ▴Top |
Two main types of angiogenesis have been described: sprouting, the expansive growth of the vascular network; and remodeling, the rebuild of the vessel net. It is considered that the first type predominates in malignant tumor growth. However, Fox and colleagues (2007) do not include the remodeling in classification of the angiogenesis. They have suggested the classification of tumor neovascularization with 5 types. (1) Angiogenesis: the generation of new blood vessels from the existing vasculature; (2) Vasculogenesis, the de novo generation of blood vessels from endothelial cell progenitors, as occurs in the embryo; (3) Vascular remodeling: intussusceptive vascular growth, referring to vascular network formation by insertion of interstitial tissue columns into the vascular lumen and subsequent growth of these columns resulting in partitioning of the vessel lumen, endothelial cell division is not required for this form of vascular remodeling [35]; (4) Glomeruloid angiogenesis, which refers to the highly complex vascular aggregates that resemble glomeruli of the kidney, composed of a network of capillaries that are variably lined by basement membrane and pericytes; (5) Vascular mimicry defined as a complete capillary network composed of tumor cells themselves rather than vascular endothelial cells that conduct blood [36].
| Vascular endothelial growth factor (VEGF) | ▴Top |
VEGF/VPF (now termed VEGF-A) was first identified in 1993 by Senger and colleagues in ascites fluid of tumors in rodents. Years later, VEGF was found in the malignant effusions of several human tumors. VEGF is a heparin binding glycoprotein that occurs in at least four molecular isoforms as the result of alternative VEGF mRNA splicing [1].
The VEGF family is an increasingly important set of factors in ovarian cancer. VEGF has been established experimentally as one of the major inducers of ascites and its expression can be at least in part a consequence of a positive feedback loop where the ovarian cancer cells produce LPA, which in turn induces VEGF, causing ascites with high circulating concentrations of LPA. Several studies demonstrated the importance of other members of the VEGF family, including VEGF-C and VEGF-D, which induce de novo formation of lymphatic capillaries (lymphangiogenesis). These factors have also been shown to promote metastasis via the lymphatics. Further, the short isoform of the alternatively spliced VEGF receptor-3, the receptor tyrosine kinase receptor for VEGFs-C and -D, is related to development of lymph node metastasis in breast cancer. VEGF-C is induced by hypoxia, making it also likely to be involved in the development of ovarian cancer or the ascites of ovarian cancer. The role of the angiopoietins and the other VEGF family members has not yet been examined in detail in ovarian cancer [37].
VEGF receptors family is not the only molecules expressed differently in tumor and normal endothelial cells, and angiogenesis is not the only way of the cancer expansion, however its predominant pathogenic role is clearly established. The mentioned molecular group includes: (1) VEGF receptors; (2) Integrins (Avb3, Avb5); (3) Adhesion molecules (E-selectin, Endoglin); (4) Glycoproteins (Prostate-specific antigen); (5) Proteases.
Three main approaches to targeting angiogenesis in the treatment of ovarian cancer have been described. The first has been to target VEGF itself, the second to block the VEGF binding site on its cell surface receptors, and the third to inhibit tyrosine kinase activation and downstream signaling with small molecules at the intracellular level [28].
The extensive description of ovarian cancer pathology and treatment is beyond the scope of the article.
| Major markers of the blood vessels | ▴Top |
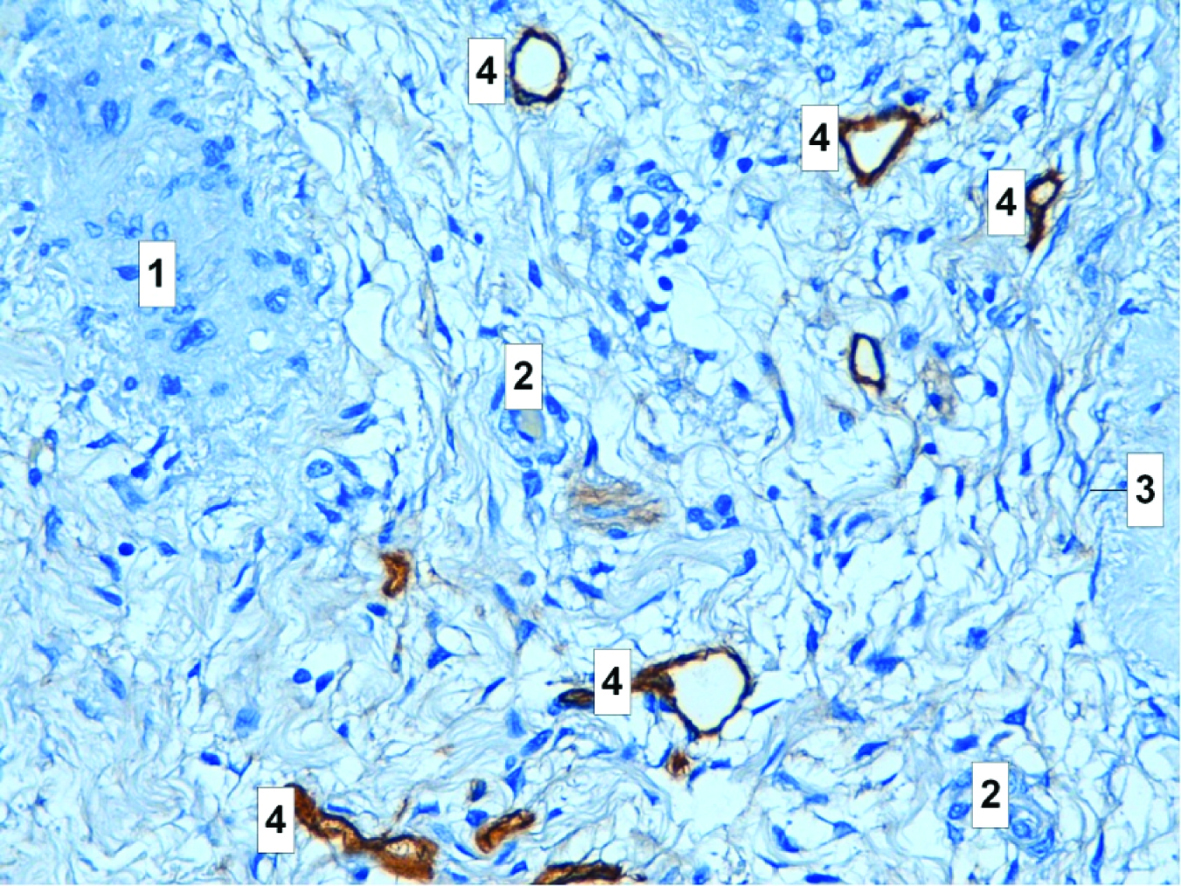
The most commonly used antibodies to highlight tumor blood vessels are those against Factor VIII related antigen, CD31/PECAM-1, and CD34. Factor VIII related antigen is a part of the von Willebrand factor complex and plays a role in the coagulation cascade. The platelet endothelial cell adhesion molecule CD31/PECAM-1 is a transmembrane glycoprotein involved in cell adhesion. CD34 is a surface glycoprotein of unknown function [1]. The both known blood vessel endothelial and lymphatic (panendothelial) markers are CD31, CD34, CD105, cadherin (adhesion molecules), VEGF2, VEGF3, Tie-2/Tek (tyrosine kinase receptors), CCL20/MIP-3-alpha (CC-chemokine), and E9 (endothelial protein) [2,38,39], (Table 1).
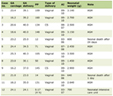 Click to view | Table 1. Panendothelial Angiogenesis Markers |
Angiogenesis regulation
The process of angiogenesis is regulated by the cytokines, growth factors, the interaction between the endothelial cells and components of the extracellular matrix and the surrounding cells, including macrophages, smooth muscle cells, fibroblasts. The initiation, further development and fading of the angiogenesis activity are dependent on the balance of the angiogenic and antiangiogenic factors in the endothelial cell microenvironment. Angiogenesis can be represented as the consequence of stages. For the malignant tumor it is a process starting from the single dormant endothelial cell which can grow to the magnificent vascular network providing the multi faceted homeostasis. The critical moment of the latent endothelial cell transformation to an active dividing cell is called the angiogenic switch. Ovarian function is dependent on the establishment and continual remodeling of a complex vascular system. This enables the follicle and/or CL to receive the required supply of nutrients, oxygen and hormonal support as well as facilitating the release of steroids. Moreover, the inhibition of angiogenesis results in the attenuation of follicular growth, disruption of ovulation and drastic effects on the development and function of the CL. It appears that the production and action of vascular endothelial growth factor A (VEGFA) is necessary to all these stages of development. The extensive vascularization of the CL enables it to receive one of the highest blood flows per unit tissue mass. Luteal blood flow remains at pre-ovulation levels in the collapsed follicle, but thereafter gradually increases in parallel with increases in luteal volume and coincides with increases in progesterone. The controlled, physiological angiogenesis that accompanies folliculogenesis, ovulation and luteal development requires the coordinated activity of multiple cell types and different angiogenic factors. It appears that VEGFA regulates angiogenesis by stimulating endothelial proliferation, migration and survival and is required at all stages from a secondary follicle right through to the mature CL. However, the often overlooked FGF2 plays a more dynamic role and is likely to be critical during the follicle- luteal transition [40].
The same factors that control angiogenesis in other organs also control angiogenesis in the endometrium. It is believed that VEGF by interacting with its receptor VEGFR-1 and VEGFR-2 plays a major role in controlling endometrial angiogenesis. However, there is no clear cyclic pattern of VEGF or VEGF receptor expression as it for example occurs in the ovary. Many of the other angiogenesis-regulating cytokines have also been detected in the endometrium including the positive angiogenesis regulators bFGF, TGF-β, TNF-α, and IL-8 and the negative regulator thrombospondin [41].
Interestingly, the three investigated gene polymorphisms did not correlate with any of the investigated clinico-pathological parameters. In univariate and multivariate models, only FIGO stage and patient's age at diagnosis, but not any polymorphism or any haplotype, were correlated with patients' overall survival. In this large multi-center study, the investigated VEGF gene polymorphisms were not associated with prognosis in patients with ovarian cancer [42].
In the normal cycling ovary of the mare the most intensive expression of the angiogenic factors VEGF A, VEGF B, Ang1, Ang2 and their receptors VEGF-R1, VEGF-R2 and Tie2 can be detected in granulosa, lutein and theca interna cells as well as in thecal vessels during the periovulatory period. In this context, especially VEGF A, Ang2, VEGF-R2 and Tie2 seem to be important for angiogenesis during follicular and luteal development, while Ang1 serves for vessel stabilization. VEGF B and VEGF-R1 are probably only of secondary importance. In contrast, during luteal regression and follicular atresia, the ?ndings in luteal regression and follicular atresia show that, in the absence of VEGF A, factor Ang2 and its receptor Tie2 contribute substantially to vessel regression [43].
| Angiogenesis staging | ▴Top |
This includes: (1) existing vessel endothelial cell basal membrane degradation and fragmentation influenced by the action of metalloproteases; (2) endothelial cell migration to the stromal tissue and extracellular matrix proteolytic degradation; (3) endothelial cell proliferation, new capillary tube formation, fusion of the formed vessels and its network development; (4) endothelial cell proliferation and migration suppression and fate under the influence of the angiogenic factors [44-47].
| The concepts of the automated cancer diagnosis and the assessment of angiogenesis activity using image analysis for histological samples | ▴Top |
Computers help health care professionals make robust decisions in various spheres of medicine, and in the realm of pathology image processing the opportunities of the software packages are of a special value. A perfect program should do anything what a human can and at the same time requires a minimum user intervention and conditions and performs as fast as possible. Unfortunately, not all the phenomena we can observe and investigate could be transformed in digits and this is the dilemma of the qualitative and quantitative analysis in research. The limitation of the image analysis software designed for the processing of angiogenesis samples is the problem of estimating the hypervascular areas which could be relatively easily assessed by an experienced pathologist. Computer can tell the scientist (this is the-output) what is the area of pixels had ascribed to the structures defined by the programmer who had put the computer language code (such as Java, C++ or C#). More complex features of an image such as the fractals could also be calculated by software. The obtained image features can be correlated with a spectrum of qualitative and quantitative parameters (patients age, comorbidity, biochemical values etc) and the diagnosis parameters are derived eventually. The fact that only few conducted studies have a weak statistic power, the meta-analysis of similar trials can serve as the reliable source of knowledge to make decisions about the right treatment and follow-up for patients.
Good software can calculate the relationship between the target objects on the screen and the areas occupying the recognized structures. Pathologists can not estimate and compute the exact numerical values looking at the image, but they can choose the region of interest for the further computations. The ideal software developed to evaluate angiogenesis should choose the necessary regions of interest on the image slide, to recognize correctly all available structures, but these are the unresolved questions of modern medical image analysis software engineering.
The first method of the quantitative evaluation of angiogenesis has been proposed and developed by Brem, the target of his research were the brain tumors [48].
At the beginning of research activities, the measure of the angiogenesis process activity was the vessel area, stained by a coloring reactive or via the immunochemical method. The search for the new reliable biomarkers of angiogenesis is ongoing, and along with this branch of investigation the new approaches to the angiogenesis image have been suggested. Since Weidner and colleagues estimated the microvessel density in the most vascularized area (hot spot) in their pioneering work in 1991, the same technique with slight modifications has been used widely to assess the prognostic value of angiogenesis in various types of carcinomas. Afterwards, the Chalkey method based on Chalkey eyepiece graticule was introduced to provide a quicker and more objective procedure for measuring tumor vascularity. Currently, the Chalkey assay with CD34 immunostaining has been suggested as a standard method for angiogenesis quantification in solid tumor sections in an international consensus report, although the basis for the consensus has been questioned by others.
Microvessel density assessment is the most commonly used technique to quantify intratumoral angiogenesis. It uses panendothelial immunohistochemical staining of blood microvessels, mainly with Factor VIII antigen (F. VIII Ag or von Willebrands factor), PECAM/CD31, or CD34; rarely with integrin v3, CD105, or type IV collagen. The first step in Weidners approach is the identification by light microscopy of the area of highest neovessel density, the so called "hot spot", by scanning the whole tumoral section at low power. Then, individual microvessels are counted at a higher power (x200 field) in an adequate area (e.g., 0.74 mm2 per field using x20 objective lens and x10 ocular). Any stained endothelial cell or clusters separate from adjacent vessels are calculated as a single microvessel, even in the absence of vessel lumen. Each single count is expressed as the highest number of microvessels identified at the hot spot. Some authors use Chalkey count or computerized image analysis systems, both aimed to minimize the subjectivity in the quantification of MVD. The Chalkey count consists of applying a 25-point eyepiece graticule on several hot spots (usually 3). The graticule is oriented to allow the maximum number of points to hit on or within the areas of stained microvessel profiles (Chalkey grid area: 0.196 mm2) [49]. Quantitating angiogenesis by the Chalkey method represents a relative area estimate of the vessels rather than a true vessel count. This has been thought to be an advantage by improving the objectivity of evaluation because the method abolishes one of the highly observer-dependent steps in microvessel density measuring: the decision whether two immunostained and adjacent structures were the reflection of one single or two separate blood vessels. Supporting this assumption, the Chalkey method has been shown to have less observer variation than estimation of microvessel density in breast cancer. An important observer-dependent step still remains in the selection of the densely vascularized areas, “vascular hot spots” for microvessel quantitation. However, the reproducibility is not necessarily optimized by choosing the same hot spot area. It was shown that high angiogenesis measured by the Chalkey method predicts poor overall survival in the whole study group and in the advanced stage ovarian cancers. Researchers suggested that, in order to define the clinical significance of this finding in more detail, further studies on other patient materials and perhaps comparison with other evaluation methods of angiogenesis in ovarian cancer should be conducted [50].
Steps of automated cancer diagnosis include: (1) Preprocessing (noise elimination and segmentation); (2) Feature extraction (feature types determination and selection); (3) Diagnosis (development of learning algorithms and statistical tests performance) [2].
In order to obtain the data on microvessel features, digital slide undergoes several stages of the image processing procedures: (1) Color deconvolution; (2) Light and dark staining thresholding; (3) Connecting endothelial cells in regions; (4) Completing vessels procedure; (5) Microvessel analysis [51].
The features of the histopathology sample image are classified according to their nature into the following groups: (1) morphological (vessel shape, perimeter); (2) texture (edge smoothness, roughness, coarseness etc.); (3) fractal (fractal dimension and lacunarity); (4) topological (spatial arrangement); (5) intensity based (color brightness) [52].
The morphological approach quantifies the size and shape of a cell or its nucleus. The textural approach makes use of spatial inter-relationships for the pixels to extract features and quantifies properties such as the smoothness, regularity, and coarseness of the image. The intensity based approach employs the distribution of the intensity values of pixels to define its features. The topological approach quantifies the spatial distribution of the cells within a tissue. Although these approaches lead to promising results in automated cancer diagnosis, they suffer from one or both of the two problems: (1) the difficulty of determining the exact locations of cells/nuclei in the biopsy image or (2) the noise that arises from its staining process. The cell-graph approach relies on cluster formation in cancerous cells to define their distinctive features. In this method, we identify the cell clusters on a tissue image as the nodes and compute the spatial dependency between every pair of these nodes to probabilistically assign the edges. Unlike the previous demonstrations, the cell-graph approach makes use of the cell clusters instead of the individual cells. Therefore, it eliminates the necessity of determining the exact locations of cells/nuclei on a tissue image, which allows using the low-magnification images. Furthermore, this approach relies on the dependency between the cell clusters rather than the pixels themselves and does not directly use the pixel values in feature extraction. Because of that, it is likely immune to noise inherit in a biopsy image [53].
The term fractal (from Latin fractus - irregular, fragmented) applies to objects in space or fluctuations in time that possess a form of self-similarity and cannot be described within a single absolute scale of measurement. Fractals are recurrently irregular in space or time, with themes repeated like the layers of an onion at different levels or scales. Fragments of a fractal object or sequence are exact or statistical copies of the whole and can be made to match the whole by shifting and stretching. Sequential fractal scaling relationships are observed in many physiological processes. Spatial structures of many living systems are fractal. Fractal geometry has evoked a fundamentally new view of how both nonliving and living systems result from the coalescence of spontaneous self-similar fluctuations over many orders of time and how systems are organized into complex recursively nested patterns over multiple levels of space. The fractal models may be used for image segmentation, texture classification, shape from-texture, and the estimation of 3-D roughness from image data. Related algorithms and suitable procedures are already implemented in some image processing software. If the parameters gained by the analysis are taken to supply classification problems where textural information is to be processed, the structures under consideration do not necessarily have to be fractals. In cellular morphometry cells and nuclei can be quantitatively described by measuring their fractal dimension [54].
Fractal dimension is a measure of how complicated a self-similar figure is. In a rough sense, it measures how many points lie in a given set. Somehow, though, fractal dimension captures the notion of ‘how large a set is’. Fractal object has a property that more fine structure is revealed as the object is magnified, similarly like morphological complexity means that more fine structure (increased resolution and detail) is revealed with increasing magnification. Fractal dimension measures the rate of addition of structural detail with increasing magnification, scale or resolution. The fractal dimension, therefore, serves as a quantifier of complexity. Fractals that have the same fractal dimension may look very different, they have different ‘texture’, more specifically, different lacunarity. Lacunarity is a counterpart to the fractal dimension that describes the texture of a fractal. It is strongly related with the size distribution of the holes on the fractal and with its deviation from translational invariance. Roughly speaking, if a fractal has large gaps or holes it has high lacunarity; on the other hand, if a fractal is almost translationally invariant it has low lacunarity. Lacunarity (from the Latin lacuna for lack, gap or hole) measures structural variation or inhomogenities that may be manifested by texture. In a restrictive sense it is a measure of the lack of rotational or translational invariance. In a more general sense, lacunarity is a measure of non uniformity (heterogeneity) of structure or the degree of structural variance within an object. Lacunarity is usually defined in terms of mass related distribution [54].
Syntactic structure analysis (SSA), a method often used for quantification of tissue architecture (the arrangement of vascular spatial positions in case of angiogenesis). This approach uses a binary representation of the centers of gravity of individual vessels to construct graphs or diagrams of which the characteristics are applied as contextual parameters. Examples of such figures are the Voronoi diagram, the Gabriels graph and the minimum spanning tree, which may give insight into the division of the blood supply inside the tumor and the immediate and distant vascular neighborhood relationships, respectively [55].
The fractal and syntactic analysis recently showed its reliability for the purposes of the research field of angiogenesis micropathology. Several authors have described a broad spectrum of descriptors for this relatively novel method [55-57]. These descriptors can provide a multi faceted comprehensive picture of the angiogenesis microscopic assay.
Entropy, correlation and image contrast are an image characteristics derived via the texture analysis. The color analysis, pixel color comparison, histology image texture analysis all have been applied in attempts to find an appropriate robust and reliable approach to the assessment of angiogenesis net [58,59].
Color is an important factor in defining structures in biological science. The fields of histology and pathology are founded on the use of special dyes and staining procedures that label cells or structures of interest with a defining color. Examples include the use of special stains for specific biochemical groups, e.g., trichrome stain for matrix and cell tissue, and the use of chromogenic substrates in enzyme linked-immunochemistry, e.g., immunoperoxidase labeling, and reporter enzyme constructs in transfected cells, e.g., b-galactosidase-transfected cells. Hence color image analysis (CIA), in which colored objects of interest are isolated or segmented from surrounding structures for subsequent measurement, is becoming an increasingly important tool in modern pathology and cell biology [60].
The methodology for MVD practical assessment is rather simple. It is similar to the original Weidner’s approach described above. The tumor is scanned at low power (x40-100) (center), and the three areas that contain the highest number of discrete microvessels are selected. The three hot spot areas containing the maximum number of discrete microvessels should be identified by scanning the entire tumor at low power (x40 and x100). This is the most subjective step of the procedure. It has been demonstrated that the experience of the observer determines the success of identifying the relevant hot spots. Poor selection will in turn lead to an inability to classify patients into different prognostic groups. Observers spend time in a laboratory where a period of training can be undertaken. Ideally, comparisons between hot spots chosen by an experienced investigator and trainee should be performed and continued on different series until there is more than 90% agreement. Training can be completed by assessing sections from a series that already contain prognostic information. Inexperienced observers tend to be drawn to areas with dilated vascular channels, often within the sclerotic body of the tumor. These central areas together with necrotic tumor should be ignored. Vascular lumina or erythrocytes are not a requirement to be considered a countable vessel; indeed, many of the microvessels have a collapsed configuration. Although the hot spot areas can occur anywhere within the tumor, they are generally at the tumor periphery, making it important to include the normal tumor interface in the representative area to be assessed. Vessels outside the tumor margin by one x200-250 field diameter and immediately adjacent to benign tissues should not be counted. The procedure takes 2-5 min. Once selected, a 25-point Chalkey point eyepiece graticule at x200-250 should then be oriented over each hot spot region so that the maximum number of graticule points are on or within areas of highlighted vessels. Particular care should be taken in the occasional case (<1% breast cancers) for which an intense plasma cell infiltrate can mimic a hot spot and obscure the underlying tumor vasculature. Plasma cells can otherwise be disregarded on morphological grounds. The mean of the three Chalkey counts is then generated for each tumor and used for statistical analysis. The procedure takes 2-3 min. For the intratumoral microvessel density index, any endothelial cell or endothelial cell cluster separate from adjacent microvessel, tumor cells, or matrix elements is considered a countable vessel. Those that appear to be derived from the same vessel if distinct should also be counted. Again, vessel lumens and erythrocytes are not included in the criteria defining a microvessel. There is no cutoff for vessel caliber. The procedure takes 3-6 min [61].
Angiogenesis measured by MVD method correlates with the tumor behavior. There is a vast body of facts showing that the angiogenesis intensity and a higher MVD are associated with the metastases development, poor prognosis and life longevity shortage in breast [36,62-64], urine bladder [65,66], renal cell [67] and stomach cancer patients [68-72]. In the area of ovarian cancer clinical investigations and histology sample image analysis and pathology differential diagnosis, the data on the prognostic significance and reliability of MVD is controversial [1,73-77]. Bamberger and Perret in 2002 concluded that in contrast with the breast tumor evaluation, there is no clear correlation of the MVD parameter with an ovarian cancer patient age, tumor stage, growth rate, dimension, ascites; for the various histological subtypes of ovarian cancer, MVD is different [1]. The further research in this direction elucidated the similar contradictions [74]. It can be hypothesized that the discrepancy of various conclusions is explained by the heterogeneity of patients genotypes in context of the biomarker expression. Other reasons are the differences of micro sample images. Several scientists have discussed the disadvantages and limitations of the MVD evaluation techniques [78-80]. Brown based on his personal observational experience and the literature data of other research groups postulated that this method is not an appropriate one for the precise angiogenesis activity assessment in large scale randomized clinical trials [80].
Microvascular density would be a good indicator of therapeutic efficacy, but it has not been as useful for efficacy as it has been for prognosis. Since the early studies, hundreds of reports have examined the prognostic value of microvascular density in several forms of cancer. Nevertheless, despite the initial confirmatory publications, numerous reports appeared in the literature that failed to show a positive association between increasing tumor vascularity and reduced patient outcome, and caution as to the clinical utility of tumor angiogenesis is being urged. However, many of these negative studies may result from significant differences in methodologies [2].
Quantification of tumor angiogenesis by counting microvessels in immunostained tissue sections was ranked by The College of American Pathologists in category III, encompassing “all factors which are not sufficiently studied to demonstrate their prognostic value”. The issues of methodological variation mentioned include: antibody selection, type of ?xative used, methods of counting vessels, calculation of microvessel density, observer variability (especially of the selection of the field in which to count) and cut-off value for ‘increased’ vascularity [35]. Thus, the negative qualities of the ‘gold standard’ are the reasons for the investigation in order to find a new better approach to the stained capillary specimen image analysis.
The alternative ways of the quantitative angiogenesis evaluation are the determination of microvessel density in the randomly selected areas or in an intentionally chosen such as the tumor tissue edges. Whether the both methods provide the same biologic information or one is better in terms of some features over another, this question is open for the debates. Besides the MVD density itself, there are several parameters which can be determined and quantified analyzing the image of the angiogenesis network: mean microvessel surface proportions, vascular area fraction, absolute number of vessels, absolute microvessel number and their perimeter, vessel angle, length and squares of the defined capillary categories [10,81,82]. The object of the angiogenesis measurement of the Angio quant program (software which is freely available for the aims of scientific research at www.cs.tut.fi) is the network of the joint tubular complexes. The software can determine the length and the size of these tubular complexes and the number of network connections (branch points) in a complex. The developers concluded that the distribution of the length parameter in evaluation of the experimental angiogenesis obeys the power law [16,83]. Moreover, in his research papers, Blacher et al mentioned the vessel length density, in particular, radially arranged, capillary fractal dimension and the mean capillary diameter as the evaluation characteristics [84].
When the MVD is calculated, the separate object stained for example with CD34 biomarker is registered as 1 vessel. It is assumed that by its nature, the immunochemical vessel staining is not an ideal diagnostic technique, because its important drawback is the fact that the surrounding vessels or the cluster of them can be recognized as 1 object, which will seriously negatively bias the future conclusions of the research [85,86].
Another interesting research field is the image densitometry applying the Feulgen reaction, which have been widely used for the DNA analysis [87-95]. The VEGF mRNA may be an appropriate target of this method for the indirect evaluation of the angiogenesis growth and intensity. In its initial formulation, the histochemical reaction developed by Robert Feulgen was used simply for the detection of DNA in the nucleus (Feulgen and Rossenbeck 1924), but since the demonstration that it is both specific and stoichiometric for DNA it has become the most important means of staining nuclear DNA for densitometric quantification. The protocol has been modified frequently and substantially since its early development, but the basic components have not been altered [96].
Spectral analysis has been applied for the image processing derived via microscopy for several years but to our knowledge this modality did not gain the wide spread use for the angiogenesis activities investigations [97,98]. Spectral methods are based on the calculation of the eigenovectors and eigenovalues of a matrix derived from the affinities of the pixels in the image [99]. According to Laitakari (Finland), integrated optical density (IOD) is defined as the sum of individual pixel staining intensity values of the objects, e.g. nuclei or vessels. This is referred to later as total staining intensity (TSI). Average staining intensity (ASI) is defined as TSI divided by the number of pixels in an object, thus being independent of object size. Accuracy, maximum 0.1μm, is defined as the smallest measurable unit achieved repeatedly from the same measurement. Sensitivity is defined as the minimum level of light intensity needed to separate two different measurements, specificity is defined as the minimal measurable difference between different light emissions, reliability is the difference when the same specimen is measured similarly on two different occasions, and repeatability is the difference in measurements when the same measurement is repeated several times [31].
| Conclusions | ▴Top |
The problem of angiogenesis in medicine touches such questions as the development and the implementation of the novel methods for a vascularized tissue staining, the elaboration of the reliable, precise and robust methods for the machine recognition and processing of the cell structures visualized on the organ tissue sections. The discovery of the new endothelial biomarkers has allowed developing immunochemical reactives for the clear and concise vascular structures visualization, and the quantitative computer-assisted analysis of this image provides a stable, non emotional unbiased assessment, which serves as the evidence-based fundament for the really scientific concepts and conclusions.
The principal problem of angiogenesis research is the heterogeneity of various aspects of the research spheres: the unique genetic package inherited to every patient creates the unique picture of angiogenesis network. The ovarian tumors are classified according to their tissue structure features and in order to conclude a scientifically and, in particular statistically true and valid statements, it is necessary to select a group of patients having similar characteristics. The limitations of many studies are the minor number of similar objects. These obvious rules are necessary to determine the validity of such conclusions as the role of microvessel density and the other features derived from the image analysis of a histology section.
Many pathologists prefer to use one representative section taken from the gross tumor specimen, and this section is scanned, then several shots are taken (usually 3) of the hot spot areas. To our opinion, for the research purposes, the entire slide should be scanned or if the microscope has no a function like this, the pathologist should take as many camera shots as possible to cover the significant surface of the sample at a various magnification rates. This method is appropriate when the researchers aim to investigate the image objects which are not recognizable for a human eye neither with nor without a microscope. The disadvantage of this approach is the problem that this task is excessively time-consuming, and the derived slides from the whole slide surface might lack its representativeness and eventually be a low-yield in terms of the useful scientific information.
Conflict of interest and grant support
The authors declare no conflict of interest. This study was supported by the ISTC B-1682 Studying ovarian cancer angiogenesis for advancing diagnosis and treatment of the fifths leading cause of death in women, and by CRDF BEM1-4028-MK-08 “Development of methods, algorithms and software for the analysis of angiogenic activity of thyroid cancer”.
| References | ▴Top |
- Bamberger ES, Perrett CW. Angiogenesis in epithelian ovarian cancer. Mol Pathol. 2002;55(6):348-359.
pubmed - Ribatti D, SpringerLink (Online service). History of Research on Tumor Angiogenesis. In. Dordrecht: Springer Netherlands; 2009.
- Bhatti SS, Kumar L, Dinda AK, Dawar R. Prognostic value of bone marrow angiogenesis in multiple myeloma: use of light microscopy as well as computerized image analyzer in the assessment of microvessel density and total vascular area in multiple myeloma and its correlation with various clinical, histological, and laboratory parameters. Am J Hematol. 2006;81(9):649-656.
pubmed - Blatt RJ, Clark AN, Courtney J, Tully C, Tucker AL. Automated quantitative analysis of angiogenesis in the rat aorta model using Image-Pro Plus 4.1. Comput Methods Programs Biomed. 2004;75(1):75-79.
pubmed - Conrad TJ, Chandler DB, Corless JM, Klintworth GK. In vivo measurement of corneal angiogenesis with video data acquisition and computerized image analysis. Lab Invest. 1994;70(3):426-434.
pubmed - Doukas CN, Maglogiannis I, Chatziioannou A, Papapetropoulos A. Automated angiogenesis quantification through advanced image processing techniques. Conf Proc IEEE Eng Med Biol Soc. 2006;1:2345-2348.
pubmed - Doukas CN, Maglogiannis I, Chatziioannou AA. Computer-supported angiogenesis quantification using image analysis and statistical averaging. IEEE Trans Inf Technol Biomed. 2008;12(5):650-657.
pubmed - Hayek A, Beattie GM, Lopez AD, Chen P. The use of digital image processing to quantitate angiogenesis induced by basic fibroblast growth factor and transplanted pancreatic islets. Microvasc Res. 1991;41(2):203-209.
pubmed - Iwahana M, Nakayama Y, Tanaka NG, Goryo M, Okada K. Quantification of tumour-induced angiogenesis by image analysis. Int J Exp Pathol. 1996;77(3):109-114.
pubmed - Karnabatidis D, Dimopoulos J, Siablis D, Papazafiropoulos D, Kalogeropoulou C, Nikiforidis G. Quantification of the ionising radiation effect over angiogenesis in the chick embryo and its chorioallantoic membrane by computerised analysis of angiographic images. Acta Radiologica. 2001;42(3):333-338.
- Kim SW, Park SS, Ahn SJ, Chung KW, Moon WK, Im JG, Yeo JS,
et al . Identification of angiogenesis in primary breast carcinoma according to the image analysis. Breast Cancer Res Treat. 2002;74(2):121-129.
pubmed - Krecicki T, Dus D, Kozlak J, Tarnawski W, Jelen M, Zalesska-Krecicka M, Szkudlarek T. Quantitative evaluation of angiogenesis in laryngeal cancer by digital image measurement of the vessel density. Auris Nasus Larynx. 2002;29(3):271-276.
pubmed - Lee JS, Jung JJ, Kim J. Quantification of angiogenesis by a computerized image analysis system in renal cell carcinoma. Anal Quant Cytol Histol. 2000;22(6):469-474.
pubmed - Leme MB, Waitzberg AF, Artigiani Neto, Linhares MM, Matos D. [Assessment of angiogenesis expression and its relationship with prognosis of colorectal cancer by conventional and computer-assisted histopathological image analysis]. Acta Cir Bras. 2006;21(6):392-397.
pubmed - Mete M, Hennings L, Spencer HJ, Topaloglu U. Automatic identification of angiogenesis in double stained images of liver tissue. BMC Bioinformatics. 2009;10
pubmed - Niemisto A, Dunmire V, Yli-Harja O, Zhang W, Shmulevich I. Robust quantification of in vitro angiogenesis through image analysis. IEEE Trans Med Imaging. 2005;24(4):549-553.
pubmed - Nikiforidis G, Papazafiropoulos D, Siablis D, Karnabatidis D, Hatjikondi O, Dimopoulos J. Quantitative assessment of angiogenesis in the chick embryo and its chorioallantoic membrane by computerised analysis of angiographic images. Eur J Radiol. 1999;29(2):168-179.
pubmed - Olewniczak S, Chosia M, Kolodziej B, Kwas A, Kram A, Domagala W. Angiogenesis as determined by computerised image analysis and the risk of early relapse in women with invasive ductal breast carcinoma. Pol J Pathol. 2003;54(1):53-59.
pubmed - Peifer C, Dannhardt G. A novel quantitative chick embryo assay as an angiogenesis model using digital image analysis. Anticancer Res. 2004;24(3a):1545-1551.
pubmed - Peters K, Schmidt H, Unger RE, Otto M, Kamp G, Kirkpatrick CJ. Software-supported image quantification of angiogenesis in an in vitro culture system: application to studies of biocompatibility. Biomaterials. 2002;23(16):3413-3419.
pubmed - Rohr S, Toti F, Brisson C, Albert A, Freund M, Meyer C, Cazenave JP. Quantitative image analysis of angiogenesis in rats implanted with a fibrin gel chamber. Nouv Rev Fr Hematol. 1992;34(4):287-294.
pubmed - Santos AF, Zaltsman AB, Martin RC, Kuzmin A, Alexandrov Y, Roquemore EP, Jessop RA,
et al . Angiogenesis: an improved in vitro biological system and automated image-based workflow to aid identification and characterization of angiogenesis and angiogenic modulators. Assay Drug Dev Technol. 2008;6(5):693-710.
pubmed - Tarta C, da Silva, Teixeira CR, Prolla JC, Meurer L, Neto CC, Tanaka S. Digital image analysis and stereology of angiogenesis in polypoid and nonpolypoid colorectal adenomas. Anal Quant Cytol Histol. 2004;26(4):201-206.
pubmed - Wild R, Ramakrishnan S, Sedgewick J, Griffioen AW. Quantitative assessment of angiogenesis and tumor vessel architecture by computer-assisted digital image analysis: effects of VEGF-toxin conjugate on tumor microvessel density. Microvasc Res. 2000;59(3):368-376.
pubmed - Schoell WM, Pieber D, Reich O, Lahousen M, Janicek M, Guecer F, Winter R. Tumor angiogenesis as a prognostic factor in ovarian carcinoma: quantification of endothelial immunoreactivity by image analysis. Cancer. 1997;80(12):2257-2262.
pubmed - Nayha V, Stenback F. Angiogenesis and expression of angiogenic agents in uterine and ovarian carcinosarcomas. APMIS. 2008;116(2):107-117.
pubmed - Liang YJ, Wu YZ, Gu MJ. [Angiogenesis and micrometastases of regional lymph node in ovarian cancer]. Ai Zheng. 2003;22(2):185-188.
pubmed - Stack MS, Fishman DA. Ovarian cancer. Boston: Kluwer Academic Publisers, 2002: xii, 387 p.
- Goljan EF. Pathology. 2nd ed. Philadelphia, PA: Mosby Elsevier, 2007: xiv, 739 p.
- Hennessy BT, Markman M. Development of novel agents for ovarian cancer. 2009;3(3):119-132.
- Available from: http://herkules.oulu.fi..
- Krecicki T, Dus D, Kozlak J, Tarnawski W, Jelen M, Zalesska-Krecicka M, Szkudlarek T. Quantitative evaluation of angiogenesis in laryngeal cancer by digital image measurement of the vessel density. Auris Nasus Larynx. 2002;29(3):271-276.
- Ferrara N. Angiogenesis : from basic science to clinical applications. Boca Raton: CRC/Taylor & Francis, 2007: 280 p [287] p. of plates..
- http://minzdrav.by/med/docs/journal/St2_2006_2.doc..
- Vermeulen PB, Gasparini G, Fox SB, Colpaert C, Marson LP, Gion M, Belien JA,
et al . Second international consensus on the methodology and criteria of evaluation of angiogenesis quantification in solid human tumours. Eur J Cancer. 2002;38(12):1564-1579.
pubmed - Fox SB, Generali DG, Harris AL. Breast tumour angiogenesis. Breast Cancer Res. 2007;9(6):216.
pubmed - Kohn EC. Angiogenesis in ovarian carcinoma: a formidable biomarker. Cancer. 1997;80(12):2219-2221.
pubmed - Wang JM, Kumar S, van Agthoven A, Kumar P, Pye D, Hunter RD. Irradiation induces up-regulation of E9 protein (CD105) in human vascular endothelial cells. Int J Cancer. 1995;62(6):791-796.
pubmed - Jurisic G, Detmar MLymphatic endothelium in health and disease. 2009;335(1):97-108.
- Robinson RS, Woad KJ, Hammond AJ, Laird M, Hunter MG, Mann GE. Angiogenesis and vascular function in the ovary. Reproduction. 2009;
pubmed - Augustin HG. Angiogenesis in the female reproductive system. EXS. 35-52.
pubmed - Polterauer S, Grimm C, Mustea A, Concin N, Tanner B, Thiel F, Heinze G,
et al . Vascular endothelial growth factor gene polymorphisms in ovarian cancer. Gynecologic Oncology. 2007;105(2):385-389. - Muller K, Ellenberger C, Schoon HA. Histomorphological and immunohistochemical study of angiogenesis and angiogenic factors in the ovary of the mare. Res Vet Sci. 2009;May 15.
pubmed - Burlev V, Il'yasova N N, Dubinskaya E. Proliferative activity of microvessels and angiogenesis in eutopic endometrium in patients with peritoneal endometriosis. Bulletin of Experimental Biology and Medicine. 2005;139(6):727-731.
- Sokolov D, Solodovnikova N, Pavlov O, Niauri D, Volkov N, Sel'kov S. Study of cytokine profile and angiogenic potential of peritoneal fluid in patients with external genital endometriosis. Bulletin of Experimental Biology and Medicine. 2005;140(5):541-544.
- Burlev V, Gasparov A, Dubinskaya E, Ilyasova N. Variants of angiogenic activity of peritoneal endometriosis and infertility treatment efficacy.. Problemy Reproduktsii. 2008;14(2):53.
- Burlev V, Dubinskaya E, Ilyasova N, Gavrilova T, Adamyan L. Markers of angiogenesis in the blood serum and peritoneal fluid in patients with adenomiosis. Problemy Reproduktsii. 2006;12(2):55.
- Brem SS, Zagzag D, Tsanaclis AM, Gately S, Elkouby MP, Brien SE. Inhibition of angiogenesis and tumor growth in the brain. Suppression of endothelial cell turnover by penicillamine and the depletion of copper, an angiogenic cofactor. Am J Pathol. 1990;137(5):1121-1142.
pubmed - Uzzan B, Nicolas P, Cucherat M, Perret G-Y. Microvessel Density as a Prognostic Factor in Women with Breast Cancer: A Systematic Review of the Literature and Meta-Analysis. Cancer Res. 2004;64(9):2941-2955.
- Suhonen KA, Anttila MA, Sillanpaa SM, Hamalainen KM, Saarikoski SV, Juhola M, Kosma VM. Quantification of angiogenesis by the Chalkley method and its prognostic significance in epithelial ovarian cancer. Eur J Cancer. 2007;43(8):1300-1307.
pubmed - https://aperio.com/.../Aperio%20Science%20Webinar%20-%20Image%20Analysis%20101.pdf.
- Demir C, Yener B. Automated cancer diagnosis based on histopathological images: a systematic survey. Rensselaer Polytechnic Institute, Tech. Rep. 2005;
- Demir C, Gultekin S, Yener B. Spectral analysis of cell-graphs of cancer. Department of Computer Science, Rensselaer Polytechnic Institute, Troy, New York. 2004;
- Klonowski W. Signal and image analysis using chaos theory and fractal geometry. Machine Graphics and Vision. 2000;9((1/2)):403-432.
- Weyn B, Tjalma WA, Vermeylen P, van Daele, Van Marck, Jacob W. Determination of tumour prognosis based on angiogenesis-related vascular patterns measured by fractal and syntactic structure analysis. Clin Oncol (R Coll Radiol). 2004;16(4):307-316.
pubmed - Kirchner LM, Schmidt SP, Gruber BS. Quantitation of angiogenesis in the chick chorioallantoic membrane model using fractal analysis. Microvasc Res. 1996;51(1):2-14.
pubmed - Lazarovici P, Gazit A, Staniszewska I, Marcinkiewicz C, Lelkes PI. Nerve growth factor (NGF) promotes angiogenesis in the quail chorioallantoic membrane. Endothelium. 2006;13(1):51-59.
pubmed - Choi HJ, Choi IH, Cho NH, Choi HK. Color image analysis for quantifying renal tumor angiogenesis. Anal Quant Cytol Histol. 2005;27(1):43-51.
pubmed - Hoffman RM. Imaging tumor angiogenesis with fluorescent proteins. APMIS. 2004;112:441-449.
pubmed - Ornberg R, Woerner B, Edwards D. Analysis of stained objects in histological sections by spectral imaging and differential absorption. Journal of Histochemistry and Cytochemistry. 1999;47(10):1307.
- Murray JC. Angiogenesis protocols. In: Methods in molecular medicine 46. Totowa, N.J.: Humana Press; 2001.
- Fox SB, Turner GD, Leek RD, Whitehouse RM, Gatter KC, Harris AL. The prognostic value of quantitative angiogenesis in breast cancer and role of adhesion molecule expression in tumor endothelium. Breast Cancer Res Treat. 1995;36(2):219-226.
pubmed - Fox SB. Quantitative angiogenesis in breast cancer. Methods Mol Med. 2006;120:161-187.
pubmed - Fox SB, Leek RD, Smith K, Hollyer J, Greenall M, Harris AL. Tumor angiogenesis in node-negative breast carcinomas--relationship with epidermal growth factor receptor, estrogen receptor, and survival. Breast Cancer Res Treat. 1994;29(1):109-116.
pubmed - Dickinson AJ, Fox SB, Persad RA, Hollyer J, Sibley GN, Harris AL. Quantification of angiogenesis as an independent predictor of prognosis in invasive bladder carcinomas. Br J Urol. 1994;74(6):762-766.
pubmed - Palmero Marti, Queipo Zaragoza, Ruiz Cerda, Vera Donoso, Rubio Martinez, Vera Sempere, Jimenez Cruz. [Study of the angiogenesis as prognostic factor of pT1G3 bladder tumours]. Actas Urol Esp. 2004;28(8):594-601.
pubmed - Strohmeyer D. Pathophysiology of tumor angiogenesis and its relevance in renal cell cancer. Anticancer Res. 1999;19(2C):1557-1561.
pubmed - Tanigawa N, Amaya H, Matsumura M, Lu C, Iki M. Association between tumor angiogenesis and Borrmann type 4 carcinomas of the stomach. Oncology. 1998;55(5):461-467.
pubmed - Takahashi R, Tanaka S, Hiyama T, Ito M, Kitadai Y, Sumii M, Haruma K,
et al . Hypoxia-inducible factor-1alpha expression and angiogenesis in gastrointestinal stromal tumor of the stomach. Oncol Rep. 2003;10(4):797-802.
pubmed - Takahashi R, Tanaka S, Kitadai Y, Sumii M, Yoshihara M, Haruma K, Chayama K. Expression of vascular endothelial growth factor and angiogenesis in gastrointestinal stromal tumor of the stomach. Oncology. 2003;64(3):266-274.
pubmed - Takahashi Y, Ellis LM, Ohta T, Mai M. Angiogenesis in poorly differentiated medullary carcinoma of the stomach. Surg Today. 1998;28(4):367-372.
pubmed - Turner HE, Harris AL, Melmed S, Wass JA. Angiogenesis in endocrine tumors. Endocr Rev. 2003;24(5):600-632.
pubmed - Schoell W, Pieber D, Reich O, Lahousen M, Janicek M, Guecer F, Winter R. Tumor angiogenesis as a prognostic factor in ovarian carcinoma. Cancer. 1997;80(12):
- Merritt WM, Sood AK. Markers of angiogenesis in ovarian cancer. Dis Markers. 2007;23:419-431.
pubmed - Macchiarelli G, Jiang JY, Nottola SA, Sato E. Morphological patterns of angiogenesis in ovarian follicle capillary networks. A scanning electron microscopy study of corrosion cast. Microsc Res Tech. 2006;69(6):459-468.
pubmed - Hollingsworth HC, Kohn EC, Steinberg SM, Rothenberg ML, Merino MJ. Tumor angiogenesis in advanced stage ovarian carcinoma. Am J Pathol. 1995;147(1):33-41.
pubmed - Folkman J. A new link in ovarian cancer angiogenesis: lysophosphatidic acid and vascular endothelial growth factor expression. J Natl Cancer Inst. 2001;93(10):734-735.
pubmed - Weidner N. Intratumor microvessel density as a prognostic factor in cancer. Am J Pathol. 1995;147(1):9-19.
pubmed - Weidner N, Carroll PR, Flax J, Blumenfeld W, Folkman J. Tumor angiogenesis correlates with metastasis in invasive prostate carcinoma. Am J Pathol. 1993;143(2):401-409.
pubmed - Brown AP, Citrin DE, Camphausen KA. Clinical biomarkers of angiogenesis inhibition. Cancer Metastasis Rev. 2008;27(3):415-434.
pubmed - Kim N, Elie N, Plancoulaine B, Herlin P, Coster M. An original approach for quantification of blood vessels on the whole tumour section. Analytical cellular pathology. 2003;25(2):63-75.
- Olewniczak S, Chosia M, Kolodziej B, Kwas A, Kram A, Domagala W. Angiogenesis as determined by computerised image analysis and the risk of early relapse in women with invasive ductal breast carcinoma. Pol J Pathol. 2003;54(1):53-59.
- Niemisto A, Dunmire V, Yli-Harja O, Zhang W, Shmulevich I. Analysis of angiogenesis using in vitro experiments and stochastic growth models. Phys Rev E Stat Nonlin Soft Matter Phys. 2005;72(6 Pt 1):062902.
pubmed - Blacher S, Devy L, Hlushchuk R, Larger E, Lamandn N, Burri P, Corvol P,
et al . Quantification of angiogenesis in the chicken chorioallantoic membrane (CAM). Image Anal Stereol. 2005;24:169-180. - Goddard J, Sutton C, Furness P, Kockelbergh R, O'Byrne K. A computer image analysis system for microvessel density measurement in solid tumours. Angiogenesis. 2002;5(1):15-20.
- Goddard JC, Sutton CD, Furness PN, O'Byrne KJ, Kockelbergh RC. Microvessel density at presentation predicts subsequent muscle invasion in superficial bladder cancer. Clin Cancer Res. 2003;9(7):2583-2586.
pubmed - Deans GT, Williamson K, Hamilton P, Heatley M, Arthurs K, Patterson CC, Rowlands BJ,
et al . DNA densitometry of colorectal cancer. Gut. 1993;34(11):1566-1571.
pubmed - Moscone EA, Baranyi M, Ebert I, Greilhuber J, Ehrendorfer F, Hunziker AT. Analysis of nuclear DNA content in Capsicum (Solanaceae) by flow cytometry and Feulgen densitometry. Ann Bot (Lond). 2003;92(1):21-29.
pubmed - Williams RA, Charlton IG, Howat AJ. Image analysis DNA densitometry measurements on complete and partial hydatidiform mole and nonmolar products of conception. Int J Gynecol Pathol. 1995;14(4):300-305.
pubmed - Yoshii Y, Saito A, Nose T. Nuclear morphometry and DNA densitometry of human gliomas by image analysis. J Neurooncol. 1995;26(1):1-9.
pubmed - Forsslund G, Kreicbergs A, Nilsson B, Zetterberg A. Photographic densitometry for quantitative DNA analysis of cytologic and histologic specimens. Anal Quant Cytol Histol. 1992;14(2):153-160.
pubmed - Freeman SE, Thompson BD. Quantitation of ultraviolet radiation-induced cyclobutyl pyrimidine dimers in DNA by video and photographic densitometry. Anal Biochem. 1990;186(2):222-228.
pubmed - Freeman SE, Thompson BD. Evaluation of densitometry data using interactive computer graphics: application to DNA agarose gels. Int J Biomed Comput. 1988;22(2):121-133.
pubmed - Sklarew RJ. Simultaneous Feulgen densitometry and autoradiographic grain counting with the Quantimet 720D image-analysis system. I. Estimation of nuclear DNA content in 3H-thymidine-labeled cells. J Histochem Cytochem. 1982;30(1):35-48.
pubmed - van der Ploeg M, van Duijn P, Ploem JS. High-resolution scanning-densitometry of photographic negatives of human metaphase chromosomes. II. Feulgen-DNA measurements. Histochemistry. 1974;42(1):31-46.
pubmed - Hardie D, Gregory T, Hebert P. From pixels to picograms: a beginners' guide to genome quantification by Feulgen image analysis densitometry. Journal of Histochemistry and Cytochemistry. 2002;50(6):735.
- Ecker RC, de Martin, Steiner GE, Schmid JA. Application of spectral imaging microscopy in cytomics and fluorescence resonance energy transfer (FRET) analysis. Cytometry A. 2004;59(2):172-181.
pubmed - Kahn E, Menetrier F, Vejux A, Montange T, Dumas D, Riedinger JM, Frouin F,
et al . Flow cytometry and spectral imaging multiphoton microscopy analysis of CD36 expression with quantum dots 605 of untreated and 7-ketocholesterol-treated human monocytic cells. Anal Quant Cytol Histol. 2006;28(6):316-330.
pubmed - Rodríguez R, Castillo P, Guerra V, Suáre A, Izquierdo E. Two Robust Techniques for Segmentation of Biomedical Images. Computación y Sistemas. 9(4):355-369.
This is an open-access article distributed under the terms of the Creative Commons Attribution License, which permits unrestricted use, distribution, and reproduction in any medium, provided the original work is properly cited.
Journal of Clinical Medicine Research is published by Elmer Press Inc.