

| Journal of Clinical Medicine Research, ISSN 1918-3003 print, 1918-3011 online, Open Access |
| Article copyright, the authors; Journal compilation copyright, J Clin Med Res and Elmer Press Inc |
| Journal website https://www.jocmr.org |
Original Article
Volume 16, Number 5, May 2024, pages 220-231

Association of Small Airway Functional Indices With Respiratory Symptoms and Comorbidity in Asthmatics: A National Cross-Sectional Study
Jia Wei Longa ![]() , Yong Liang Jianga, b
, Yong Liang Jianga, b
aDepartment of Respiratory Medicine, Hunan Provincial People’s Hospital, The First Affiliated Hospital of Hunan Normal University, Changsha, China
bCorresponding Author: Yong Liang Jiang, Department of Respiratory Medicine, Hunan Provincial People’s Hospital, The First Affiliated Hospital of Hunan Normal University, Changsha, China
Manuscript submitted March 18, 2024, accepted May 20, 2024, published online May 29, 2024
Short title: Small Airway Indices and Respiratory Health in Asthma
doi: https://doi.org/10.14740/jocmr5158
| Abstract | ▴Top |
Background: Small airway dysfunction (SAD) and airway inflammation are vital in asthma exacerbations. Type 2 inflammation (T2), mediated by cytokines from T helper 2 cell (Th2) such as interleukin (IL)-4, IL-5, and IL-13, is a potential mechanism underlying SAD. Research on small airway function in asthma is limited. We aimed to explore the correlation between small airway function and respiratory symptoms and comorbidity in T2 and non-T2 asthma.
Methods: Derived from the National Health and Nutrition Examination Survey (NHANES), our study encompassed 2,420 asthma patients aged 6 - 79 years, including pulmonary function (PF) data such as forced expiratory flow between 25% and 75% of forced vital capacity (FEF25-75), forced expiratory volume in 1 second (FEV1), forced expiratory volume in 3 seconds (FEV3), forced expiratory volume in 6 seconds (FEV6), and forced vital capacity (FVC). To evaluate the small airway function, we calculated z-scores for FEF25-75, FEF25-75/FVC, FEV1/FEV6, and FEV3/FEV6. Logistic regression determined the adjusted odds ratios (aORs) for symptoms and comorbidity.
Results: FEF25-75, FEV1/FEV6, and FEV3/FEV6 correlated with asthmatic symptoms. FEF25-75 had the strongest association with wheezing or whistling attacks. An increase of 1 standard deviations (SD) in FEF25-75 reduced recurrent wheezing (aOR: 0.70; 95% confidence intervals (95% CIs): 0.65 - 0.76) and severe attacks (aOR: 0.67; 95% CI: 0.62 - 0.94). These indices were also linked to dry cough and hay fever, particularly FEV3/FEV6 reducing hay fever risk (aOR: 0.70; 95% CI: 0.55 - 0.91) in non-T2 asthma. FEF25-75/FVC related to persistent (aOR: 0.78; 95% CI: 0.72 - 0.84) and severe attacks (aOR: 1.14; 95% CI: 1.08 - 1.22) in non-T2 groups. Lower indices combined with T2 exposure raised severe attack risk.
Conclusions: In this nationwide study, small airway function correlated with symptom onset, especially in T2 asthma. Small airway injury differed between T2 and non-T2 asthma. Prospective research is needed to establish reference values.
Keywords: Asthma classification; Asthma prevention and control; NHANES; Pulmonary function test; Small airway remodeling
| Introduction | ▴Top |
Asthma, a chronic respiratory disease characterized by wheezing, coughing, and breathlessness, often leads to persistent exacerbations. These exacerbations are primarily attributed to declining pulmonary function (PF) and an increased need for emergency medical care [1]. Chronic inflammation affects all parts of the bronchial system, potentially leading to structural changes in the airways, known as airway remodeling [2]. Once happened in small airways, those with inner diameters smaller than 2 mm cause narrowing and obstruction of the air passages, a condition referred to as small airway dysfunction (SAD) [3].
In clinical practice, spirometry, which includes parameters like forced expiratory volume in 1 second as present of predicted (FEV1% predicted) or forced expiratory volume in 1 second/forced vital capacity (FEV1/FVC), is commonly used to assess airway obstruction in pulmonary disease patients. However, recent research suggests that normal values of FEV1% predicted or FEV1/FVC may not adequately predict respiratory symptoms or the risk of airway obstruction [4-6]. This underscores the need for a better understanding and evaluation of airway obstruction. Researchers have explored various measures within conventional PF testing to SAD and its clinical implications, including forced expiratory flow between 25% and 75% of forced vital capacity (FEF25-75), forced expiratory flow between 25% and 75% of forced vital capacity/forced vital capacity (FEF25-75/FVC), forced expiratory volume in 1 second/forced expiratory volume in 3 seconds (FEV1/FEV3), and forced expiratory volume in 3 seconds/forced expiratory volume in 6 seconds (FEV3/FEV6) [5, 7, 8]. Another significant characteristic of asthma is airway inflammation. Type 2 inflammation (T2) is primarily mediated by T helper 2 cell (Th2), type 2 innate lymphoid cell (ILC2), and related cytokines. It is characterized by the secretion of specific interleukin (IL), such as IL-4, IL-5, and IL-13, along with increased levels of blood or sputum eosinophils, elevated fractional exhaled nitric oxide (FeNO), and higher levels of specific immunoglobulin (Ig) E [9, 10]. With the presence of T2, asthma is consequently classified into two phenotypes: T2/T2-high asthma and non-T2/T2-low asthma, and approximately half of individuals with mild to moderate asthma exhibit T2 characteristics [11]. Nevertheless, limited research has delved into the differing effects on airway impairment between T2 and non-T2 asthma.
To bridge these knowledge gaps, our objective was to examine the relationship between small airway functional indices and the presence of symptoms or comorbidity (such as hay fever) in individuals with asthma. National Health and Nutrition Examination Survey (NHANES) is a survey conducted in the United States that examines various health and nutrition indices in children and adults. In this cross-sectional analysis, we utilized data from NHANES spanning from 2007 to 2012. Our hypothesis posits that target indices (FEF25-75, FEF25-75/FVC, FEV1/FEV6, FEV3/FEV6) are correlated with an increased risk of symptoms and comorbidity among asthma patients. Additionally, we explored whether individuals exhibiting T2 characteristics might incur an elevated level of risk.
| Materials and Methods | ▴Top |
Our study adhered to STROBE principles [12], as illustrated in Figure 1.
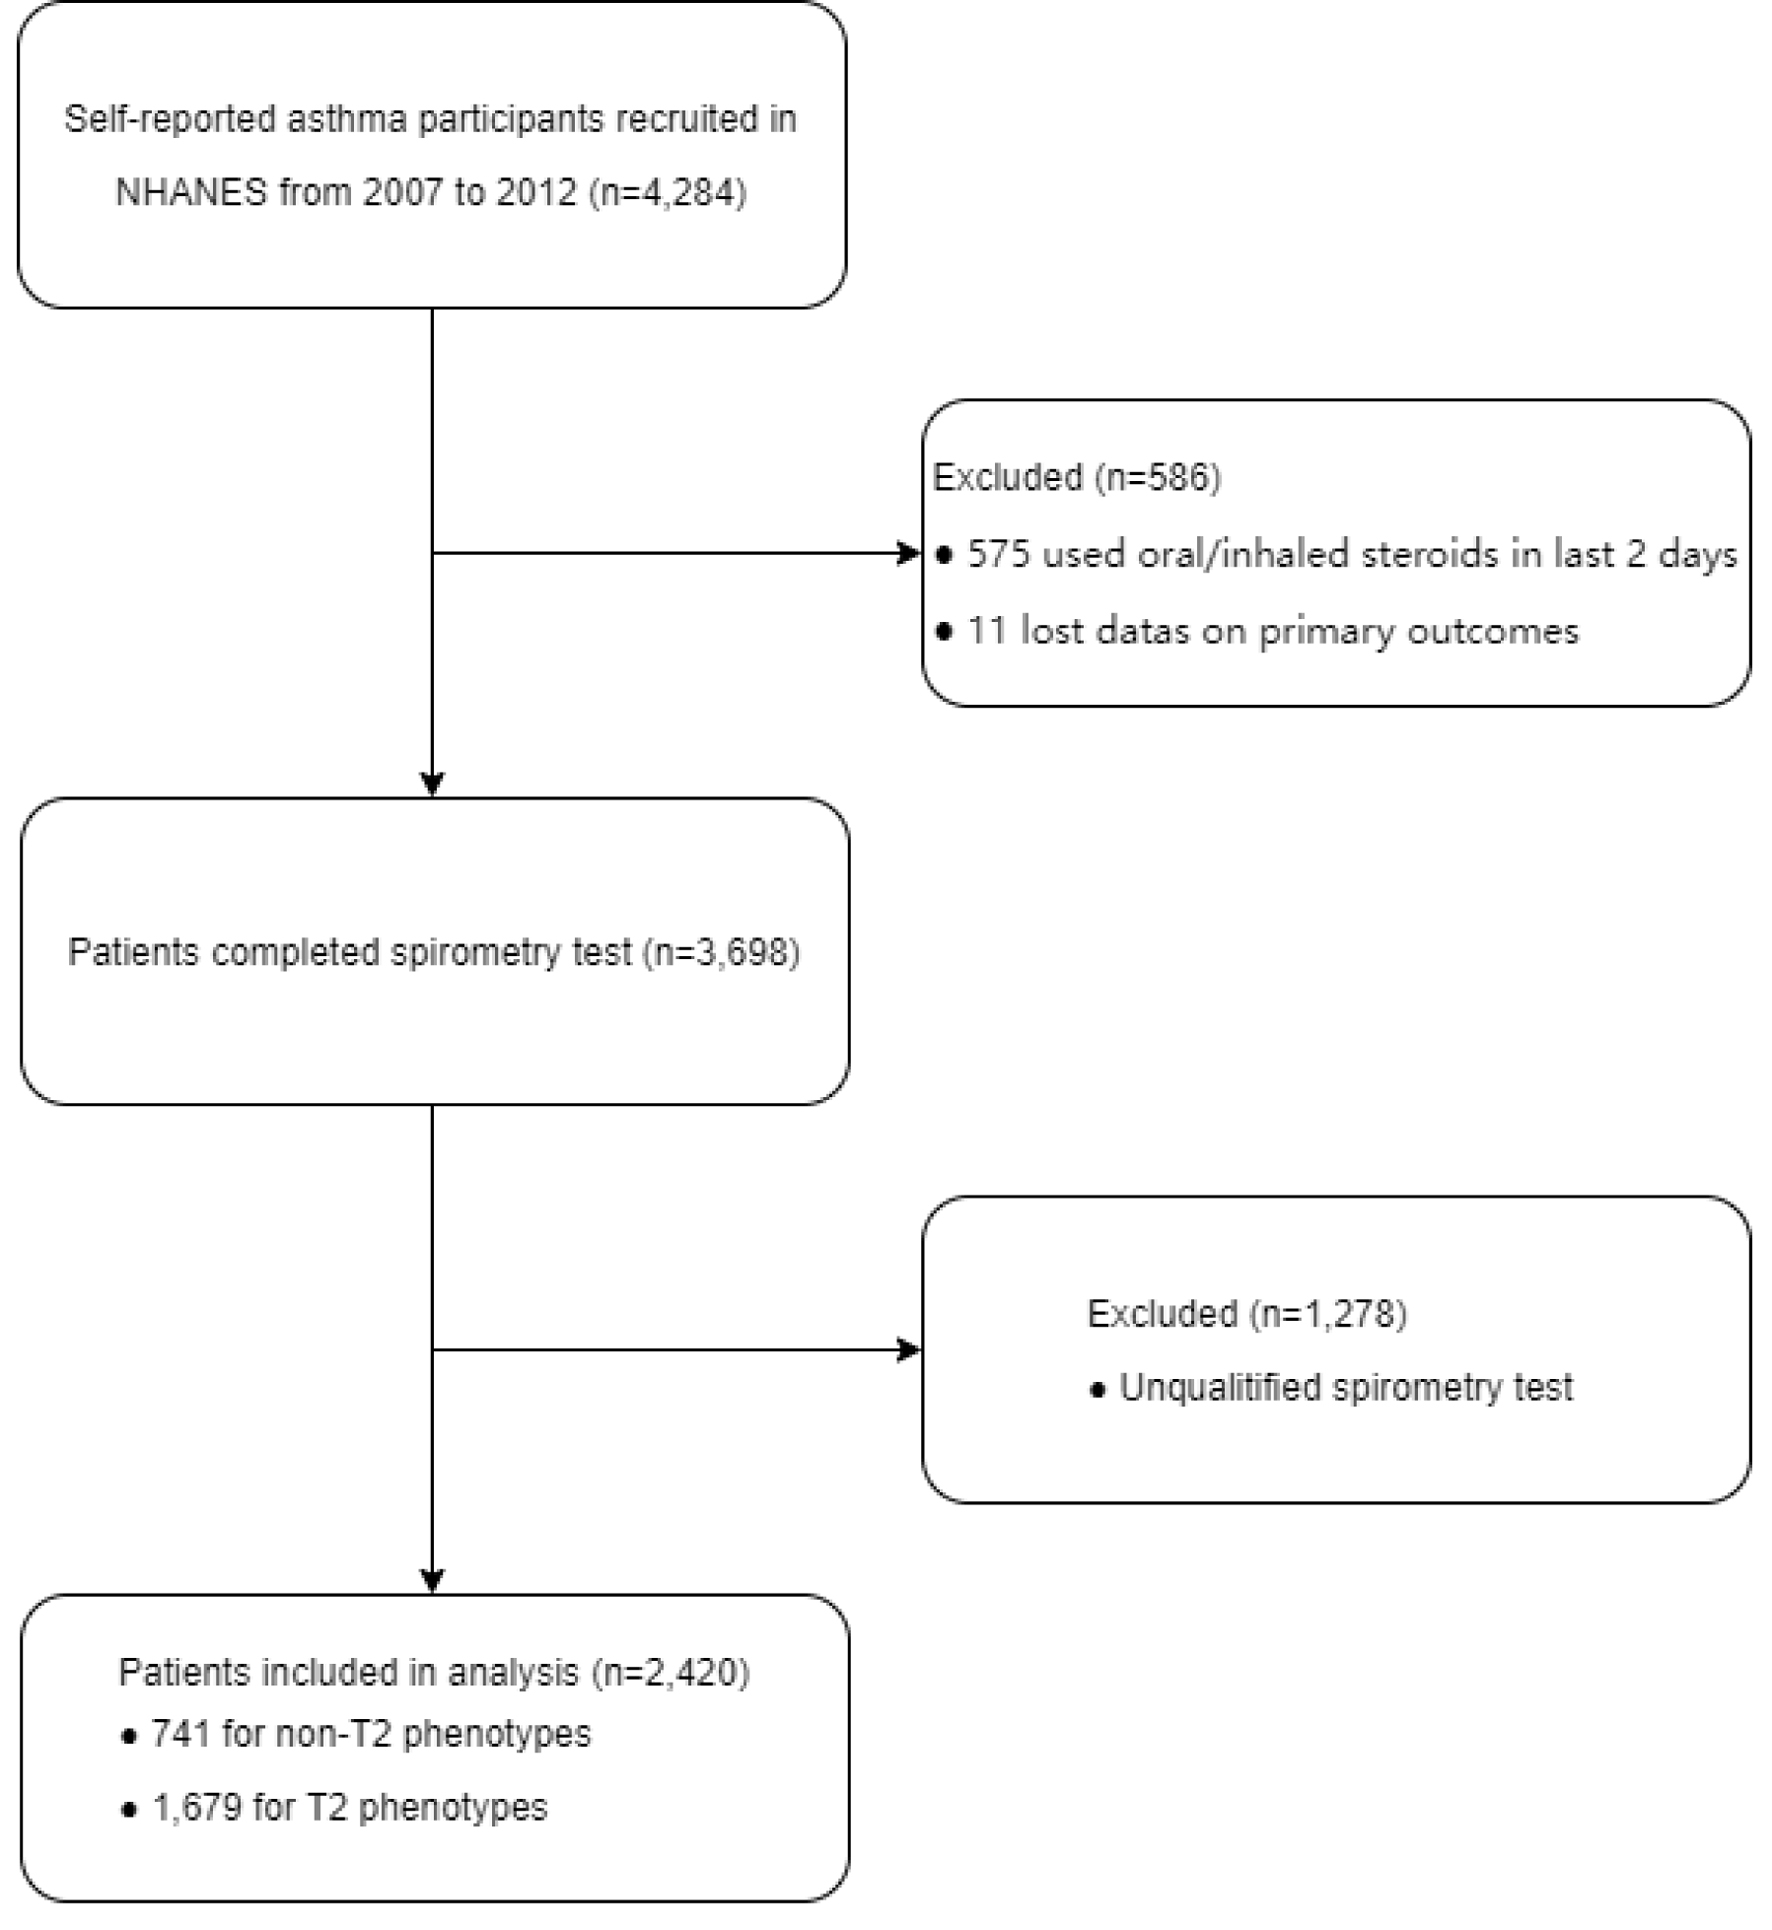 Click for large image | Figure 1. Flowchart of the sample selection. |
Subjects
Initially, a total of 4,284 asthma patients were identified from the NHANES dataset spanning from 2007 to 2012. All baseline and laboratory data, along with questionnaire information, were extracted from the NHANES 2007 - 2012 cohort via CDC.gov. Our primary inclusion criteria for subjects were as follows: age 6 years and older, no current oral corticosteroids (OCS) or inhaled corticosteroids (ICS) treatment (according to the NHANES survey variable ENQ090 “Used oral or inhaled steroids, 2 days?”), and self-reported asthma status based on variables such as MCQ010 “Ever been told you have asthma?”, MCQ040 “Had asthma attack in past year?”, and MCQ051 “Dr. prescribed medication for asthma?”. Major exclusion criteria, including missing outcome data, missing spirometry data, and unqualified spirometry data, were also applied. The final sample consisted of 2,420 asthma patients aged 6 to 79 years, including 741 non-T2 asthmatics and 1,679 T2 asthmatics.
Institutional Review Board approval
The protocol was approved by the National Center for Health Statistics Research Ethics Review Board.
Ethical compliance with human study
The NCHS Ethics Review Board has approved NHANES cycles 2007 - 2008 (Continuation of Protocol #2005-06), NHANES cycles 2009 - 2010 (Continuation of Protocol #2005-06), and NHANES cycles 2011 - 2012 (Protocol #2011-17). Detailed information can be found at [13].
Data acquisition
All clinical data followed were collected at the Mobile Exam Center (MEC) in the NHANES database. A total of 2,420 eligible participants from 2007 to 2012 underwent PF testing in the MEC mobile examination center. Spirometer operation was taken using the Ohio 822/827 dry-rolling seal volume spirometer. And PF testing was met the standards set by the American Thoracic Society (ATS) in 2005 [14]. Conventional PF was measured using pre-bronchodilator spirometry, including FEV1, FEV3, FEV6, FVC, and FEF25-75. Based on these variables, additional small airway functional indices were calculated, including FEV1/FEV6, FEV3/FEV6, and FEF25-75/FVC. To assess the variability of these indices, we compared the coefficient of variation (CV) between spirometry and additional small airway functional indices. The quality of spirometry data was evaluated using the variable SPXNQEFF “Baseline Effort Quality Attribute”. PF data were considered valid if they exceeded the “C” grade. To account for the impact of impaired large airways, a pre-bronchodilator FEV1/FVC ratio of less than 0.70 was used to define an obstructive spirometry pattern. We also used the NHANES III reference equation to calculate the FEV1% predicted for each participant [15]. Therefore, normal spirometry was defined as an FEV1 predicted value > 80%. To evaluate the association between small airway indices and respiratory symptoms or comorbidity, all indices were converted into z-scores, and target indices were divided into tertiles to assess their interaction effects with T2 exposure.
The T2 characteristics were defined according to the Global Initiative for Asthma (GINA) 2023 as follows [9]: blood eosinophil counts (BECs, obtained from variable LBDEONO) ≥ 150/µL or FeNO levels (obtained from variables ENXMEAN, ENXTR1Q, ENXTR2Q, ENXTR3Q, ENXTR4Q) ≥ 20 ppb.
Outcome definitions
Primary outcomes were defined as wheezing/whistling attacks ≥ 3 times [16, 17], seeking emergency medical care for wheezing/whistling ≥ 1 time, experiencing nocturnal dry cough, and having a hay fever episode in the past 12 months.
Covariates
Potential confounding variables were selected based on previous research and included [18]: age, gender, race, body mass index (BMI), education, poverty index, smoking status, family history of asthma, and early onset of asthma. Demographic and health condition data were extracted from the NHANES household questionnaire, with a responsible adult interviewed for participants under 16 years of age. BMI groups were categorized as underweight/normal range (< 18.5), normal (18.5 - 24.9), overweight (25.0 - 29.9), and obese (≥ 30.0). Smoking exposure was determined by assessing smoking history and recent nicotine product usage. Personal economic condition was evaluated using the “INDFMPIR” variable, indicating an individual’s ratio of income to family income, with specific cut-offs for classification. Participants were considered exposed to smoke if they answered “yes” to variables SMQ020 (“Smoked at least 100 cigarettes in life”) or SMQ040 (“Do you now smoke cigarettes”) or if they had used nicotine products in the past 5 days. Participants were categorized as having early-onset asthma if they experienced their first asthma attack at age ≤ 12. A history of asthma in close relatives was defined by variable MCQ300b (“Close relative had asthma?”). Covariates were included in the analysis only if they showed significance in univariate analysis (P < 0.05) and had P < 0.20 in the final model.
Statistics
These analyses were initially conducted among all participants and subsequently among different T2 phenotype subjects. Descriptive statistics such as mean, standard deviation (SD), or 95% confidence interval (95% CI) were reported for continuous variables, while numbers and percentages were provided for categorical variables. Multivariate logistic models were employed to estimate the association between small airway functional indices and the risk of respiratory symptoms and comorbidity.
Data analysis was conducted using SAS version 9.4, with a two-sided test, and statistical significance was considered at P-value < 0.05. After adjusting baseline data of participants with the weighting variable WTMEC2YR, significance testing was based on the Chi-square test for categorical variables and the analysis of variance (ANOVA) test for continuous variables to examine the differences in data between T2 and non-T2 asthma participants. The results were obtained using procedures including PROC SURVEYFREQ, PROC SURVEYMEANS, PROC SURVEYREG, and PROC SURVEYLOGISTIC, taking into account the complex sampling design.
To compare variability between conventional PF measures (FEV1, FEV3, FEF25-75) and additional indices (FEV1/FEV6, FEV3/FEV6, FEF25-75/FVC), the CV was calculated for each, and an asymptotic test (R-package: cvequality) was utilized [19]. Finally, the relative excess risk of interaction (RERI) and P-values for interaction were calculated to assess whether T2 participants were at a higher risk of the specified outcomes.
| Results | ▴Top |
Baseline data of eligible participants
Following the exclusion criteria, a total of 2,420 participants were included in our analysis (Fig. 1), with 741 categorized into the non-T2 group and 1,679 into the T2 group (Table 1). When weighted by sampling weights, 45.7% of the participants were male, while 54.3% were female. The eligible participants had an average age of 33.5 years (95% CI: 32.4 - 34.6). The majority of asthmatic patients in the study were either overweight or obese.
 Click to view | Table 1. Baseline Characteristics of Asthmatics Stratified by T2 Phenotype: NHANES 2007 - 2012 |
Among the T2 group participants, 862 (55.2% of the T2 group) exhibited abnormal FeNO levels, and 1,440 (85.5% of the T2 group) had elevated BEC. Only 623 individuals (23.6% of the T2 group) displayed both of these two laboratory characteristics. In comparison to the non-T2 asthmatics, T2 participants tended to be older, had a higher average body weight, and showed a more balanced gender distribution. Although there was no significant difference in the incidence of respiratory symptoms between these two groups, participants with T2 exposure were more likely to experience episodes of hay fever.
Additionally, 200 subjects (6.49% of all subjects) had missing data for covariates, which were imputed using the mode-filling method.
Comparison of conventional PF with paired indices
In Table 1, we computed the mean, SD, and CV for each index, while Table 2 illustrates the comparison between conventional PF measurements (FEV1, FEV3, FEF25-75) and additional indices (FEV1/FEV6, FEV3/FEV6, FEF25-75/FVC). Stratifying the data by T2 phenotype, it becomes evident that the extra small airway functional indices (FEV1/FEV6, FEV3/FEV6, FEF25-75/FVC) exhibited significant differences between the T2 and non-T2 groups, whereas conventional indices did not demonstrate such distinctions. Specifically, when considering FEF25-75 as a conventional index for small airways, no significant difference was observed between the groups.
Click to view | Table 2. Overview of Main Indices From Participants |
A more detailed examination of Table 3 revealed that the extra airway functional indices consistently displayed significantly lower CV values than the conventional indices across all subjects. Importantly, this pattern persisted even when subjects were grouped by T2 phenotype. In summary, these findings suggest that the extra small airway functional indices exhibit superior variability and are more likely to be influenced by T2 exposure compared to conventional PF indices.
Click to view | Table 3. Overview of CV for Unadjusted and Adjusted Indices |
Association of target indices with outcomes in all subjects
In Table 4, we standardized the small airway functional indices to z-scores and conducted multivariate logistic regression models to evaluate the individual associations of the target indices (FEV1/FEV6, FEV3/FEV6, FEF25-75, FEF25-75/FVC) with various outcomes. In terms of symptom control, our results revealed that FEF25-75 and FEV3/FEV6 were inversely associated with the risk of frequent wheezing/whistling attacks, severe wheezing/whistling attacks, and nocturnal dry cough. Notably, there was also a significant association between reduced FEV1/FEV6 and an increased risk of recurrent wheezing/whistling attacks or dry cough at night.
Click to view | Table 4. Overview of aORs for Outcomes and Target Indices |
Among the various small airway indices examined in all subjects, FEF25-75 demonstrated the strongest associations with all outcomes. Specifically, a 1-SD increment in FEF25-75 was associated with an aOR of 0.70 (95% CI: 0.65 - 0.76) for recurrent wheezing/whistling attacks, an aOR of 0.67 (95% CI: 0.62 - 0.73) for severe wheezing/whistling attacks, and an aOR of 0.71 (95% CI; 0.60 - 0.85) for dry cough at night.
However, there was no evidence of an association between small airway functional indices and the occurrence of hay fever episodes. Even after adjusting for FVC, FEF25-75/FVC did not exhibit significant associations with symptoms or comorbidity compared to FEF25-75. Further analyses were conducted in other subject groups, and these findings remained robust even after excluding individuals with impaired FEV1 (FEV1% predicted < 0.80) or obstructive spirometry (FEV1/FVC < 0.70).
Target indices trends in T2/non-T2 groups and their association with outcomes
An intriguing pattern emerges when considering T2 exposure (Table 5). In relation to asthmatic symptoms, all target indices including FEV1/FEV6, FEV3/FEV6, FEF25-75, and FEF25-75/FVC remained significantly associated with symptoms in the T2 group, while this association was not observed in the non-T2 group. Particularly noteworthy is the superior performance of FEF25-75, which exhibited significant associations with severe wheezing/whistling (aOR: 0.57; 95% CI: 0.48 - 0.68) and dry cough (aOR: 0.71; 95% CI: 0.59 - 0.86), and FEV3/FEV6, which showed a significant association with recurrent wheezing/whistling (aOR: 0.73; 95% CI: 0.70 - 0.77) in T2 subjects.
Click to view | Table 5. aORs of Outcomes Stratified by T2 Exposure |
In contrast, within the non-T2 group, the relationships between outcomes and FEV1/FEV6 or FEF25-75/FVC showed opposite trends for persistence and severity (Table 5). Both FEF25-75/FVC and FEV1/FEV6 exhibited significant positive associations with severe wheezing/whistling in non-T2 individuals, which contrasted with their associations with recurrent wheezing/whistling. For example, with a 1-SD increment in FEV1/FEV6, the aOR was 0.76 (95% CI: 0.65 - 0.88) for recurrent wheezing/whistling and 1.12 (95% CI: 1.04 - 1.21) for severe wheezing/whistling, while for FEF25-75/FVC, the aOR was 0.78 (95% CI: 0.72 - 0.84) for recurrent wheezing/whistling and 1.14 (95% CI: 1.08 - 1.22) for severe wheezing/whistling. Only FEF25-75 remained significantly associated with clinical outcomes in the non-T2 group. Furthermore, none of the small airway functional indices were found to be associated with hay fever, except for FEV3/FEV6 (aOR: 0.70; 95% CI: 0.55 - 0.91). Remaining details are presented in the specified subgroups within Table 5.
Interaction between T2 exposure and target indices
To explore whether the association between reduced small airway functional indices and outcomes differed based on T2 exposure, we divided participants into high and low index groups based on their tertile values for target indices (Table 6). We conducted both additive and multiplicative interaction analyses.
Click to view | Table 6. Interactions Between Target Indices and T2 Exposure in the Risk of Outcome |
Additive interactions were assessed by calculating RERI, as presented in Table 6. The evidence suggests that T2 exposure increases the additional risk of severe wheezing/whistling attacks in individuals with lower FEF25-75 (RERI: 0.93; 95% CI: 0.70 - 1.16), lower FEF25-75/FVC (RERI: 0.71; 95% CI: 0.24 - 1.18), or lower FEV1/FEV6 (RERI: 0.87; 95% CI: 0.62 - 1.13). Conversely, there was a significant negative interaction between lower FEF25-75 and T2 exposure in the risk of recurrent wheezing/whistling attacks.
Regarding allergic diseases such as hay fever, participants who reported lower FEF25-75/FVC, FEV1/FEV6, or FEV3/FEV6 had an additive risk when exposed to T2. For the remaining data, the additive interaction was only significant among individuals with lower FEV1/FEV6 for the risk of dry cough. These findings underscore the complex interplay between small airway functional indices and T2 exposure in influencing asthmatic symptoms and comorbidity.
| Discussion | ▴Top |
Key findings and explanation
To assess the influence of SAD on the onset of asthma symptoms and comorbidity, we developed an analytical model incorporating small airway functional indices like FEV1/FEV6, FEV3/FEV6, FEF25-75, and FEF25-75/FVC. Our aim was to compare the linear trends and effectiveness of each index. Our study initially confirmed that many of the targeted indices significantly outperformed conventional PF tests in terms of variability. Considering that demographic factors can affect PF measurements, social economic factors, family history, and asthma characteristics can influence asthma control, and smoking can affect both, we chose age, gender, race, BMI, education, poverty index, smoking status, family history of asthma, and early onset of asthma as covariates for model adjustment [15, 18, 20]. This collectively emphasizes that lower values of small airway function indices are linked to a higher risk of asthma symptom onset, with FEF25-75 possibly holding the highest predictive value.
Our research found no significant differences in symptom onset or exacerbation between the two asthma phenotypes. However, there were statistically significant differences in target indices (FEV1/FEV6, FEV3/FEV6, FEF25-75/FVC) among different groups of asthmatic patients, suggesting varying degrees of small airway impairment through distinct inflammatory activation pathways. Furthermore, subgroup analyses based on T2 exposure revealed that small airway functional indices tend to be protective factors in T2 asthma groups, with lower values associated with a higher risk of respiratory symptoms. Conversely, the associations and aORs for symptom outcomes were weaker and less significant in non-T2 asthmatics. Notably, FEV1/FEV6 and FEF25-75/FVC acted as protective factors against severe wheezing/whistling attacks in T2 asthma patients but as risk factors in non-T2 populations. One possible explanation for this finding is that an increase in FEF25-75/FVC may be accompanied by a decrease in FVC, influenced by specified mechanisms, leading to an escalated risk of severe wheezing/whistling attacks in non-T2 asthma patients, a phenomenon not observed in T2 asthma patients [21]. Similarly, this also suggested that changes in FEV1 and FEV6 are influenced by airway remodeling through distinct mechanisms in these two subgroups.
Additionally, we evaluated the additional risk in subjects exposed to T2 and possessing a low value of the targeted indices. We calculated the RERI to assess the additive risk of T2 exposure on symptoms or comorbidity. Our findings demonstrated a significant risk for severe wheezing/whistling attacks due to the additive interaction between lower target indices (FEV1/FEV6, FEV3/FEV6, FEF25-75, FEF25-75/FVC) and T2 exposure.
Comparison with similar researches
Small airways, those with inner diameters smaller than 2 mm, constitute a significant portion of lung volume. Persistent inflammation can lead to pathological changes in these small airways, causing narrowing and obstruction of the air passages, a condition referred to as SAD. SAD is commonly associated with chronic obstructive pulmonary disease and asthma [3]. Although various tests like impulse oscillometry (IOS), single breath nitrogen washout (SBNW), multiple breath nitrogen washout (MBNW), body plethysmography, laboratory tests, and imaging examinations have been developed to assess small airway function [22], there is still a lack of a straightforward and practical measure for this purpose.
Due to the continued need for a practical and effective method to assess small airway function, researchers have explored various measures within conventional PF to evaluate SAD and its clinical implications. For instance, parameters like FEF25-75 and FEF25-75/FVC have shown associations with airway hyper-responsiveness (AHR) and may demonstrate changes earlier than larger airway indices like FEV1% predicted and FEV1/FVC [5, 23]. Siroux et al demonstrated that a decline in FEF25-75 was associated with adverse outcome in asthma, indicating a subsequent risk for uncontrolled asthma, a risk that persisted even after adjusting for FEV1% predicted over a decade [24]. FEF25-75/FVC, representing the ratio between airway size and lung size, was adjusted by FVC and proved to be more stable compared to FEF25-75 [8, 23]. Additionally, FEV6 offers the advantage of a shorter test time, better repeatability than FVC, and ease of follow-up [25]. Consequently, emerging indicators based on FEV3 and FEV6, such as FEV1/FEV6 and FEV3/FEV6, have been explored for diagnosing airflow obstruction in various cohorts [7, 26]. Previous studies have validated the indices’ ability to suggest SAD through consistency with IOS and responsiveness to acetylcholine [27, 28]. Alobaidi et al believe that FEF25-75 is an early indicator of small airway damage in COPD [29]. Almeshari et al recommend using the standardized value of FEF25-75 to reflect SAD [30]. Thus, we hypothesized that these four indices could serve as potential indicators for assessing SAD and evaluating symptom control in asthma patients. And our findings accord with previous research indicating that FEF25-75, FEV1/FEV6, and FEV3/FEV6 are associated with symptom onset among asthma participants.
Asthma is a heterogeneous and genetically predisposed disease characterized by airway inflammation and AHR. It is commonly triggered by allergens, resulting in variable airflow limitation and, with repeated exposure, structural changes in the airways known as airway remodeling [2]. Prior research on PF has largely lacked parameters for assessing small airway function in asthmatics. Since FEV1% predicted and FEV1/FVC change only when large airways are affected and remodeled [31], researchers have started examining the clinical relevance of more sensitive parameters in relation to respiratory health. This study bridges this gap, demonstrating that small airway functional indices (FEF1/FEV6, FEV3/FEV6, FEF25-75) are associated with past symptoms in asthma patients, with lower values of these markers being negatively correlated with the risk of symptom onset. Among these indices, FEF25-75 demonstrated the strongest association with the risk of asthmatic symptoms (frequent wheezing/whistling, increased wheezing/whistling, dry cough at night). Moreover, the additional indices (FEV1/FEV6, FEV3/FEV6, FEF25-75/FVC) that adjusted for FEV6 or FVC as denominators exhibited better variability than traditional PF measures.
Moreover, T2 is characterized by an excessive type 2 immune response, and also plays a pivotal role in the onset, progression, and development of asthma. This response involves the activation of Th2 and ILC2, triggering cytokines like IL-4, IL-5, and IL-13. These cytokines elevate IgE production, prompt eosinophil proliferation and aggregation, increase FeNO production, and simultaneously modify inflammation and impact lung function [10, 11]. In contrast, non-T2 asthma lacks eosinophilic inflammation characteristics. It further divides into neutrophilic and granulocytic types, where cells and cytokines such as Th1, Th17, IL-6, and IL-17 participate in its pathogenesis. Severe cases even involve neutrophil extracellular traps (NETs) [32]. Asthma is consequently classified into two phenotypes: T2/T2-high asthma and non-T2/T2-low asthma [33]. Recent research has primarily focused on airway impairment and efficacy of inhibitors related to cytokines in these two phenotypes [4, 10, 34]. A long-term study revealed that asthmatics with high eosinophil variability experienced a faster decline in FEV1 compared to those without eosinophilic characteristics [34]. Regarding symptom control, Hector et al demonstrated that severe eosinophilic asthma patients who experienced three or more exacerbation episodes in the past year had decreased lung function, emphasizing the association between exacerbation frequency and PF decline [16]. Although there is evidence indicating no significant difference in acute exacerbation between T2-high asthma and T2-low asthma [35], limited research has compared small airway function between T2 and non-T2 asthmatics.
As GINA provides criteria for diagnosing type 2 asthma based on biomarkers such as BEC and FeNO [9], and previous studies have examined the stability of BEC and FeNO as markers for persistent T2 status [35], our research focuses on assessing the impairment of small airway functional indices and symptom control in these two groups. Our findings reveal significant differences in additional small airway functional indices (FEV1/FEV6, FEV3/FEV6, FEF25-75/FVC) between T2 and non-T2 asthmatics, highlighting the additional risk of symptom onset associated with T2 exposure for patients. This area of study has been relatively underexplored, making our findings valuable.
Limitations
We acknowledge several limitations in our research. First, we only included asthma patients rather than all participants with available pulmonary function data, potentially leading to a lack of control and reference for target indices. Additionally, asthma diagnosis relied on a questionnaire rather than following the standards of GINA, ATS or the European Respiratory Society (ERS), which lacked objective clinical evidence. We also considered factors impacting PF and FeNO, but the exclusion of current ICS/OCS usage introduced unavoidable selection bias, potentially resulting in the omission of severe and uncontrolled asthmatics. Additionally, although we selected the PF measurements taken before the inhalation of β2 agonists, NHANES does not have data on whether patients had recently used long-acting β2 agonists. This could also potentially affect the lung function measurements. Using a symptom-based assessment may not fully reflect the overall status of long-term asthma control, and some asthmatics may not manifest wheezing or whistling, such as those with cough-variant asthma (CVA). Furthermore, it would be more insightful to evaluate outcomes using a rating system like the asthma control test (ACT) or the asthma control questionnaire (ACQ). Moreover, the classification of T2 is a subject of debate. On the one hand, long-term OCS use can suppress inflammation, while on the other hand, these two phenotypes can overlap and intermingle [9, 36]. Unfortunately, we were unable to explore strong association between SAD and allergic diseases in asthmatics, such as hay fever. Moreover, our study, based on NHANES, was subject to recall bias, and we cannot infer causation between SAD and symptom control. It is also worth noting that the ATS guideline does not support the direct use of FEF25-75 for identifying SAD. Therefore, when our study is validated in the real world, it can additionally explore the relationship between the ratios of FEF25-75, forced expiratory flow at 50% of forced vital capacity (FEF50), and forced expiratory flow at 75% of forced vital capacity (FEF75) to their normal predicted values with SAD and asthma control [37]. To establish causal relationships, future research should involve extensive cohort studies.
Strength of findings
This study highlights the potential benefits of monitoring these indices for patients with T2 asthma. Our study demonstrates that declines in small airway functional indices are associated with symptom onset and exacerbation in asthma patients. Nonetheless, further research is needed to uncover the mechanisms of small airway damage in these two distinct asthma phenotypes through prospective studies involving real-world data. This study was conducted using a vast national cross-sectional database encompassing a significant number of both T2 and non-T2 asthmatic individuals. This enabled us to analyze the distinct effects of small airway damage in these two phenotypes. Our focus on monitoring small airway functional indices serves as a noninvasive and practical approach for asthma management, particularly within T2 groups.
Conclusions
In conclusion, our study established that declines in small airway functional indices are linked to symptom onset and exacerbation in asthma. Given the stability of these target indices, monitoring small airway function can benefit symptom assessment in T2 asthma patients. Nevertheless, questions remain about how small airways are damaged through different inflammatory mechanisms in the two asthma phenotypes. Future work should involve enrolling participants and conducting long-term follow-ups to verify the extent of damage and the pathological mechanisms among these two phenotypes in real-world prospective studies.
Acknowledgments
We appreciate the NHANES databases for the availability of the data.
Financial Disclosure
This work was supported by the National Natural Science Foundation of China (82070057), the Natural Science Foundation of Hunan Province (2021JJ30400), the National Key Research and Development Program of China (2018YFC2002000), the Novel Coronavirus Pneumonia Emergency Project of the Hunan Provincial Science and Technology Department (2020SK3018). The authors would like to thank the National Center for Health Statistics (NCHS) for the availability of NHANES database.
Conflict of Interest
The authors declare no conflict of interest.
Informed Consent
All NHANES participants or their guardians have given informed consent. Informed consent from all participants was obtained as outlined in https://www.cdc.gov/nchs/nhanes/genetics/genetic_participants.htm.
Author Contributions
Jia Wei Long and Yong Liang Jiang created the idea for the paper. Jia Wei Long performed the collection and assembly, performed the analysis, wrote the manuscript, and prepared the figures. Yong Liang Jiang edited and revised the manuscript. All authors read and approved the final manuscript.
Data Availability
All data can be accessed and downloaded from the NHANES database at http://www.cdc.gov/nchs/nhanes.htm.
Abbreviations
ACQ: asthma control questionnaire; ACT: asthma control test; AHR: airway hyper-responsiveness; aOR: adjusted odds ratio; ATS: American Thoracic Society; BECs: blood eosinophil counts; BMI: body mass index; CV: coefficient of variation; CVA: cough-variant asthma; ERS: European Respiratory Society; FEF25-75: forced expiratory flow between 25% and 75% of forced vital capacity; FEF50: forced expiratory flow at 50% of forced vital capacity; FEF75: forced expiratory flow at 75% of forced vital capacity; FEF25-75/FVC: forced expiratory flow between 25% and 75% of forced vital capacity/forced vital capacity; FEV1: forced expiratory volume in 1 second; FEV1% predicted: forced expiratory volume in 1 second as present of predicted; FEV1/FEV3: forced expiratory volume in 1 second/forced expiratory volume in 3 seconds; FEV1/FVC: forced expiratory volume in 1 second/forced vital capacity; FEV3: forced expiratory volume in 3 seconds; FEV3/FEV6: forced expiratory volume in 3 seconds/forced expiratory volume in 6 seconds; FEV6: forced expiratory volume in 6 seconds; FVC: forced vital capacity; FeNO: fractional exhaled nitric oxide; GINA: Global Initiative for Asthma; ICS: inhaled corticosteroids; IL: interleukin; ILC2: type 2 innate lymphoid cell; IOS: impulse oscillometry; Ig: immunoglobulin; MBNW: multiple breath nitrogen washout; MEC: Mobile Exam Center; NETs: neutrophil extracellular traps; NHANES: National Health and Nutrition Examination Survey; OCS: oral corticosteroids; PF: pulmonary function; RERI: relative excess risk of interaction; SAD: small airway dysfunction; SBNW: single breath nitrogen washout; SD: standard deviation; T2: type 2 inflammation; Th2: T helper 2 cell
| References | ▴Top |
- Soremekun S, Heaney LG, Skinner D, Bulathsinhala L, Carter V, Chaudhry I, Hosseini N, et al. Asthma exacerbations are associated with a decline in lung function: a longitudinal population-based study. Thorax. 2023;78(7):643-652.
doi pubmed pmc - Hirota N, Martin JG. Mechanisms of airway remodeling. Chest. 2013;144(3):1026-1032.
doi pubmed - Bonini M, Usmani OS. The role of the small airways in the pathophysiology of asthma and chronic obstructive pulmonary disease. Ther Adv Respir Dis. 2015;9(6):281-293.
doi pubmed - Bao W, Tian X, Hao H, Jin Y, Xie X, Yin D, Zhang Y, et al. Is small airway dysfunction an abnormal phenomenon for patients with normal forced expiratory volume in 1 second and the ratio of forced expiratory volume in 1 second to forced vital capacity? Ann Allergy Asthma Immunol. 2022;128(1):68-77.e61.
doi pubmed - Qin R, An J, Xie J, Huang R, Xie Y, He L, Xv H, et al. FEF(25-75)% is a more sensitive measure reflecting airway dysfunction in patients with asthma: a comparison study using FEF(25-75)% and FEV(1). J Allergy Clin Immunol Pract. 2021;9(10):3649-3659.e3646.
doi pubmed - Higbee DH, Granell R, Davey Smith G, Dodd JW. Prevalence, risk factors, and clinical implications of preserved ratio impaired spirometry: a UK Biobank cohort analysis. Lancet Respir Med. 2022;10(2):149-157.
doi pubmed - Hansen JE, Porszasz J, Casaburi R, Stringer WW. Re-defining lower limit of normal for FEV(1)/FEV(6), FEV(1)/FVC, FEV(3)/FEV(6) and FEV(3)/FVC to improve detection of airway obstruction. Chronic Obstr Pulm Dis. 2015;2(2):94-102.
doi pubmed pmc - Cox CA, Vonk JM, Kerstjens HAM, van den Berge M, Ten Hacken NHT. Predicted values for the forced expiratory flow adjusted for forced vital capacity, a descriptive study. ERJ Open Res. 2020;6(4):00426-2020.
doi pubmed pmc - Global Initiative for Asthma. Global Strategy for Asthma Management and Prevention version 2023. https://ginasthma.org/2023-gina-main-report/.
- Scott G, Asrat S, Allinne J, Keat Lim W, Nagashima K, Birchard D, Srivatsan S, et al. IL-4 and IL-13, not eosinophils, drive type 2 airway inflammation, remodeling and lung function decline. Cytokine. 2023;162:156091.
doi pubmed - Fahy JV. Type 2 inflammation in asthma - present in most, absent in many. Nat Rev Immunol. 2015;15(1):57-65.
doi pubmed pmc - Vandenbroucke JP, von Elm E, Altman DG, Gotzsche PC, Mulrow CD, Pocock SJ, Poole C, et al. Strengthening the Reporting of Observational Studies in Epidemiology (STROBE): explanation and elaboration. PLoS Med. 2007;4(10):e297.
doi pubmed pmc - https://www.cdc.gov/nchs/nhanes/irba98.htm.
- Miller MR, Hankinson J, Brusasco V, Burgos F, Casaburi R, Coates A, Crapo R, et al. Standardisation of spirometry. Eur Respir J. 2005;26(2):319-338.
doi pubmed - Hankinson JL, Odencrantz JR, Fedan KB. Spirometric reference values from a sample of the general U.S. population. Am J Respir Crit Care Med. 1999;159(1):179-187.
doi pubmed - Ortega H, Yancey SW, Keene ON, Gunsoy NB, Albers FC, Howarth PH. Asthma exacerbations associated with lung function decline in patients with severe eosinophilic asthma. J Allergy Clin Immunol Pract. 2018;6(3):980-986.e981.
doi pubmed - Lawson JA, Rennie DC, Cockcroft DW, Dyck R, Afanasieva A, Oluwole O, Afsana J. Childhood asthma, asthma severity indicators, and related conditions along an urban-rural gradient: a cross-sectional study. BMC Pulm Med. 2017;17(1):4.
doi pubmed pmc - Turrin M, Rizzo M, Bonato M, Bazzan E, Cosio MG, Semenzato U, Saetta M, et al. Differences between early- and late-onset asthma: role of comorbidities in symptom control. J Allergy Clin Immunol Pract. 2022;10(12):3196-3203.
doi pubmed - Marwick B, Krishnamoorthy K. cvequality: tests for the equality of coefficients of variation from multiple groups. https://github.com/benmarwick/cvequality.
- Lee LK, Ramakrishnan K, Safioti G, Ariely R, Schatz M. Asthma control is associated with economic outcomes, work productivity and health-related quality of life in patients with asthma. BMJ Open Respir Res. 2020;7(1):e000534.
doi pubmed pmc - Huang Y, Zhang S, Fang X, Qin L, Fan Y, Ding D, Liu X, et al. Plasma miR-199a-5p is increased in neutrophilic phenotype asthma patients and negatively correlated with pulmonary function. PLoS One. 2018;13(3):e0193502.
doi pubmed pmc - Cottini M, Licini A, Lombardi C, Bagnasco D, Comberiati P, Berti A. Small airway dysfunction and poor asthma control: a dangerous liaison. Clin Mol Allergy. 2021;19(1):7.
doi pubmed pmc - Parker AL, Abu-Hijleh M, McCool FD. Ratio between forced expiratory flow between 25% and 75% of vital capacity and FVC is a determinant of airway reactivity and sensitivity to methacholine. Chest. 2003;124(1):63-69.
doi pubmed - Siroux V, Boudier A, Dolgopoloff M, Chanoine S, Bousquet J, Gormand F, Just J, et al. Forced midexpiratory flow between 25% and 75% of forced vital capacity is associated with long-term persistence of asthma and poor asthma outcomes. J Allergy Clin Immunol. 2016;137(6):1709-1716.e1706.
doi pubmed - Bellia V, Sorino C, Catalano F, Augugliaro G, Scichilone N, Pistelli R, Pedone C, et al. Validation of FEV6 in the elderly: correlates of performance and repeatability. Thorax. 2008;63(1):60-66.
doi pubmed - Perez-Padilla R, Wehrmeister FC, Celli BR, Lopez-Varela MV, Montes de Oca M, Muino A, Talamo C, et al. Reliability of FEV1/FEV6 to diagnose airflow obstruction compared with FEV1/FVC: the PLATINO longitudinal study. PLoS One. 2013;8(8):e67960.
doi pubmed pmc - Liu Y, Zhang L, Li HL, Liang BM, Wang J, Zhang X, Chen ZH, et al. Small airway dysfunction in asthma is associated with perceived respiratory symptoms, non-type 2 airway inflammation, and poor responses to therapy. Respiration. 2021;100(8):767-779.
doi pubmed - Pisi R, Aiello M, Frizzelli A, Feci D, Aredano I, Manari G, Calzetta L, et al. Detection of small airway dysfunction in asthmatic patients by spirometry and impulse oscillometry system. Respiration. 2023;102(7):487-494.
doi pubmed pmc - Alobaidi NY, Almeshari M, Stockley J, Stockley RA, Sapey E. Small airway function measured using forced expiratory flow between 25% and 75% of vital capacity and its relationship to airflow limitation in symptomatic ever-smokers: a cross-sectional study. BMJ Open Respir Res. 2022;9(1):e001385.
doi pubmed pmc - Almeshari MA, Alobaidi NY, Sapey E, Stockley RA, Stockley JA. Small airways dysfunction: the importance of utilising Z-scores to define MMEF abnormalities in clinical practice. Heliyon. 2023;9(10):e20744.
doi pubmed pmc - Diaz AA, Rahaghi FN, Ross JC, Harmouche R, Tschirren J, San Jose Estepar R, Washko GR, et al. Understanding the contribution of native tracheobronchial structure to lung function: CT assessment of airway morphology in never smokers. Respir Res. 2015;16(1):23.
doi pubmed pmc - Hudey SN, Ledford DK, Cardet JC. Mechanisms of non-type 2 asthma. Curr Opin Immunol. 2020;66:123-128.
doi pubmed pmc - Ricciardolo FLM, Carriero V, Bertolini F. Which therapy for non-type(T)2/T2-low asthma. J Pers Med. 2021;12(1):10.
doi pubmed pmc - Newby C, Agbetile J, Hargadon B, Monteiro W, Green R, Pavord I, Brightling C, et al. Lung function decline and variable airway inflammatory pattern: longitudinal analysis of severe asthma. J Allergy Clin Immunol. 2014;134(2):287-294.
doi pubmed - Viinanen A, Aakko J, Lassenius MI, Telg G, Nieminen K, Kaijala S, Lehtimaki L, et al. Type 2 low biomarker stability and exacerbations in severe uncontrolled asthma. Biomolecules. 2023;13(7):1118.
doi pubmed pmc - Han YY, Zhang X, Wang J, Wang G, Oliver BG, Zhang HP, Kang Y, et al. Multidimensional assessment of asthma identifies clinically relevant phenotype overlap: a cross-sectional study. J Allergy Clin Immunol Pract. 2021;9(1):349-362.e318.
doi pubmed - Zhao N, Wu F, Peng J, Zheng Y, Tian H, Yang H, Deng Z, et al. Preserved ratio impaired spirometry is associated with small airway dysfunction and reduced total lung capacity. Respir Res. 2022;23(1):298.
doi pubmed pmc
This article is distributed under the terms of the Creative Commons Attribution Non-Commercial 4.0 International License, which permits unrestricted non-commercial use, distribution, and reproduction in any medium, provided the original work is properly cited.
Journal of Clinical Medicine Research is published by Elmer Press Inc.