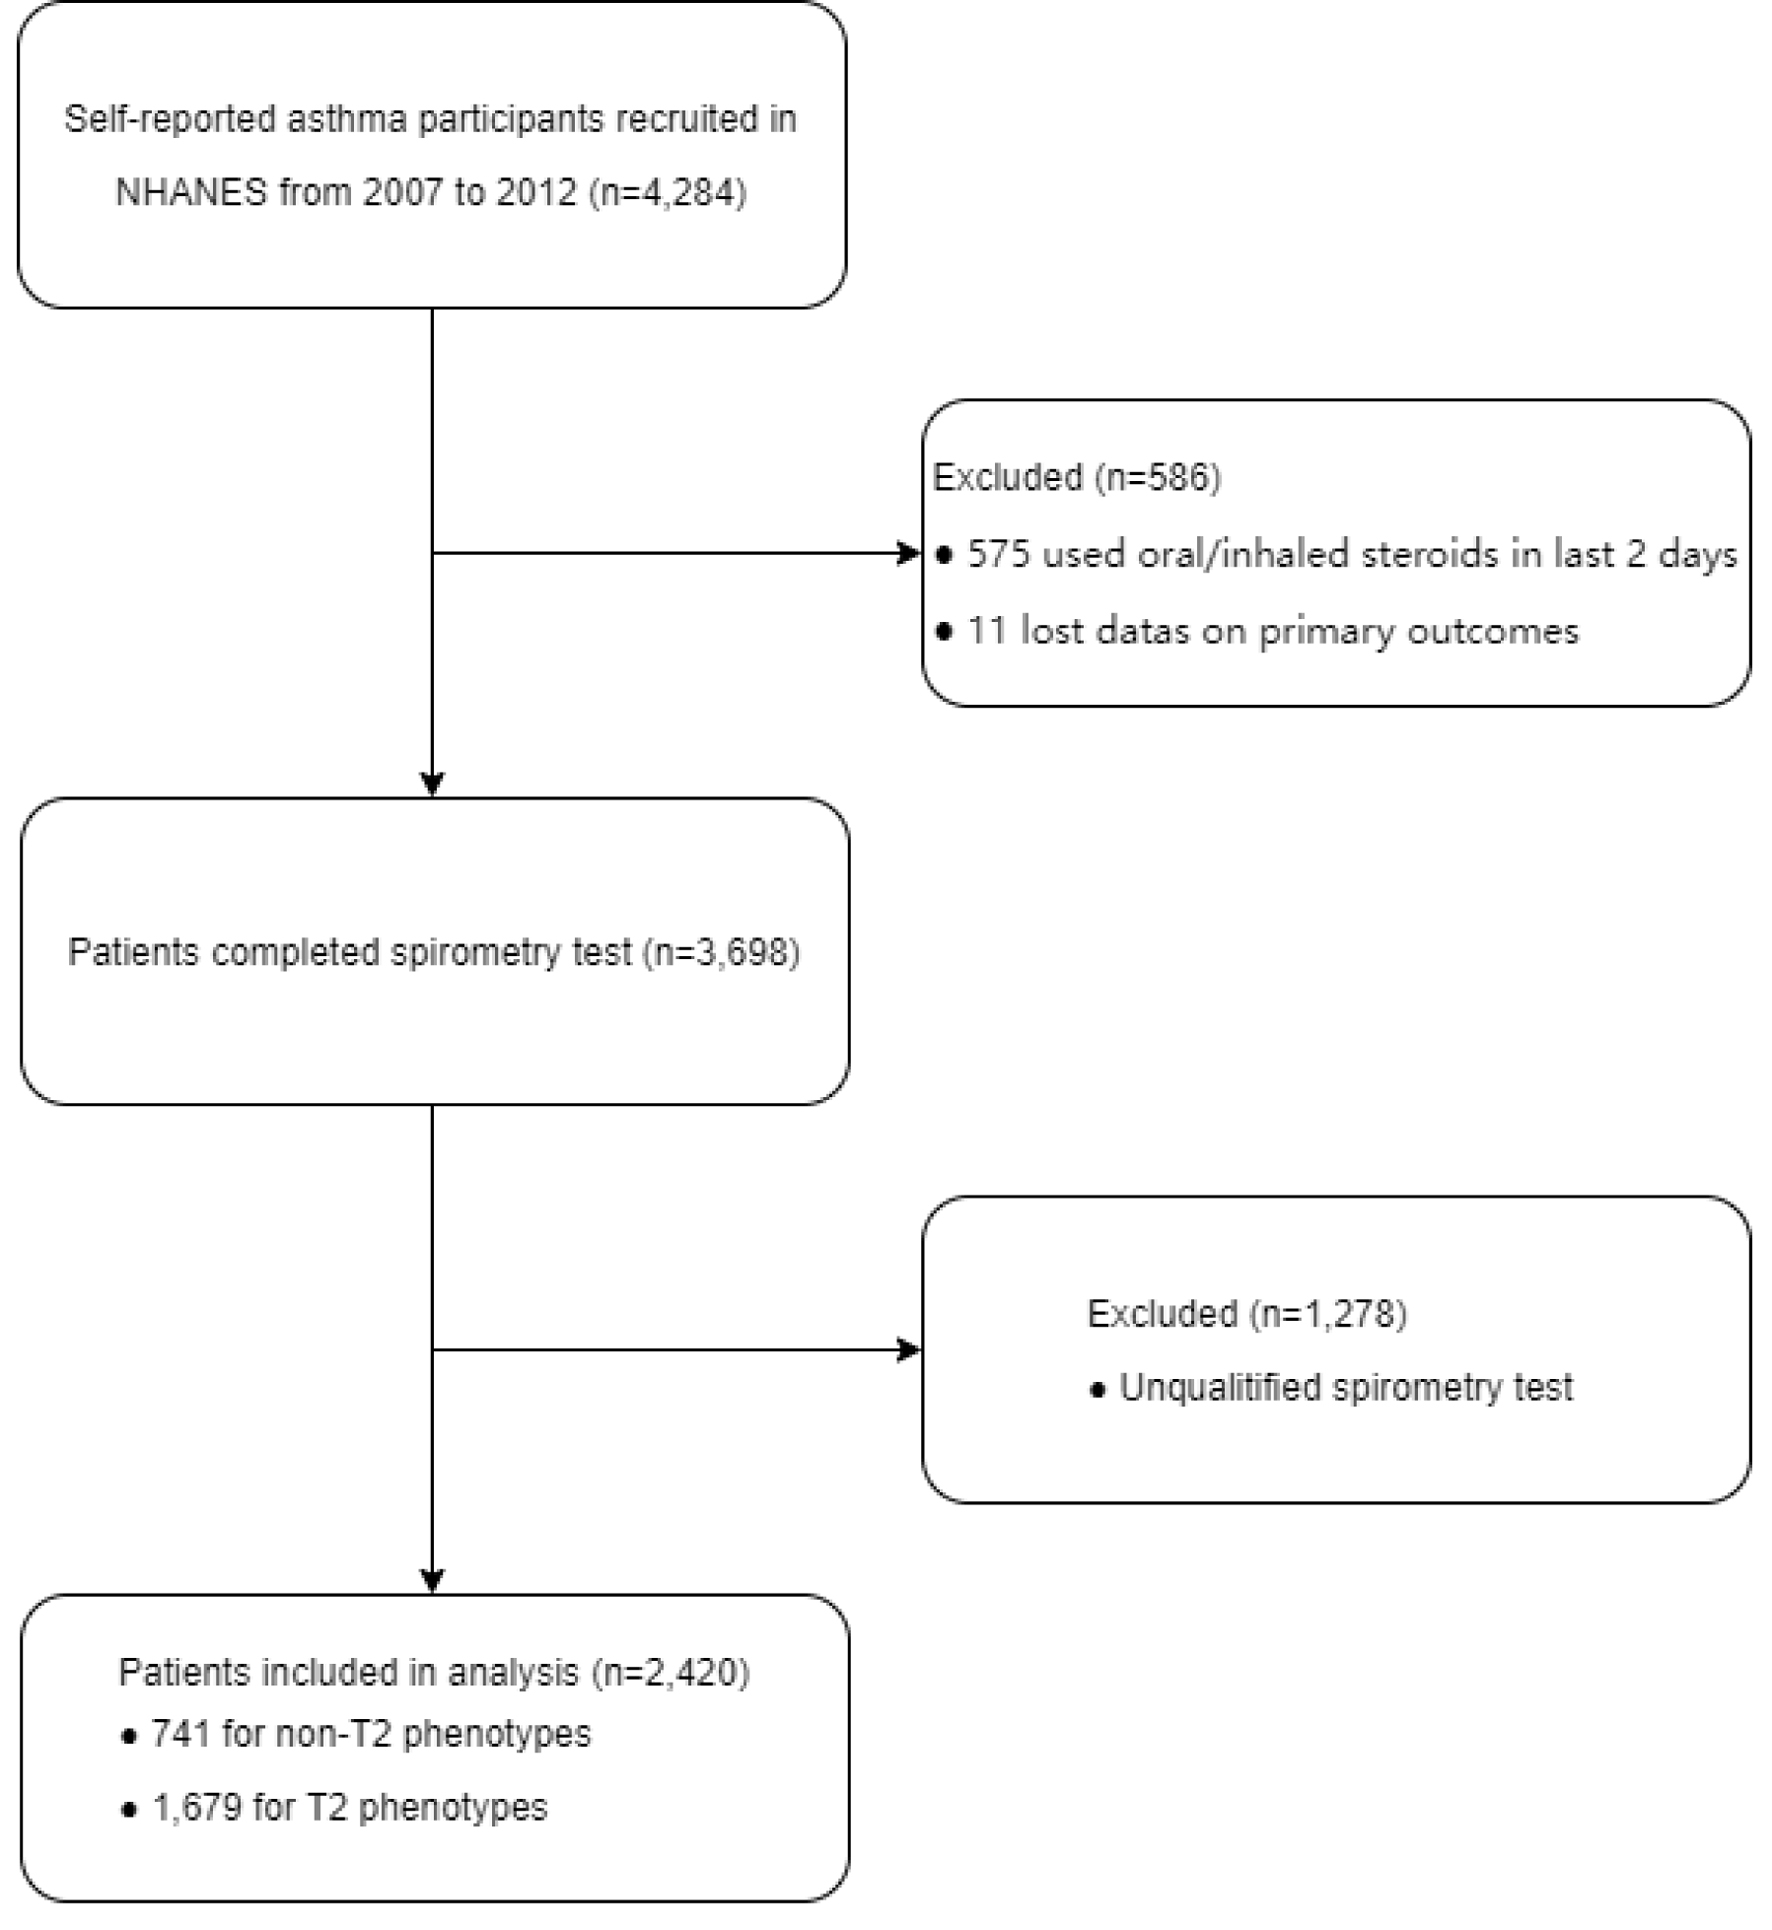
Figure 1. Flowchart of the sample selection.
| Journal of Clinical Medicine Research, ISSN 1918-3003 print, 1918-3011 online, Open Access |
| Article copyright, the authors; Journal compilation copyright, J Clin Med Res and Elmer Press Inc |
| Journal website https://www.jocmr.org |
Original Article
Volume 16, Number 5, May 2024, pages 220-231
Association of Small Airway Functional Indices With Respiratory Symptoms and Comorbidity in Asthmatics: A National Cross-Sectional Study
Figure
Tables
| Baseline characteristics | All (N = 2,420) | T2 exposure | P-valuea | |
|---|---|---|---|---|
| Yes (n = 1,679) | No (n = 741) | |||
| aP-value is identified by ANOVA test for continuous variables and Chi-square test for categorical variables and stratified by T2 and non-T2 exposure. ANOVA: analysis of variance; BEC: blood eosinophil count; BMI: body mass index; CI: confidence interval; NHANES: National Health and Nutrition Examination Survey; FeNO: fractional exhaled nitric oxide. | ||||
| Demographic characteristic | ||||
| Age, mean (95% CI), years | 33.5 (32.4, 34.6) | 34.0 (32.9, 35.2) | 32.3 (30.3, 34.2) | 0.0315 |
| Female sex, n (%) | 1,229 (54.3) | 782 (49.8) | 447 (64.4) | < 0.0001 |
| BMI group, n (%) | ||||
| Underweight/normal | 1,110 (41.7) | 729 (38.8) | 381 (48.1) | 0.0180 |
| Overweight | 552 (25.6) | 397 (26.5) | 155 (23.6) | |
| Obesity | 758 (32.7) | 553 (34.7) | 205 (28.3) | |
| Ethnicity, n (%) | ||||
| Mexican American | 302 (6.6) | 202 (6.3) | 100 (7.3) | 0.1829 |
| Other Hispanic | 259 (5.6) | 187 (5.8) | 72 (5.1) | |
| Non-Hispanic White | 957 (66.4) | 672 (67.4) | 285 (64.2) | |
| Non-Hispanic Black | 683 (14.8) | 456 (13.8) | 227 (17.0) | |
| Other race | 219 (6.6) | 162 (6.7) | 57 (6.4) | |
| Poverty, n (%) | ||||
| 0.0 - 1.0 | 872 (24.6) | 574 (23.1) | 298 (28.1) | 0.0648 |
| 1.1 - 3.0 | 848 (32.6) | 598 (32.5) | 250 (32.7) | |
| > 3.0 | 700 (42.8) | 507 (44.4) | 193 (39.2) | |
| Education, n (%) | ||||
| Less than 12th grade | 1,223 (36.7) | 847 (36.6) | 376 (36.8) | 0.9376 |
| High school/GED | 353 (16.3) | 242 (16.2) | 111 (16.4) | |
| Some college or AA | 533 (26.2) | 369 (25.9) | 164 (27.1) | |
| College or above | 311 (20.8) | 221 (21.3) | 90 (19.7) | |
| Personal history | ||||
| Smoking exposure, n (%) | ||||
| No | 1,625 (62.1) | 1,110 (61.4) | 515 (63.7) | 0.4345 |
| Yes | 795 (37.9) | 569 (38.6) | 226 (36.3) | |
| Early-onset asthma, n (%) | ||||
| No | 729 (35.55) | 503 (36.0) | 226 (34.5) | 0.5379 |
| Yes | 1,691 (64.45) | 1,176 (64.0) | 515 (65.5) | |
| Family history of asthma, n (%) | ||||
| No | 1,310 (58.4) | 482 (62.5) | 828 (55.9) | 0.1997 |
| Yes | 1,110 (41.6) | 313 (37.5) | 797 (44.1) | |
| Accessory examination | ||||
| BEC ≥ 150/µL, n (%) | 1,440 (59.0) | 1,440 (85.5) | - | - |
| FeNO ≥ 20 ppb, n (%) | 862 (38.8) | 862 (55.2) | - | - |
| Clinical outcome | ||||
| Recurrent wheezing/whistling, n (%) | 458 (18.1) | 336 (19.4) | 122 (15.3) | 0.0588 |
| Severe wheezing/whistling, n (%) | 306 (15.1) | 297 (16.0) | 99 (13.2) | 0.1577 |
| Dry cough, n (%) | 219 (8.0) | 154 (8.5) | 65 (7.0) | 0.3447 |
| Hay fever, n (%) | 548 (28.6) | 359 (29.0) | 189 (28.0) | 0.6983 |
| Indicea | All groups (N = 2,420) | T2 exposure (n = 1,679) | Non-T2 exposure (n = 741) | P-valueb |
|---|---|---|---|---|
| aData are presented as mean (SD). bP-value was identified by ANOVA test for continuous variables and associated with T2 inflammation and non-T2 exposure. ANOVA: analysis of variance; FEF25-75: forced expiratory flow between 25% and 75% of forced vital capacity; FEV1: forced expiratory volume in 1 second; FEV3: forced expiratory volume in 3 seconds; FEV6: forced expiratory volume in 6 seconds; FVC: forced vital capacity; SD: standard deviation. | ||||
| FEV1, L | 3.06 (0.98) | 3.08 (0.98) | 3.02 (0.99) | 0.1573 |
| FEV1/FEV6, % | 81.0 (7.09) | 80.6 (7.03) | 81.9 (7.11) | < 0.0001 |
| FEV3, L | 3.64 (1.15) | 3.67 (1.15) | 3.56 (1.15) | 0.027 |
| FEV3/FEV6, % | 95.9 (3.32) | 95.7 (3.14) | 96.3 (3.67) | < 0.0001 |
| FEF25-75, L/s | 2.89 (1.31) | 2.86 (1.27) | 2.97 (1.38) | 0.0572 |
| FEF25-75/FVC, /s | 0.75 (0.28) | 0.74 (0.27) | 0.80 (0.28) | < 0.0001 |
| Subjects | CV, % | Adjusted CVa, % | P-valueb |
|---|---|---|---|
| aFEV1 and FEV3 are adjusted by FEV6, and FEF25-75 is adjusted by FVC. bP-value is identified by an asymptotic test between conventional and paired indices. CV: coefficient of variation; FEF25-75: forced expiratory flow between 25% and 75% of forced vital capacity; FEV1: forced expiratory volume in 1 second; FEV3: forced expiratory volume in 3 seconds; FEV6: forced expiratory volume in 6 seconds; FVC: forced vital capacity. | |||
| All groups | |||
| FEV1 | 32.0 | 8.8 | < 0.0001 |
| FEV3 | 31.7 | 3.5 | < 0.0001 |
| FEF25-75 | 45.1 | 36.6 | 7.89 × 10⁻¹⁹ |
| T2 exposure | |||
| FEV1 | 31.7 | 8.7 | < 0.0001 |
| FEV3 | 31.4 | 3.3 | < 0.0001 |
| FEF25-75 | 44.5 | 36.7 | 8.80 × 10⁻¹² |
| Non-T2 exposure | |||
| FEV1 | 32.8 | 8.7 | 6.97 × 10-202 |
| FEV3 | 32.3 | 3.8 | < 0.0001 |
| FEF25-75 | 46.4 | 35.8 | 1.31 × 10⁻⁹ |
| Target indices | N | SD | Recurrent wheezing | Severe attack | Dry cough | Hay fever | ||||
|---|---|---|---|---|---|---|---|---|---|---|
| aORa | P-value | aORb | P-value | aORc | P-value | aORd | P-value | |||
| aORs are associated with per 1 SD unit increase in target indices. aModel is adjusted for age, gender, BMI group, ethnicity, smoking exposure. bModel is adjusted for age, gender, BMI group, education, smoking exposure, early-onset, family history. cModel is adjusted for age, gender, poverty, smoking exposure, early-onset. dModel is adjusted for age, ethnicity, poverty, education, early-onset. aOR: adjusted odds ratio; FEF25-75: forced expiratory flow between 25% and 75% of forced vital capacity; FEV1: forced expiratory volume in 1 second; FEV3: forced expiratory volume in 3 seconds; FEV6: forced expiratory volume in 6 seconds; FVC: forced vital capacity; SD: standard deviation. | ||||||||||
| All subjects | 2,420 | |||||||||
| FEV1/FEV6, % | 7.09 | 0.76 (0.71, 0.81) | < 0.0001 | 0.89 (0.81, 0.96) | 0.0049 | 0.90 (0.87, 0.92) | < 0.0001 | 1.02 (0.87, 1.19) | 0.8300 | |
| FEV3/FEV6, % | 3.32 | 0.73 (0.68, 0.78) | < 0.0001 | 0.76 (0.62, 0.94) | 0.0125 | 0.80 (0.73, 0.87) | < 0.0001 | 0.90 (0.80, 1.02) | 0.0885 | |
| FEF25-75, L/s | 1.31 | 0.70 (0.65, 0.76) | < 0.0001 | 0.67 (0.62, 0.73) | 0.0086 | 0.71 (0.60, 0.85) | 0.0001 | 0.93 (0.83, 1.04) | 0.1735 | |
| FEF25-75/FVC, /s | 0.28 | 0.80 (0.74, 0.86) | < 0.0001 | 0.94 (0.84, 1.04) | 0.2158 | 0.94 (0.87, 1.01) | 0.0873 | 0.99 (0.82, 1.19) | 0.8875 | |
| Subjects with FEV1/FVC ≥ 0.70 | 2,114 | |||||||||
| FEV1/FEV6, % | 5.42 | 0.84 (0.75, 0.96) | 0.0072 | 0.85 (0.74, 0.97) | 0.0168 | 0.92 (0.85, 0.99) | 0.0326 | 0.99 (0.94, 1.03) | 0.5452 | |
| FEV3/FEV6, % | 2.74 | 0.81 (0.76, 0.85) | < 0.0001 | 0.81 (0.76, 0.85) | < 0.0001 | 0.83 (0.77, 0.88) | < 0.0001 | 0.86 (0.75, 0.99) | 0.0346 | |
| FEF25-75, L/s | 1.22 | 0.76 (0.66, 0.87) | 0.0001 | 0.76 (0.71, 0.82) | < 0.0001 | 0.66 (0.62, 0.72) | < 0.0001 | 0.71 (0.59, 0.86) | 0.0003 | |
| FEF25-75/FVC, /s | 0.24 | 0.90 (0.79, 1.02) | 0.0914 | 0.90 (0.79, 1.03) | 0.1314 | 0.95 (0.88, 1.02) | 0.1589 | 1.00 (0.89, 1.12) | 0.9888 | |
| Subjects with FEV1% predicted > 0.80 | 2,034 | |||||||||
| FEV1/FEV6, % | 6.10 | 0.78 (0.73, 0.83) | < 0.0001 | 0.78 (0.74, 0.83) | < 0.0001 | 0.90 (0.84, 0.97) | 0.0049 | 0.94 (0.84, 1.06) | 0.3226 | |
| FEV3/FEV6, % | 2.70 | 0.78 (0.71, 0.84) | < 0.0001 | 0.78 (0.71, 0.86) | < 0.0001 | 0.80 (0.67, 0.95) | 0.0125 | 0.79 (0.66, 0.94) | 0.0084 | |
| FEF25-75, L/s | 1.24 | 0.76 (0.70, 0.81) | < 0.0001 | 0.80 (0.77, 0.83) | < 0.0001 | 0.69 (0.64, 0.74) | <0.0001 | 0.73 (0.69, 0.77) | < 0.0001 | |
| FEF25-75/FVC, /s | 0.25 | 0.81 (0.75, 0.87) | < 0.0001 | 0.81 (0.76, 0.87) | < 0.0001 | 0.94 (0.85, 1.04) | 0.2158 | 0.95 (0.92, 0.99) | 0.0054 | |
| Outcome | aORs in subjects for | |||
|---|---|---|---|---|
| T2 exposure | Non-T2 exposure | |||
| aOR (95% CI) | P-value | aOR (95% CI) | P-value | |
| aORs are associated with per 1 SD unit increase in target indices. aModel is adjusted for age, gender, BMI group, ethnicity, smoking exposure. bModel is adjusted for age, gender, BMI group, education, smoking exposure, early-onset, family history. cModel is adjusted for age, gender, poverty, smoking exposure, early-onset. dModel is adjusted for age, ethnicity, poverty, education, early-onset. aOR: adjusted odds ratio; CI: confidence interval; FEF25-75: forced expiratory flow between 25% and 75% of forced vital capacity; FEV1: forced expiratory volume in 1 second; FEV3: forced expiratory volume in 3 seconds; FEV6: forced expiratory volume in 6 seconds; FVC: forced vital capacity. | ||||
| Recurrent wheezing/whistlinga | ||||
| FEV1/FEV6 | 0.75 (0.68, 0.84) | < 0.0001 | 0.76 (0.65, 0.88) | 0.0004 |
| FEV3/FEV6 | 0.73 (0.70, 0.77) | < 0.0001 | 0.72 (0.44, 1.17) | 0.1811 |
| FEF25-75 | 0.75 (0.68, 0.83) | < 0.0001 | 0.70 (0.66, 0.74) | < 0.0001 |
| FEF25-75/FVC | 0.81 (0.72, 0.90) | 0.0002 | 0.78 (0.72, 0.84) | < 0.0001 |
| Severe wheezing/whistlingb | ||||
| FEV1/FEV6 | 0.76 (0.63, 0.90) | 0.0021 | 1.12 (1.04, 1.21) | 0.0042 |
| FEV3/FEV6 | 0.70 (0.53, 0.91) | 0.0091 | 0.95 (0.83, 1.10) | 0.5142 |
| FEF25-75 | 0.57 (0.48, 0.68) | < 0.0001 | 0.90 (0.80, 1.01) | 0.0818 |
| FEF25-75/FVC | 0.77 (0.62, 0.95) | 0.0138 | 1.14 (1.08, 1.22) | < 0.0001 |
| Dry coughc | ||||
| FEV1/FEV6 | 0.83 (0.76, 0.91) | < 0.0001 | 1.08 (0.86, 1.36) | 0.4923 |
| FEV3/FEV6 | 0.78 (0.76, 0.80) | < 0.0001 | 0.83 (0.74, 0.93) | 0.0012 |
| FEF25-75 | 0.71 (0.59, 0.86) | 0.0004 | 0.75 (0.72, 0.78) | < 0.0001 |
| FEF25-75/FVC | 0.84 (0.76, 0.94) | 0.0022 | 1.22 (0.88, 1.69) | 0.2297 |
| Hay feverd | ||||
| FEV1/FEV6 | 1.11 (0.89, 1.37) | 0.3627 | 0.85 (0.71, 1.03) | 0.0929 |
| FEV3/FEV6 | 1.02 (0.85, 1.23) | 0.8350 | 0.70 (0.55, 0.91) | 0.0070 |
| FEF25-75 | 0.95 (0.80, 1.12) | 0.5207 | 0.87 (0.73, 1.05) | 0.1429 |
| FEF25-75/FVC | 1.04 (0.84, 1.28) | 0.7390 | 0.90 (0.78, 1.05) | 0.1821 |
| Target indices | T2 exposure | Recurrent wheezing/whistling | Severe wheezing/whistling | Dry cough | Hay fever | ||||
|---|---|---|---|---|---|---|---|---|---|
| RERI (95% CI) | P-value | RERI (95% CI) | P-value | RERI (95% CI) | P-value | RERI (95% CI) | P-value | ||
| *P < 0.05 for multiplicative scale. CI: confidence interval; FEF25-75: forced expiratory flow between 25% and 75% of forced vital capacity; FEV1: forced expiratory volume in 1 second; FEV3: forced expiratory volume in 3 seconds; FEV6: forced expiratory volume in 6 seconds; FVC: forced vital capacity; RERI: relative excess risk of interaction. | |||||||||
| FEV1/FEV6 | |||||||||
| High (> 33th) | No | 0.34 (0.09, 0.60) | 0.2497 | 0.43 (0.28, 0.57) | 7.71 × 10⁻⁹ | 0.18 (0.14, 0.21) | < 0.0001 | -0.45 (-0.88, -0.03) | 0.0368 |
| Yes | |||||||||
| Low (≤ 33th) | No | ||||||||
| Yes | |||||||||
| FEV3/FEV6 | |||||||||
| High (> 33th) | No | 0.41 (0.28, 0.53) | 2.10 × 10⁻⁸ | 0.50 (0.29, 0.71) | 2.93 × 10⁻⁶ | 0.27 (0.10, 0.44) | 2.37 × 10⁻³ | -0.78 (-0.62, -0.07) | 0.0002 |
| Yes | |||||||||
| Low (≤ 33th) | No | ||||||||
| Yes | |||||||||
| FEF25-75 | |||||||||
| High (> 33th) | No | 0.34 (0.21, 0.47) | 3.77 × 10⁻⁴ | 0.58 (0.39, 0.78) | 3.98 × 10⁻⁹ | 0.48 (-0.18, 1.14) | < 0.0001* | -0.05 (-0.64, 0.55) | 0.8780 |
| Yes | |||||||||
| Low (≤ 33th) | No | ||||||||
| Yes | |||||||||
| FEF25-75/FVC | |||||||||
| High (> 33th) | No | 0.42 (0.23, 0.62) | 6.21 × 10⁻³ | 0.41 (0.27, 0.56) | 1.07 × 10⁻⁸ | 0.30 (0.06, 0.54) | 0.0159 | -0.16 (-0.27, -0.04) | 0.0067 |
| Yes | |||||||||
| Low (≤ 33th) | No | ||||||||
| Yes | |||||||||