

| Journal of Clinical Medicine Research, ISSN 1918-3003 print, 1918-3011 online, Open Access |
| Article copyright, the authors; Journal compilation copyright, J Clin Med Res and Elmer Press Inc |
| Journal website http://www.jocmr.org |
Original Article
Volume 12, Number 6, June 2020, pages 377-388
Associations Between Cannabis Use, Abdominal Fat Phenotypes and Insulin Traits
Charlotte E. Stuarta, Juyeon Koa, Gisselle C. Alarcon Ramosa, Andre E. Modestoa, Jaelim Choa, Maxim S. Petrova, b
aSchool of Medicine, University of Auckland, Auckland, New Zealand
bCorresponding Author: Maxim S. Petrov, Auckland City Hospital, Room 12.085A, Level 12, Auckland 1023, New Zealand
Manuscript submitted April 14, 2020, accepted May 4, 2020, published online June 4, 2020
Short title: Cannabis Use and Metabolic Health
doi: https://doi.org/10.14740/jocmr4165
| Abstract | ▴Top |
Background: General obesity has been linked to dysregulation of the endocannabinoid system in humans. However, there is a lack of studies on the relationship between cannabis use and specific abdominal fat phenotypes. The aim was to investigate the associations between cannabis use and magnetic resonance imaging-derived fat phenotypes, as well as indices of insulin sensitivity and insulin secretion.
Methods: In this cross-sectional study, magnetic resonance imaging was used to quantify subcutaneous fat volume (SFV), visceral fat volume (VFV), intra-hepatic fat deposition (IHFD), intra-pancreatic fat deposition (IPFD) and skeletal muscle fat deposition (SMFD) by two independent observers. Insulin sensitivity was determined based on HOMA-IS, Raynaud index and Matsuda index, whereas insulin secretion was determined based on HOMA-β, insulinogenic index 30’ and insulinogenic index 60’. A validated questionnaire was used to ascertain participants’ cannabis use. Linear regression models were constructed, adjusting for demographics, glycated hemoglobin, physical activity, tobacco smoking and alcohol consumption.
Results: A total of 120 individuals were included. Cannabis use explained 9.2% of variance in IHFD, 4.4% in SMFD, 3.4% in VFV, 0.4% in SFV and 0.2% in IPFD. Regular cannabis users had significantly greater IHFD compared with never users, in both the unadjusted (P = 0.002) and all adjusted (P = 0.002; P = 0.008) analyses. The other fat phenotypes did not differ significantly between either regular or non-regular users compared with never users. Regular cannabis users had significantly greater insulin secretion (as defined by the insulinogenic index 60’) compared with never users, in both the unadjusted (P = 0.049) and all adjusted (P = 0.003; P = 0.004) analyses. Cannabis use explained 20.3% of variance in the insulinogenic index 60’, but was not significantly associated with the other indices of insulin secretion. There were no significant differences in indices of insulin sensitivity in either regular or non-regular cannabis users compared with never users.
Conclusion: Regular cannabis use may be a risk factor for non-alcoholic fatty liver disease (but not IPFD) and may alter the neuromodulation of insulin secretion. Further investigations are now warranted to elucidate the mechanisms underlying these associations.
Keywords: Cannabis use; Intra-hepatic fat; Intra-pancreatic fat; Skeletal muscle fat; Visceral fat; Subcutaneous fat; Magnetic resonance imaging; Insulin traits
| Introduction | ▴Top |
The Cannabis sativa plant is among the earliest crops cultivated by man and its use dates back to 2737 BC [1]. In recent decades, with the discovery of the endocannabinoid system (ECS), there has been an increasing trend towards legalizing medicinal cannabis use. To date, 33 US states have legalized cannabis for medicinal use, with 11 of these also allowing recreational use [2]. The US Food and Drug Administration has approved the use of cannabis-based drugs for the treatment of seizures associated with Lennox-Gastaut syndrome and Dravet syndrome, for nausea and vomiting associated with cancer chemotherapy in patients who have been unresponsive to first-line treatments, and for anorexia associated with weight loss in acquired immunodeficiency syndrome patients [3]. Given the numerous health claims and the increasing trend towards decriminalization of cannabis, there has been a call to better understand the acute and chronic risks of cannabis use. Memedovich and colleagues [2] reviewed the current literature on cannabis use-related health effects. Of the 68 studies analyzed, they found 62 reported various adverse outcomes [2]. However, these effects are not completely understood and research is far from sufficient to recommend a “safe” therapeutic dose of cannabis-based drugs.
In the context of metabolic health, the relationship between cannabis use and metabolic sequelae has been speculated. “Marijuana”, the most commonly used recreational form of cannabis, contains high concentrations of Δ-9-THC (the main psychoactive constituent of the plant), which is known to have appetite-inducing properties [4]. Cannabinoid receptors (CB1R and CB2R) are present both centrally and peripherally, and their endogenous ligands, endocannabinoids, play a central role in appetite regulation, energy balance, lipid metabolism, insulin sensitivity and β-cell function [5]. A clear association exists between ECS dysregulation and the development of obesity and type 2 diabetes. Animal studies have demonstrated that chronic CB1R stimulation favors adiposity, independent of calorie intake [4]. Several experimental models have shown metabolic effects from peripheral CB1R activation, including increased lipogenesis in hepatocytes and adipocytes, reduced insulin responsiveness of myocytes, as well as impaired insulin sensitivity and secretion in the pancreatic β cells [4]. Consistent with these findings, human clinical trials using CB1R antagonists have proven to be effective in reducing body weight as well as improving dyslipidemia and insulin sensitivity [4]. These findings from human and animal studies suggest that cannabis use may be not innocuous and may be privy to the pathophysiology of metabolic syndrome.
Evidence for cannabis use and obesity has been derived largely from experimental models and epidemiological data using body mass index (BMI) [6, 7]. More recently, focus has shifted to the distribution of fat, including visceral and ectopic, as a greater predictor of metabolic risk [8]. Muniyappa and colleagues [4] have demonstrated a relative visceral adiposity and adipose tissue insulin resistance (IR) in chronic cannabis users, suggesting differential and tissue-specific effects of regular cannabis use. In the context of ectopic fat deposition, only preliminary studies have linked cannabis use with the risk of fatty liver, which have predominantly been animal studies [9, 10]. Magnetic resonance (MR) imaging has emerged as the “gold standard” for differentiating the abdominal fat compartments and quantifying ectopic fat, such as in the liver and pancreas. To date, no attempts have been made to comprehensively characterize the phenotype of fat deposition (using validated MR-derived measurements) associated with cannabis use. Further, it has not been investigated how the distribution of fat (both visceral and ectopic) associated with cannabis use affects insulin secretion and sensitivity.
The primary aim of this study was to investigate the association between cannabis use and MR-derived fat phenotypes. The secondary aim was to evaluate the association between cannabis use and insulin traits.
| Materials and Methods | ▴Top |
Study design and study population
This was a cross-sectional study, which represented a subproject within the main project. The main project focused on intra-pancreatic fat deposition (IPFD) after an attack of pancreatitis and its results were published elsewhere [11]. Participants with available data on cannabis use were included in the present study if they were of at least 18 years of age, provided written informed consent, and had a history of pancreatitis. Exclusion criteria were other diseases of the exocrine pancreas, interventions involving the pancreas, malignancy, pregnancy, celiac disease, cystic fibrosis, history of steroid use, or medical evaluation or treatment for acute infectious or inflammatory conditions within the preceding 6 months [11]. Individuals with contraindications to MR imaging (e.g. electronic device implantations, metallic foreign bodies) were also excluded from this study. The study was approved by the Health and Disability Ethics Committee (13/STH/182) and conducted in compliance with the ethical standards of the responsible institution on human subjects as well as with the Helsinki Declaration.
Ascertainment of cannabis use
At the time of MR acquisition, participants completed a standardized questionnaire, which asked about their history of cannabis use. They were first asked “Have you ever used marijuana?”. Those who answered no to this question were categorized as “never” cannabis users. Those who answered yes to this question were “ever” cannabis users, and were then asked “How often did/do you use marijuana?”. The options for this question were: 1) Occasionally; 2) Less than once per week; 3) Once per week; 4) 2 - 3 times per week; and 5) Daily. Answers to this question were used to categorize participants into “non-regular” and “regular” cannabis users, where “non-regular” users were defined as less than once per week (answers 1-2) and “regular” users defined as one or more times per week (answers 3-5), respectively, in line with published literature [12].
MR imaging protocol
All participants underwent abdominal MR scans, performed at the Centre of Advanced Magnetic Resonance Imaging (The University of Auckland) using a 3.0 Tesla MAGNETOM Skyra MR scanner (Siemens, Erlangen, Germany). The detailed protocol was described elsewhere [11]. In brief, while in the supine position, participants were asked to breath-hold during end expiration. Axial T1-weighted volumetric interpolated breath-hold examination Dixon sequence was applied with the following parameters: true form abdomen shim mode; field of view (FOV), 420 mm; base resolution, 320; echo time (TE), 1.27 ms, 2.5 ms; repetition time (TR), 3.85 ms; flip angle, 9; pixel bandwidth, 920 Hz; slice thickness, 5 mm. Four types of images were generated: in-phase, out-of-phase, fat and water images. These images were retrieved from the MR scanner and exported as DICOM files after which they were analyzed using ImageJ software (National Institutes of Health, USA).
Subcutaneous fat volume (SFV) and visceral fat volume (VFV)
Quantification of SFV and VFV was conducted from the L2 to the L5 levels by segmentation of the subcutaneous and visceral fat compartments using the free-hand tool of ImageJ. Care was taken to exclude all non-adipose tissue, abdominal organs and blood vessels from the measurement of visceral fat. The calculation of volumes required summation of the pixel contents (from the complete series of slices) and multiplying by the total pixel area and slice thickness, as described elsewhere [13].
Intra-pancreatic fat deposition (IPFD)
IPFD (%) was measured using the “MR-opsy” technique, as per previously published protocol [14]. In brief, two candidate slices (of 5 mm thickness), with clear visualization of the pancreas, were selected from the series of abdominal MR scans. Three regions of interest were placed in the head, body and tail region of the pancreas for estimation of IPFD (Fig. 1a, b). A thresholding range of 1-20% was applied, to eliminate potential inclusion of the non-parenchymal tissue within the selected region of interest (including blood vessels, visceral fat and the main pancreatic duct), as previously described [14]. IPFD was calculated as the average pancreatic fat fraction of both slices.
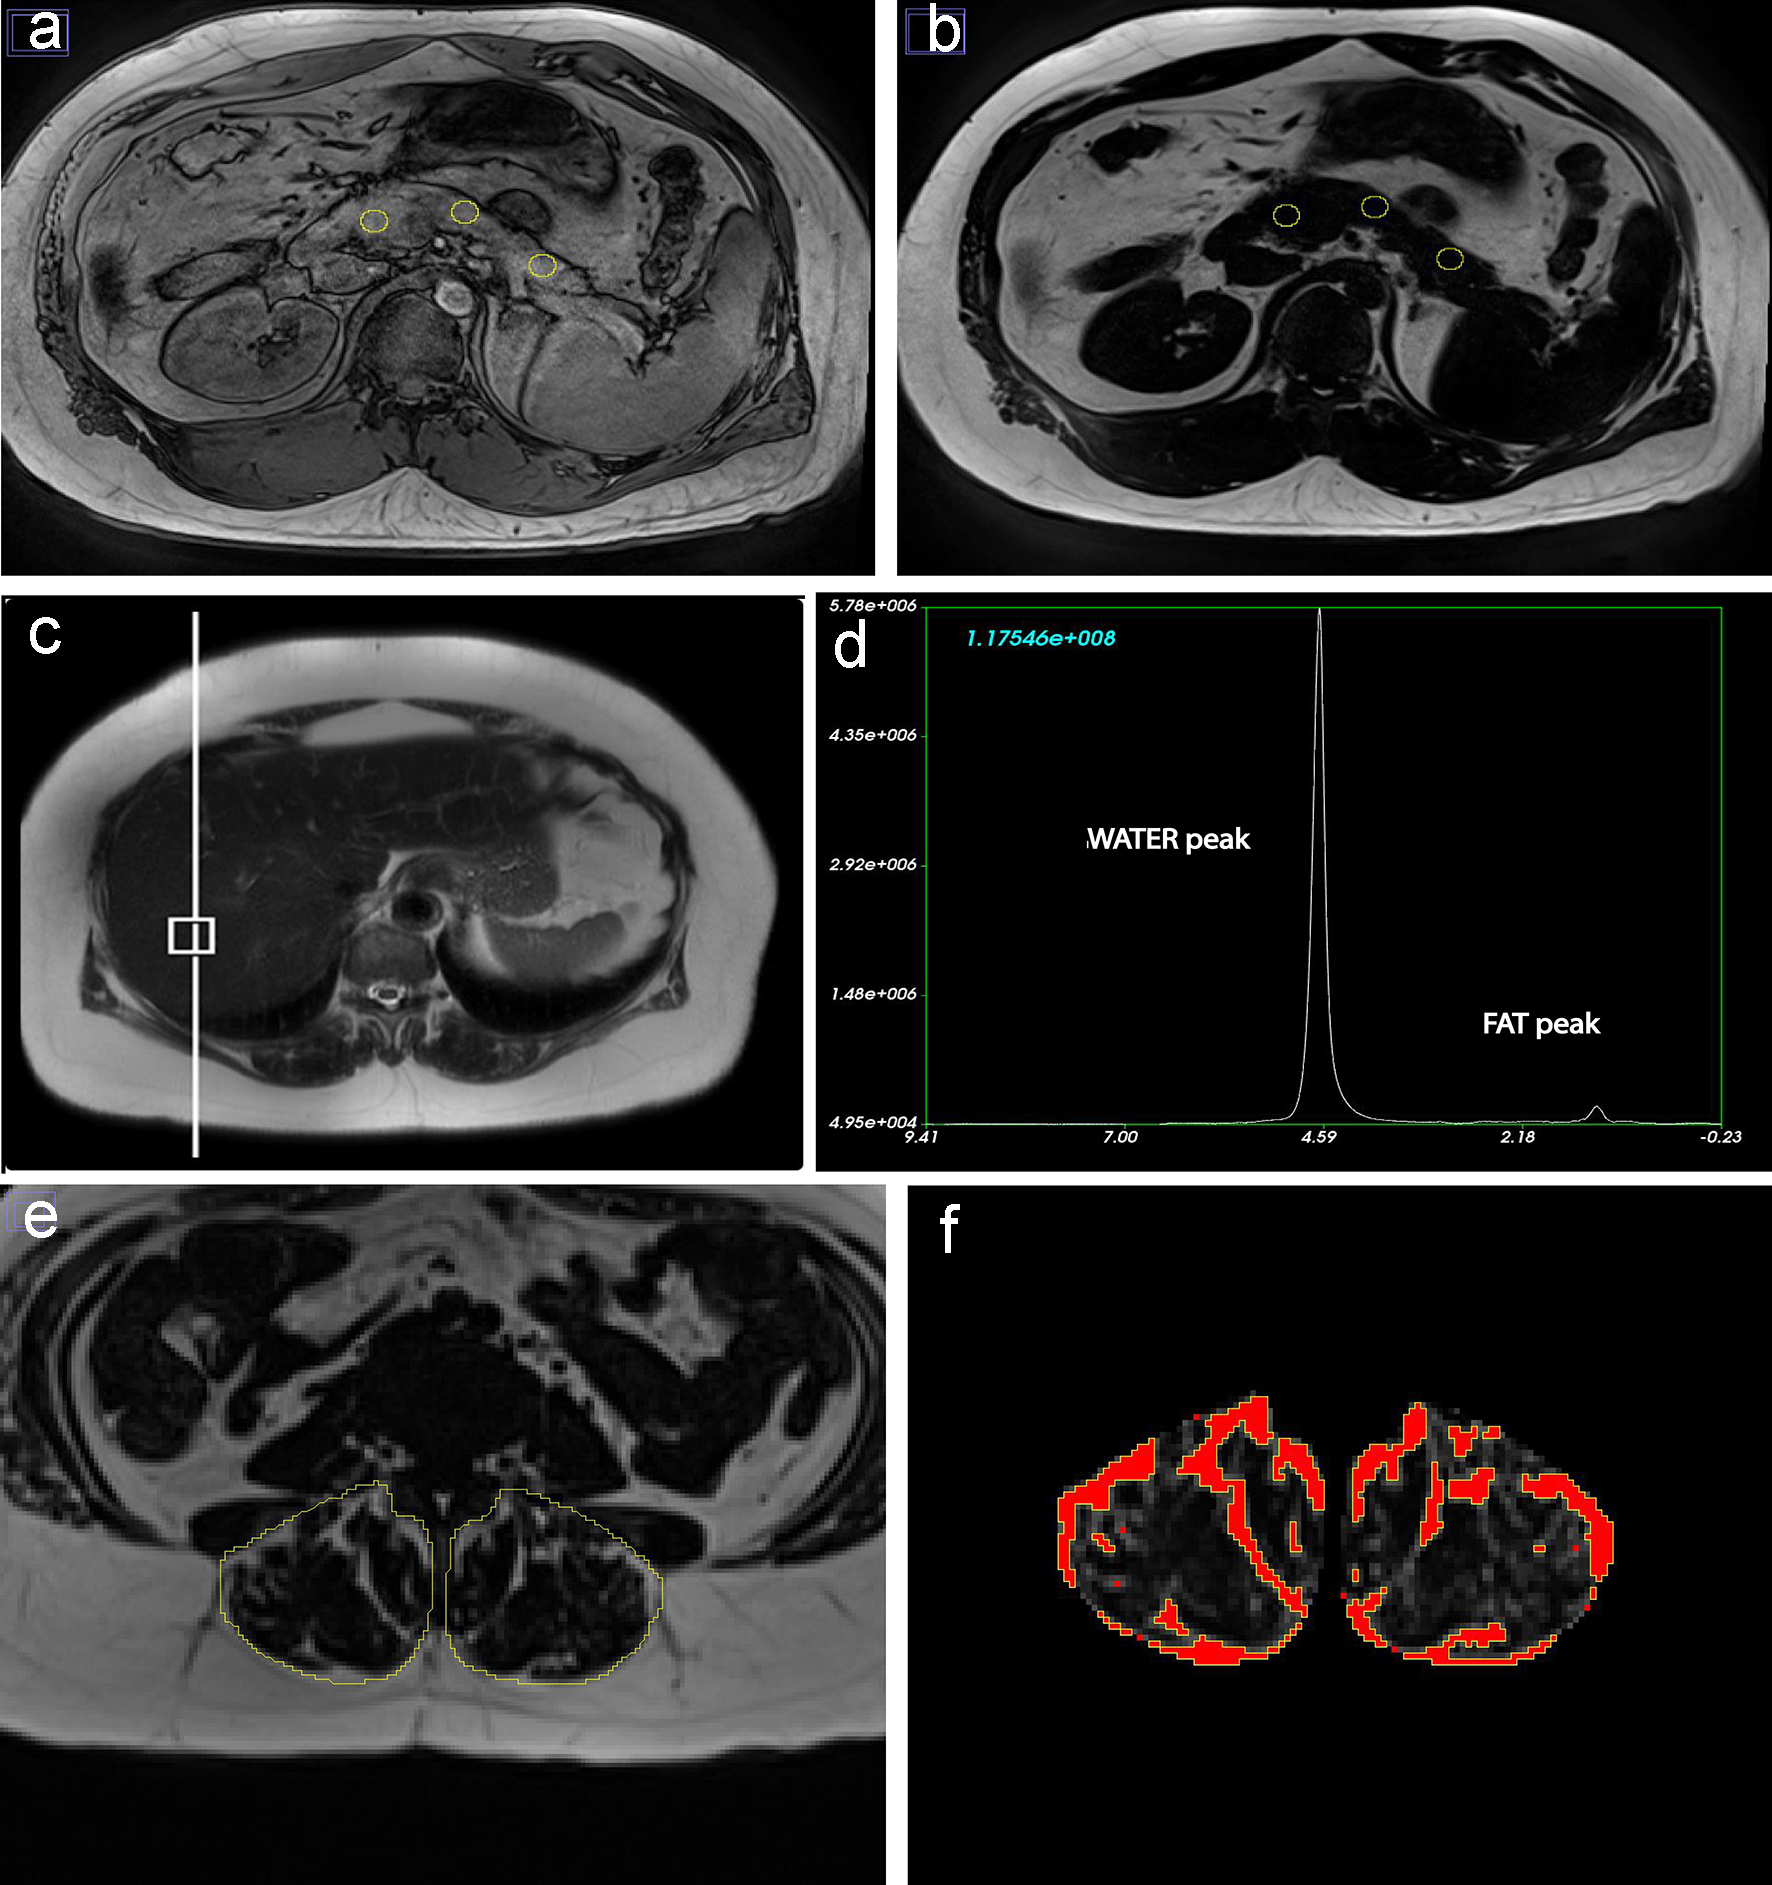 Click for large image | Figure 1. Fat phenotypes measurements for a 78-year-old European man who was never smoker and had low-to-moderate average alcohol consumption. (a, b) Intra-pancreatic fat deposition measurement by region of interest placement in the head, body and tail of the pancreas on out-of-phase and fat images. (c, d) Intra-hepatic fat deposition measurement with placement of the voxel within the liver and spectroscopy data using fat and water signals collected at the time of scan acquisition. (e, f) Skeletal muscle fat deposition measurement with selection of total erector spinae muscle area and quantification of fat pixels using the thresholding function of ImageJ. |
Intra-hepatic fat deposition (IHFD)
IHFD (%) was determined using single-voxel MR-spectroscopy. A 20 × 20 × 20 mm voxel was positioned in the right lobe of the liver ≥ 10 mm away from the edge, bile ducts and blood vessels (Fig. 1c). Automated shimming was performed prior to signal acquisition to improve B0 homogeneity. Spectra were acquired using a free-breathing navigator-triggered spin echo acquisition with TR = 3,000 ms, TE = 33 ms, 50 averages. Acquisition time for each spectrum was 5 min. Both water-suppressed and non-water-suppressed spectra were acquired, with the non-water-suppressed spectrum acting as a reference for IHFD quantification (Fig. 1d). Spectra were processed and analyzed using SIVIC (San Francisco, CA, USA) [15]. MR spectroscopy-derived IHFD was defined as follows: fat fraction = area under fat peak/(area under combined fat and water peaks) × 100%.
Skeletal muscle fat deposition (SMFD)
Total muscle area and intra-muscular fat area of erector spinae muscles were measured using a single axial slice at the lower endplate of L3 vertebra, as it had previous been demonstrated that the L3 level is a reliable marker for total skeletal muscle fat [16]. The free-hand tool of ImageJ was used to outline the left and right erector spinae muscles followed by measurement of total pixel content (Fig. 1e) [16]. Further, to calculate the intra-muscular fat area, the threshold-function of ImageJ was used to convert grayscale pixels into binary images, using global histogram-derived method (Fig. 1f). Care was taken not to include extra-muscular fat (i.e. beyond the fascial layer of the erector spinae muscles). Total muscle area and intra-muscular fat area were calculated by multiplying the selected total pixel content with pixel surface area. The ratio of fat-free cross-sectional muscle area to total cross-sectional muscle area was determined by subtracting intra-muscular fat area from the total muscle area and dividing this value by the total muscle area. SMFD was defined as follows: fat fraction = (1 - fat-free cross-sectional muscle area to total cross-sectional muscle area ratio) × 100%.
Inter-observer reliability
Two observers, blinded to participant characteristics and group allocation, measured SFV, VFV, IPFD and SMFD independently. Average measurement values of the two independent measurements were used for all statistical analyses. Inter-observer reliability of measurements was evaluated using intra-class correlation coefficients (ICCs), with < 0.5, 0.5 - 0.75, 0.75 - 0.9 and > 0.9 being indicative of poor, moderate, good and excellent inter-rater reliability, respectively [11].
Laboratory analyses
Participants underwent a mixed meal test at the COSMOS Clinic at the University of Auckland (New Zealand). Venous blood samples were taken at baseline following at least 8 h overnight fast. All participants consumed a standardized mixed meal of BOOST® drink and venous blood samples were collected at fasting and post-prandially [17]. Glycated hemoglobin (HbA1c) and plasma glucose were analyzed at the tertiary referral medical laboratory, LabPlus (Auckland, New Zealand). Participants’ diabetes status was determined based on their HbA1c level at the time of MR acquisition. Insulin and C-peptide were measured using the MILLIPLEX MAP Human metabolic hormone magnetic bead panel based on the Luminex xMAP technology (Luminex Corporation, Austin). Results were calculated based on the fluorescent reporter signals recorded by the Luminex xPONENT software (MILLIPLEX Analyst 5.1).
Insulin traits
Three measures of insulin sensitivity: HOMA-IS (fasting), Raynaud index (fasting) and Matsuda index (post-prandially), and three measures of insulin secretion: HOMA-β (fasting), insulinogenic index 30’ (post-prandial) and insulinogenic index 60’ (post-prandial), were calculated according to previously published protocols [17]. HOMA-IS was calculated as 1/HOMA-IR, with HOMA-IR values obtained using the HOMA2 calculator (version 2.2.3 Diabetes Trials Unit, University of Oxford). The Raynaud index was calculated with the formula 40/Ins0, where Ins0 represents the insulin value at fasting. The Matsuda index was calculated using the formula:
HOMA-β was calculated with fasting insulin and glucose values using the HOMA2 calculator (version 2.2.3 Diabetes Trials Unit, University of Oxford). Insulinogenic index 30’and 60’ were calculated as (Ins30 - Ins0)/(Glu30 - Glu0) and (Ins60 - Ins0)/(Glu60 - Glu0), where Ins30/Ins60 and Glu30/Glu60 represent the insulin value and blood glucose level at 30 and 60 min following consumption of mixed meal.
Other variables
Body mass index (BMI) was calculated using the formula (BMI = W/Ht2), weight (W) in kilograms (kg) divided by height (m) squared (Ht2). Participants’ weight was measured in kg using a digital scale (rounded to the nearest 0.1 kg) and their height measured in cm using a wall-mounted stadiometer (rounded to the nearest 0.5 cm). The administered questionnaire also collected information on tobacco smoking, alcohol consumption and physical activity. Tobacco smoking was categorized as never, former, light (< 20 cigarettes/day) and moderate-heavy (≥ 20 cigarettes/day). Alcohol consumption was categorized according to average daily consumption into none (0 g/day), light to moderate (1 - 40 g/day) and excess (> 40 g/day). A binary variable was generated for physical activity status, defined as less or more than 2.5 h of moderate-to-vigorous physical activity per week.
Statistical analyses
All statistical analyses were performed using SPSS for Windows Version 25 (SPSS Inc., Chicago, IL, USA). Extreme values in the data (defined as cases with values/standardized residuals greater than ± 3 standard deviations) were considered outliers and were excluded from the analyses [13]. Data were expressed as median and interquartile range (IQR) or frequency count and percentage (%) for continuous and categorical variables, respectively. Differences in baseline characteristics between never, non-regular and regular cannabis users were examined using analysis of variance (for continuous variables) and Chi-squared test (for categorical variables).
Statistical analyses were performed in two stages. First, to investigate the variation in each fat phenotype (SFV, VFV, IPFD, IHFD and SMFD) explained by cannabis use, the most robust R2 metric from univariate linear regression analysis was yielded for each association. Regular and non-regular cannabis users were compared with never cannabis users (reference group). Further, multiple variable linear regression models were used to adjust for potential confounders. For each of the five fat phenotypes as separate dependent variables, three models were constructed: 1) Unadjusted; 2) Adjusted for age, sex and ethnicity; and 3) Adjusted for age, sex, ethnicity, HbA1c, physical activity, tobacco smoking status and alcohol consumption. Values were reported as the B-coefficients, 95% confidence intervals (CIs) and associated P-values.
Second, to investigate the associations between cannabis use and the six indices of insulin sensitivity (HOMA-IS, Raynaud index and Matsuda index) and insulin secretion (HOMA-β, insulinogenic index 30’ and insulinogenic index 60’), univariate and multiple variable linear regression models were used. As in the first stage of analysis, regular and non-regular cannabis users were compared with never cannabis users for each of the six insulin sensitivity/secretion indices as separate dependent variables. To investigate the variation in each insulin sensitivity/secretion index explained by cannabis use, the most robust R2 metric from the univariate analysis was yielded for each association. The same three models were constructed as above. A two-sided P-value of less than 0.05 was considered statistically significant in all analyses.
| Results | ▴Top |
Characteristics of participants
A total of 120 individuals were recruited into the study, of whom 91 were never cannabis users, 21 were non-regular cannabis users and 8 were regular cannabis users. For the fat phenotypes of the total cohort, mean ± standard deviation SFV was 3,090 ± 1,432cm3, VFV was 2,158 ± 1,140 cm3, IPFD was 9.52±1.79%, IHFD was 10.14±9.40% and SMFD was 15.15±6.81%. For the insulin sensitivity indices of the total cohort, mean ± standard deviation HOMA-IS was 0.67 ± 0.40, Raynaud index was 4.18 ± 8.17 and Matsuda index was 0.72 ± 0.51. For the insulin secretion indices of the total cohort, mean ± standard deviation HOMA-β was 151.28 ± 82.52, insulinogenic index 30’ was 0.62 ± 1.18 and insulinogenic index 60’ was 0.65 ± 0.44. Characteristics of the study participants according to cannabis use group are presented in Table 1.
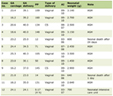 Click to view | Table 1. Baseline Characteristics of the Study Cohort |
Associations between cannabis use and the fat phenotypes in the study groups
The inter-rater reliability of the measurements of the MRI-derived fat phenotypes was as follows: ICC of 0.998 for SFV, 0.997 for VFV, 0.970 for IPFD and 0.984 for SMFD.
Cannabis use contributed the most to variance in IHFD (R2 = 9.2%), followed by SMFD (R2 = 4.4%), then VFV (R2 = 3.4%). Cannabis use contributed the least to variance in IPFD (R2 = 0.2%) (Fig. 2). IHFD was significantly greater in regular cannabis users when compared with never cannabis users, in both the unadjusted (P = 0.002) and two adjusted (P = 0.002; P = 0.008) models. Non-regular cannabis users did not have significantly greater IHFD compared with never cannabis users (Table 2). SFV was significantly greater in regular cannabis users when compared with never cannabis users, in the unadjusted analysis (P = 0.024). This was not significant in the two adjusted models (Table 2). There were no significant differences in VFV, IPFD or SMFD when compared with never cannabis users, regardless of their level of cannabis use.
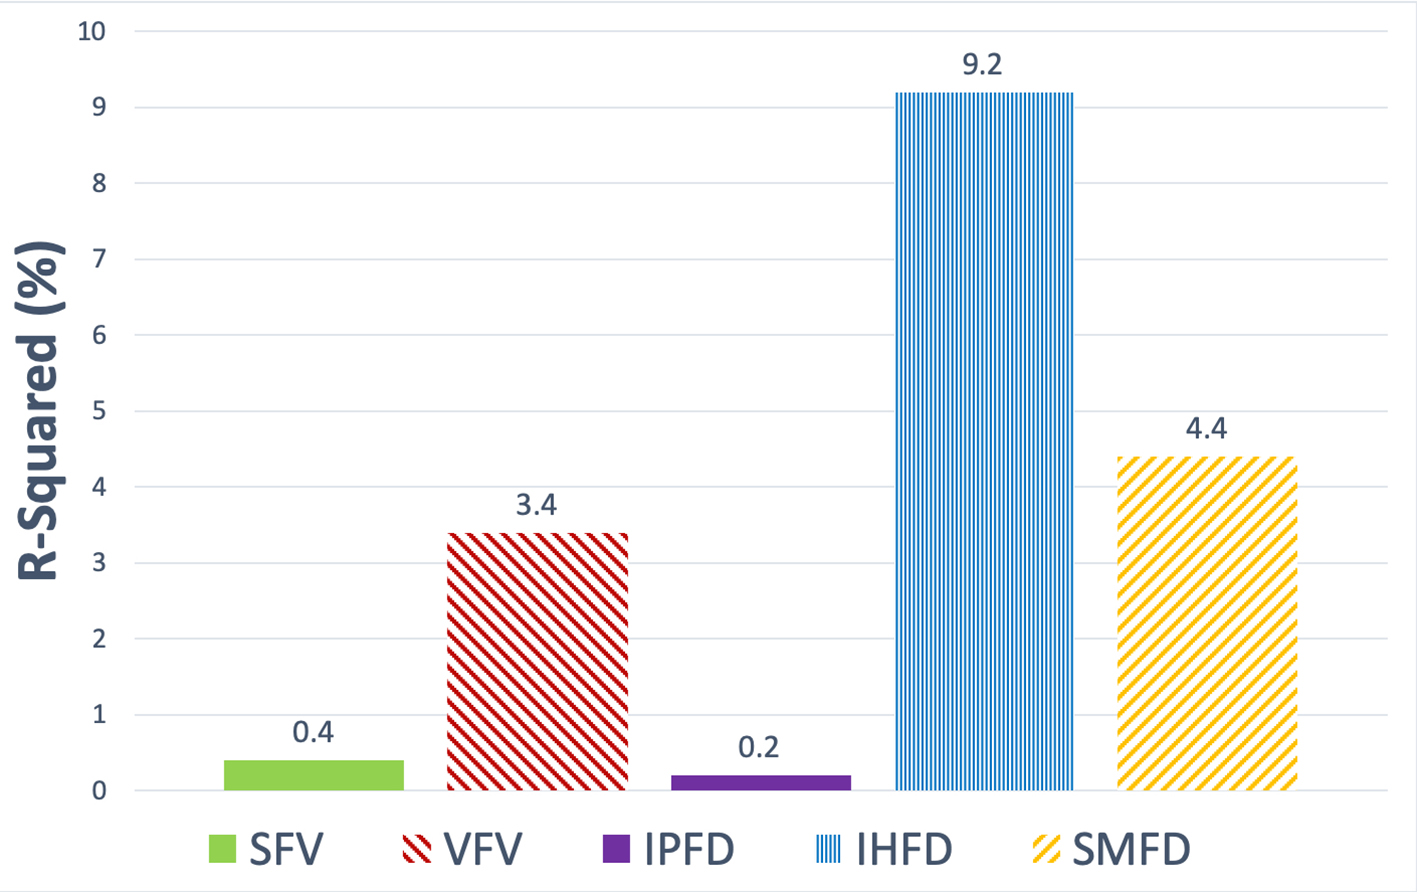 Click for large image | Figure 2. Contribution of cannabis use to variance in each of the fat phenotypes in the study cohort. Data are presented as the R2 metric (%). SFV: subcutaneous fat volume; VFV: visceral fat volume; IPFD: intra-pancreatic fat deposition; IHFD: intra-hepatic fat deposition; SMFD: skeletal muscle fat deposition. |
Click to view | Table 2. Associations Between Cannabis Use and the Studied Fat Phenotypes |
Associations between cannabis use and the insulin traits in the study groups
Cannabis use contributed the most to variance in the Raynaud index (R2 = 8.2%) out of all the insulin sensitivity indices. Cannabis use explained 0.6% of variance in both HOMA-IS and the Matsuda index. There were no significant differences in HOMA-IS, Matsuda index, or Raynaud index when compared with never cannabis users, in both the unadjusted and two adjusted models (Table 3).
Click to view | Table 3. Associations Between Cannabis Use and the Studied Insulin Traits |
Cannabis use contributed the most to variance in the insulinogenic index 60’ (R2 = 20.3%) out of all the insulin secretion indices. Cannabis use explained 4.4% of variance in the HOMA-β index and 1.7% of variance in the insulinogenic index 30’. Insulinogenic index 60’ was significantly greater in regular cannabis users when compared with never cannabis users, in both the unadjusted (P = 0.049) and two adjusted (P = 0.003; P = 0.004) models. Non-regular cannabis users did not have significantly higher insulinogenic index 60’compared with never cannabis users (Table 3). There were no significant differences in the insulinogenic index 30’ or HOMA-β when compared with never cannabis users, in both the unadjusted and two adjusted models (Table 3).
| Discussion | ▴Top |
This study has investigated the association between cannabis use and comprehensively characterized fat phenotypes derived from MR imaging, including visceral and subcutaneous fat as well as ectopic fat in the liver, pancreas and skeletal muscle. Further, this study has presented data on the association between cannabis use and several indices of insulin sensitivity and secretion (both fasting and post-prandial). All MR-derived measurements completed by two independent observers had excellent inter-rater reliability (ICC > 0.9). Further, the used statistical models accounted for potential covariates in both analyses of cannabis use with fat phenotypes and cannabis use with insulin traits. We report two main findings from this study. First, regular cannabis users had significantly greater IHFD (but not SFV, VFV, IPFD or SMFD) compared with never cannabis users. This remained significant after adjusting for age, sex, ethnicity, HbA1c, tobacco smoking, alcohol consumption and physical activity. Moreover, the amount of variance explained by cannabis use was greatest for IHFD (R2 = 9.2%). Second, regular cannabis users had significantly greater insulin secretion (as defined by the insulinogenic index 60’) when compared with never cannabis users, whereas insulin sensitivity was not significantly altered in cannabis users.
This study presents novel findings and there are many unknowns regarding the mechanisms that underlie them. We speculate that, at least in part, our results may be attributed to upregulated neurohumoral stimulation from the central ECS, which is supported by evidence of the effect of cannabis use on autonomic regulation of β-cell secretion [18, 19]. The ECS is a neuromodulatory system that acts on both the central and peripheral nervous systems, as well as non-neural peripheral sites [18]. CB1Rs are present in all sites involved in the control of energy homeostasis. While CB1Rs are predominantly found in the central nervous system, lower levels are detected in skeletal muscle, liver, pancreas and gastrointestinal tract [18]. CB1Rs are among the most abundant G-protein coupled receptors expressed in the brain and are present in the forebrain, basal ganglia, cerebellum, hippocampus and cerebral cortex [20]. The ECS is the main central system involved in appetite-regulation and food intake. Pharmacologic administration of CB1 agonists increases food consumption and, in the case of Δ-9-THC, has been observed even in satiated animals [4, 5, 20]. Moreover, systemic CB1R blockade by SR141716A (rimonabant) reduces food intake in both fed and fasted animals [20]. Its modulation of food intake is believed to be two-fold. First, through mesolimbic pathways and dopaminergic release, it activates the reward mechanisms for food consumption (usually of highly palatable foods). Second, through hypothalamic regulation of the level and/or activity of anorectic and orexigenic mediators that induce appetite. CB1R expression in the hypothalamus, a key area for the regulation of energy balance, is relatively low but highly efficient, and activation stimulates the release of key neurotransmitters (including but not limited to noradrenaline and serotonin). Both noradrenaline and serotonin are key neurohumoral regulators of insulin secretion, and they can exert both stimulatory and inhibitory effects on the pancreatic β cells [21]. Acute increases in sympathetic neurotransmission initially inhibit insulin secretion but over longer periods elevate its plasma levels. While it is assumed that noradrenaline mediates the inhibitory actions of sympathetic stimulation on glucose-stimulated insulin secretion, it is accepted that it also has stimulatory actions through its direct activation of β2-adrenoreceptors and α2-adrenoreceprtors on both the β and α cells [22]. Serotonin can also influence insulin output, either by stimulating cellular receptors to enhance release of noradrenaline from islet sympathetic terminals, or through direct intracellular regulation of insulin release [21]. It could be speculated then that stimulation of the central ECS enhances autonomic neurotransmission to the pancreatic islet cells and induces supraphysiologic insulin secretion. Insulin drives glucose uptake into cells where it is either stored or used directly as fuel. The predominant sites of glucose uptake are the liver, skeletal muscle and adipocytes. Ectopic fat deposition typically reflects the failure of intracellular lipid homeostasis to prevent lipotoxicity as a consequence of accumulation of saturated lipid-storing white adipocytes [23]. In a hyperinsulinemic state, glucose uptake may exceed the energy requirements of the cells and lead to excess glucose storage, driving fatty infiltration into organs such as the liver. The above arguments suggest that significantly increased IHFD in regular cannabis users observed in the present study might be due to chronic stimulation of CB1Rs promoting excess insulin secretion. Cannabinoids are also known to activate PPARγ, the isoform of PPARs that mediates some of the metabolic effects seen with both endo- and phyto-cannabinoids. Palomba and colleagues [24] recently recognized a potential role for PPARγ in the modulation of leptin activity by hypothalamic CB1Rs, which further supports the effect of cannabis through CB1R mediation.
We found cannabis use was significantly associated with the insulinogenic index 60’ (reflecting increased insulin secretion at 60 min following mixed meal) but no significant changes in insulin sensitivity. The lack of observed difference in insulin sensitivity is unsurprising, given the overall studied population did not have marked abnormalities of glucose metabolism. Moreover, the group of regular cannabis users had lower median HbA1c (35 mmol/mol) than both non-regular (37 mmol/mol) and never (39 mmol/mol) users (Table 1). Increased insulin secretion may reflect an augmented insulin response following cannabis use and suggests the potential role of CB1Rs in the gastrointestinal tract. DiPatrizo and colleagues [25] found that a diet high in fat altered intestinal endocannabinoid levels, which upregulated CB1Rs in vagal nerve fibres. Investigations of β-cell function historically have used intravenous glucose. As far as the oral route is concerned, the relationship becomes more complex and is influenced by the rate of glucose absorption, neural activation, and incretin action. Incretins, such as glucose-dependent insulinotropic polypeptide (GIP) and glucagon like peptide-1 (GLP-1), enhance insulin secretion in response to nutrients and are responsible for the augmented response to glucose when given orally rather than intravenously [26]. Several animal models have isolated CB1Rs on enteroendocrine cells in rodents and have suggested these play a role in the regulation of incretin secretion [27]. Chia and colleagues [26] demonstrated a significant increase in fasting and 60 min post-oral glucose tolerance test GIP levels following administration of a CB1R agonist, but no change in GLP-1 levels. They also found an increase in GIP levels in obese individuals, suggesting increased GIP is likely a consequence of increased endocannabinoid levels. Further, rodents fed dietary linoleic acid (which increased weight gain) were found to have elevated endocannabinoid levels in both the liver and the gut [28]. Linoleic acid is also an endogenous activator of PPARs, which have further been implicated in the regulation of metabolism and energy homeostasis. The above arguments may explain why we found increased insulin secretion, but no significant change in insulin sensitivity.
Another possible explanation for our findings is that peripheral CB1Rs may be preferentially distributed in particular sites and result in augmented physiological effects from stimulation of the ECS. Peripheral CB1Rs play an important role in glucose homeostasis by modulating lipogenesis in the liver and adipose tissue. CB1R activation enhances de novo lipogenesis and triglyceride accumulation in hepatocytes and adipocytes, while minimizing lipolysis and fatty acid oxidation [28]. Liu and colleagues [29] demonstrated a reversal of diet-induced IHFD through peripheral CB1R blockade in rodents. They also found increased fatty acid oxidation with CB1R blockade in mice both with and without diet-induced obesity. This suggests a possible propensity for cannabis-related effects on hepatocytes over other peripheral cell types, due to more concentrated CB1Rs than in other peripheral sites. Alternatively, the differing effects of Δ-9-THC on fat deposition may be due to variable expression of CB1 and CB2 receptors in the peripheral ECS. While CBR expression has been shown in the islets of Langerhans, evidence is conflicting on the receptor subtypes in each of the different islet cells [19]. Previous in vivo experiments on rodents demonstrated metabolic derangement with reduced glucose uptake following administration of CB1 agonists, but the opposite with CB2 agonists [30]. Given the lack of research conducted on CB2Rs, both in their relative distribution and functions, we can only speculate their function in both metabolic dysfunction and ectopic fat deposition. Greater understanding of the interplay between the two types of cannabinoid receptors is needed to understand how cannabis differentially affects various organs and systems in human studies. Given that the relative expressions of CB1 to CB2 receptors in the peripheral tissues are currently unknown, variability in the level of expression in the liver compared with the pancreas or skeletal muscle may explain the increased IHFD compared with other fat phenotypes.
The present study has several limitations. First, the questionnaire asked about cannabis use did not specify the type of cannabis product or the mode of administration. Second, the relative amounts of Δ-9-THC versus non-Δ-9-THC cannabinoids in the used cannabis preparations are unknown. However, our question referred to “marijuana”, which is most frequently referred in the literature as recreational cannabis (with much greater Δ-9-THC than non-Δ-9-THC) [4]. Therefore, we assumed the effects seen were more the consequence of Δ-9-THC and not the CBD components (which are frequently used for therapeutic purposes). Third, there is a risk of under-reporting when asking about substance use. This would have resulted in our study yielding more conservative findings. Fourth, this was a post-hoc analysis of data on participants recruited into a study on sequelae of pancreatitis. Although all the 120 individuals had a history of mild pancreatitis, no individual had signs of acute inflammation on their MR scans and all had complete clinical resolution of their pancreatitis prior to MR acquisition [31, 32]. This also provided a relatively homogenous group of individuals who had a detailed clinical phenotype [33, 34]. They were also potentially a population with greater pain concerns due to their history of pancreatitis and subsequent impaired quality of life [35]. Hence, they could be considered an at-risk group for cannabis use or dependence, or potentially could be considered a group that may benefit from the therapeutic use of cannabis if delivered in controlled conditions [36]. Fifth, some individuals with diabetes received insulin, which may have influenced abdominal body fat composition. However, the effect is unlikely to be material as none of the participants in the regular cannabis use group and only three participants in the other two groups received insulin. Sixth, the number of regular cannabis users was rather limited. This study is considered pilot and hypothesis-generating. Power calculations of future studies in the field will benefit from the data presented here. Seventh, the analyses did not adjust for BMI or waist circumference. Whilst it is acknowledged that these parameters might have influenced the studied associations, it is also acknowledged that these are less accurate than MR-derived visceral and subcutaneous fat compartments (used as dependent variable in the present study) for metabolic health. Adjusting the studied associations for BMI or waist circumference would have introduced multicollinearity into the regression analyses and therefore undermined the statistical assumptions [13]. Last, given the cross-sectional nature of the study, inference of causality between cannabis use and fat phenotypes or insulin traits cannot be made. However, to the best of our knowledge, no longitudinal study has been conducted in humans on cannabis use. Future studies are now warranted to track temporal changes in fat phenotypes with regular cannabis use, both recreationally and therapeutically.
In conclusion, our study presents first data on the differential association between cannabis use and MR-derived fat phenotypes, including SFV, VFV, IPFD, IHFD and SMFD. Our results show significantly greater IHFD (but not SFV, VFV, IPFD or SMFD) in regular cannabis users compared with never cannabis users, both in the unadjusted and adjusted analyses. Cannabis use contributes most to variance in IHFD, and least to IPFD. Our results show significantly altered insulin secretion (but not insulin sensitivity) in regular cannabis users compared with never cannabis users. These findings provide novel insights into the relationship between cannabis use, different abdominal fat phenotypes, and insulin traits, the knowledge on which will likely increase in the future.
Acknowledgments
This study was part of the COSMOS program.
Financial Disclosure
COSMOS is supported in part by the Royal Society of New Zealand (Rutherford Discovery Fellowship to M. S. Petrov), which played no role in the study design, collection, analysis, or interpretation of data, or writing of the manuscript.
Conflict of Interest
None to declare.
Informed Consent
Informed consent was given by all study participants.
Author Contributions
Study concept and design: MSP. Patient recruitment: GAR, JC, JK, CES, AM. Acquisition of data: CES, JK, AM. Analysis and interpretation of data: CES and JC. Statistical analysis: CES and JC. Drafting of manuscript: CES. Critical revision of the manuscript: JC, JK, GAR, AM, MSP. Study supervision: MSP.
Data Availability
The authors declare that data supporting the findings of this study are available within the article.
| References | ▴Top |
- Karila L, Roux P, Rolland B, Benyamina A, Reynaud M, Aubin HJ, Lancon C. Acute and long-term effects of cannabis use: a review. Curr Pharm Des. 2014;20(25):4112-4118.
doi pubmed - Sohn E. Weighing the dangers of cannabis. Nature. 2019;572(7771):S16-S18.
doi pubmed - Abuhasira R, Shbiro L, Landschaft Y. Medical use of cannabis and cannabinoids containing products - regulations in Europe and North America. Eur J Intern Med. 2018;49:2-6.
doi pubmed - Muniyappa R, Sable S, Ouwerkerk R, Mari A, Gharib AM, Walter M, Courville A, et al. Metabolic effects of chronic cannabis smoking. Diabetes Care. 2013;36(8):2415-2422.
doi pubmed - Mazier W, Saucisse N, Gatta-Cherifi B, Cota D. The endocannabinoid system: pivotal orchestrator of obesity and metabolic disease. Trends Endocrinol Metab. 2015;26(10):524-537.
doi pubmed - Clark TM, Jones JM, Hall AG, Tabner SA, Kmiec RL. Theoretical explanation for reduced body mass index and obesity rates in cannabis users. Cannabis Cannabinoid Res. 2018;3(1):259-271.
doi pubmed - Le Strat Y, Le Foll B. Obesity and cannabis use: results from 2 representative national surveys. Am J Epidemiol. 2011;174(8):929-933.
doi pubmed - Karlsson T, Rask-Andersen M, Pan G, Hoglund J, Wadelius C, Ek WE, Johansson A. Contribution of genetics to visceral adiposity and its relation to cardiovascular and metabolic disease. Nat Med. 2019;25(9):1390-1395.
doi pubmed - Purohit V, Rapaka R, Shurtleff D. Role of cannabinoids in the development of fatty liver (steatosis). AAPS J. 2010;12(2):233-237.
doi pubmed - Izzo AA, Camilleri M. Emerging role of cannabinoids in gastrointestinal and liver diseases: basic and clinical aspects. Gut. 2008;57(8):1140-1155.
doi pubmed - Singh RG, Nguyen NN, Cervantes A, Cho J, Petrov MS. Serum lipid profile as a biomarker of intra-pancreatic fat deposition: a nested cross-sectional study. Nutr Metab Cardiovasc Dis. 2019;29(9):956-964.
doi pubmed - Yankey BN, Strasser S, Okosun IS. A cross-sectional analysis of the association between marijuana and cigarette smoking with metabolic syndrome among adults in the United States. Diabetes Metab Syndr. 2016;10(2 Suppl 1):S89-95.
doi pubmed - Cervantes A, Singh RG, Kim JU, DeSouza SV, Petrov MS. Relationship of anthropometric indices to abdominal body composition: a multi-ethnic New Zealand magnetic resonance imaging study. J Clin Med Res. 2019;11(6):435-446.
doi pubmed - Al-Mrabeh A, Hollingsworth KG, Steven S, Tiniakos D, Taylor R. Quantification of intrapancreatic fat in type 2 diabetes by MRI. PLoS One. 2017;12(4):e0174660.
doi pubmed - Crane JC, Olson MP, Nelson SJ. SIVIC: Open-source, standards-based software for DICOM MR spectroscopy workflows. Int J Biomed Imaging. 2013;2013:169526.
doi pubmed - Kiefer LS, Fabian J, Lorbeer R, Machann J, Storz C, Kraus MS, Wintermeyer E, et al. Inter- and intra-observer variability of an anatomical landmark-based, manual segmentation method by MRI for the assessment of skeletal muscle fat content and area in subjects from the general population. Br J Radiol. 2018;91(1089):20180019.
doi pubmed - Pendharkar SA, Singh RG, Cervantes A, DeSouza SV, Bharmal SH, Petrov MS. Gut hormone responses to mixed meal test in new-onset prediabetes/diabetes after acute pancreatitis. Horm Metab Res. 2019;51(3):191-199.
doi pubmed - Levendal RA, Schumann D, Donath M, Frost CL. Cannabis exposure associated with weight reduction and beta-cell protection in an obese rat model. Phytomedicine. 2012;19(7):575-582.
doi pubmed - Cota D. CB1 receptors: emerging evidence for central and peripheral mechanisms that regulate energy balance, metabolism, and cardiovascular health. Diabetes Metab Res Rev. 2007;23(7):507-517.
doi pubmed - Di Marzo V, Matias I. Endocannabinoid control of food intake and energy balance. Nat Neurosci. 2005;8(5):585-589.
doi pubmed - Porte D, Jr., Smith PH, Ensinck JW. Neurohumoral regulation of the pancreatic islet A and B cells. Metabolism. 1976;25(11 Suppl 1):1453-1456.
doi - Ahren B. Autonomic regulation of islet hormone secretion - implications for health and disease. Diabetologia. 2000;43(4):393-410.
doi pubmed - Rossi AP, Fantin F, Zamboni GA, Mazzali G, Rinaldi CA, Del Giglio M, Di Francesco V, et al. Predictors of ectopic fat accumulation in liver and pancreas in obese men and women. Obesity (Silver Spring). 2011;19(9):1747-1754.
doi pubmed - Palomba L, Silvestri C, Imperatore R, Morello G, Piscitelli F, Martella A, Cristino L, et al. Negative regulation of leptin-induced Reactive Oxygen Species (ROS) formation by cannabinoid CB1 receptor activation in hypothalamic neurons. J Biol Chem. 2015;290(22):13669-13677.
doi pubmed - DiPatrizio NV, Astarita G, Schwartz G, Li X, Piomelli D. Endocannabinoid signal in the gut controls dietary fat intake. Proc Natl Acad Sci U S A. 2011;108(31):12904-12908.
doi pubmed - Holst JJ. From the incretin concept and the discovery of GLP-1 to today's diabetes therapy. Front Endocrinol (Lausanne). 2019;10:260.
doi pubmed - Chia CW, Carlson OD, Liu DD, Gonzalez-Mariscal I, Santa-Cruz Calvo S, Egan JM. Incretin secretion in humans is under the influence of cannabinoid receptors. Am J Physiol Endocrinol Metab. 2017;313(3):E359-E366.
doi pubmed - Alvheim AR, Torstensen BE, Lin YH, Lillefosse HH, Lock EJ, Madsen L, Froyland L, et al. Dietary linoleic acid elevates the endocannabinoids 2-AG and anandamide and promotes weight gain in mice fed a low fat diet. Lipids. 2014;49(1):59-69.
doi pubmed - Liu J, Godlewski G, Jourdan T, Liu Z, Cinar R, Xiong K, Kunos G. Cannabinoid-1 receptor antagonism improves glycemic control and increases energy expenditure through sirtuin-1/mechanistic target of rapamycin complex 2 and 5'adenosine monophosphate-activated protein kinase signaling. Hepatology. 2019;69(4):1535-1548.
doi pubmed - Di Marzo V. The endocannabinoid system in obesity and type 2 diabetes. Diabetologia. 2008;51(8):1356-1367.
doi pubmed - Singh RG, Nguyen NN, Cervantes A, Alarcon Ramos GC, Cho J, Petrov MS. Associations between intra-pancreatic fat deposition and circulating levels of cytokines. Cytokine. 2019;120:107-114.
doi pubmed - Singh RG, Cervantes A, Kim JU, Nguyen NN, DeSouza SV, Dokpuang D, Lu J, et al. Intrapancreatic fat deposition and visceral fat volume are associated with the presence of diabetes after acute pancreatitis. Am J Physiol Gastrointest Liver Physiol. 2019;316(6):G806-G815.
doi pubmed - Singh RG, Nguyen NN, DeSouza SV, Pendharkar SA, Petrov MS. Comprehensive analysis of body composition and insulin traits associated with intra-pancreatic fat deposition in healthy individuals and people with new-onset prediabetes/diabetes after acute pancreatitis. Diabetes Obes Metab. 2019;21(2):417-423.
doi pubmed - Singh RG, Nguyen NN, Cervantes A, Kim JU, Stuart CE, Petrov MS. Circulating levels of lipocalin-2 are associated with fatty pancreas but not fatty liver. Peptides. 2019;119:170117.
doi pubmed - Pendharkar SA, Salt K, Plank LD, Windsor JA, Petrov MS. Quality of life after acute pancreatitis: a systematic review and meta-analysis. Pancreas. 2014;43(8):1194-1200.
doi pubmed - Pendharkar SA, Petrov MS. Bringing patient-centered care to the fore in diseases of the pancreas. Gastroenterol Res Pract. 2015;2015:459214.
doi pubmed
This article is distributed under the terms of the Creative Commons Attribution Non-Commercial 4.0 International License, which permits unrestricted non-commercial use, distribution, and reproduction in any medium, provided the original work is properly cited.
Journal of Clinical Medicine Research is published by Elmer Press Inc.