Journal of Clinical Medicine Research, ISSN 1918-3003 print, 1918-3011 online, Open Access
Article copyright, the authors; Journal compilation copyright, J Clin Med Res and Elmer Press Inc
Journal website http://www.jocmr.org

Original Article

Volume 12, Number 6, June 2020, pages 377-388


Associations Between Cannabis Use, Abdominal Fat Phenotypes and Insulin Traits

Figures

Figure 1.
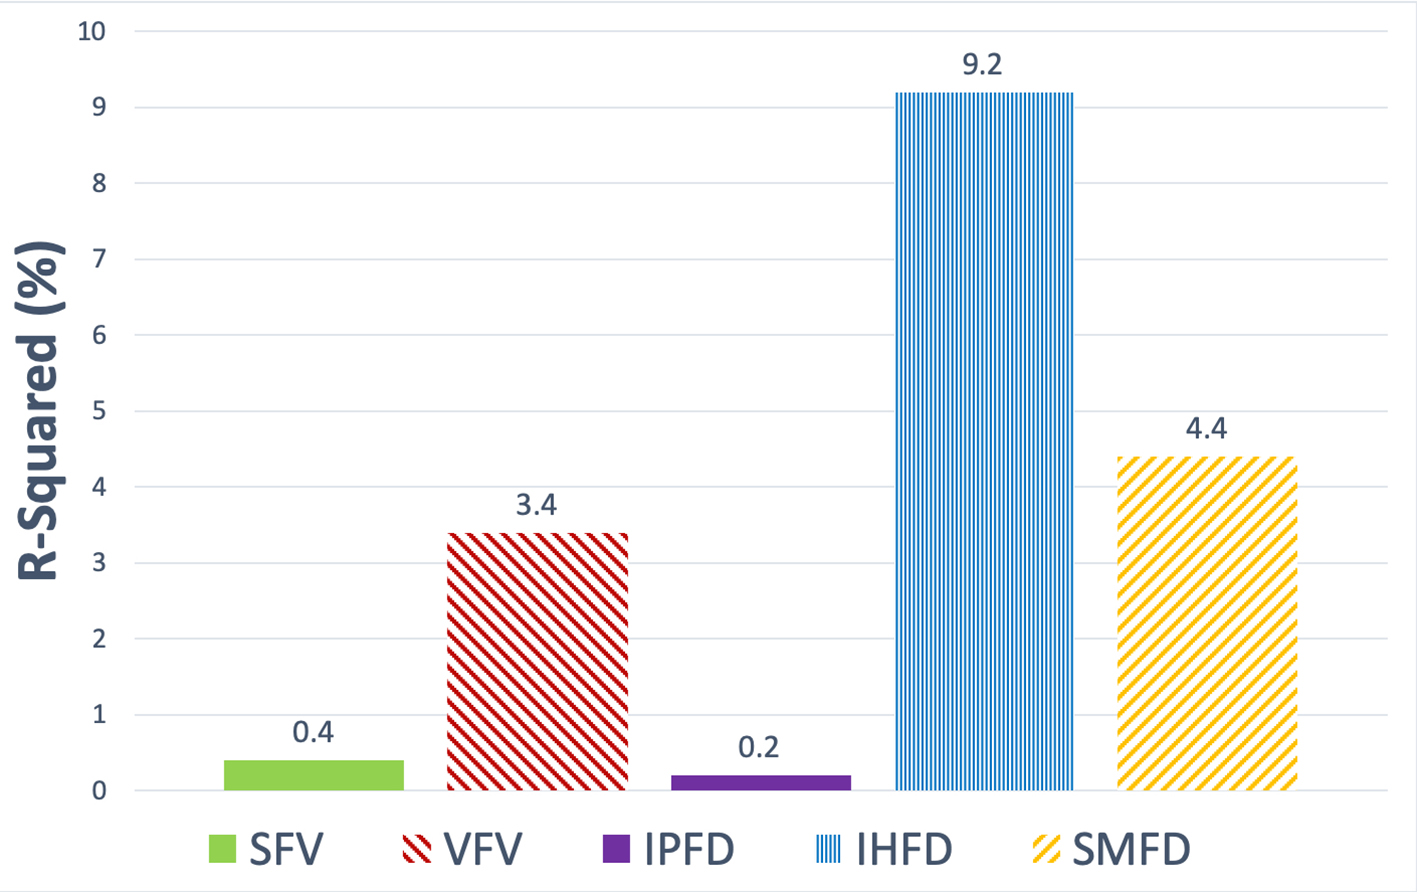
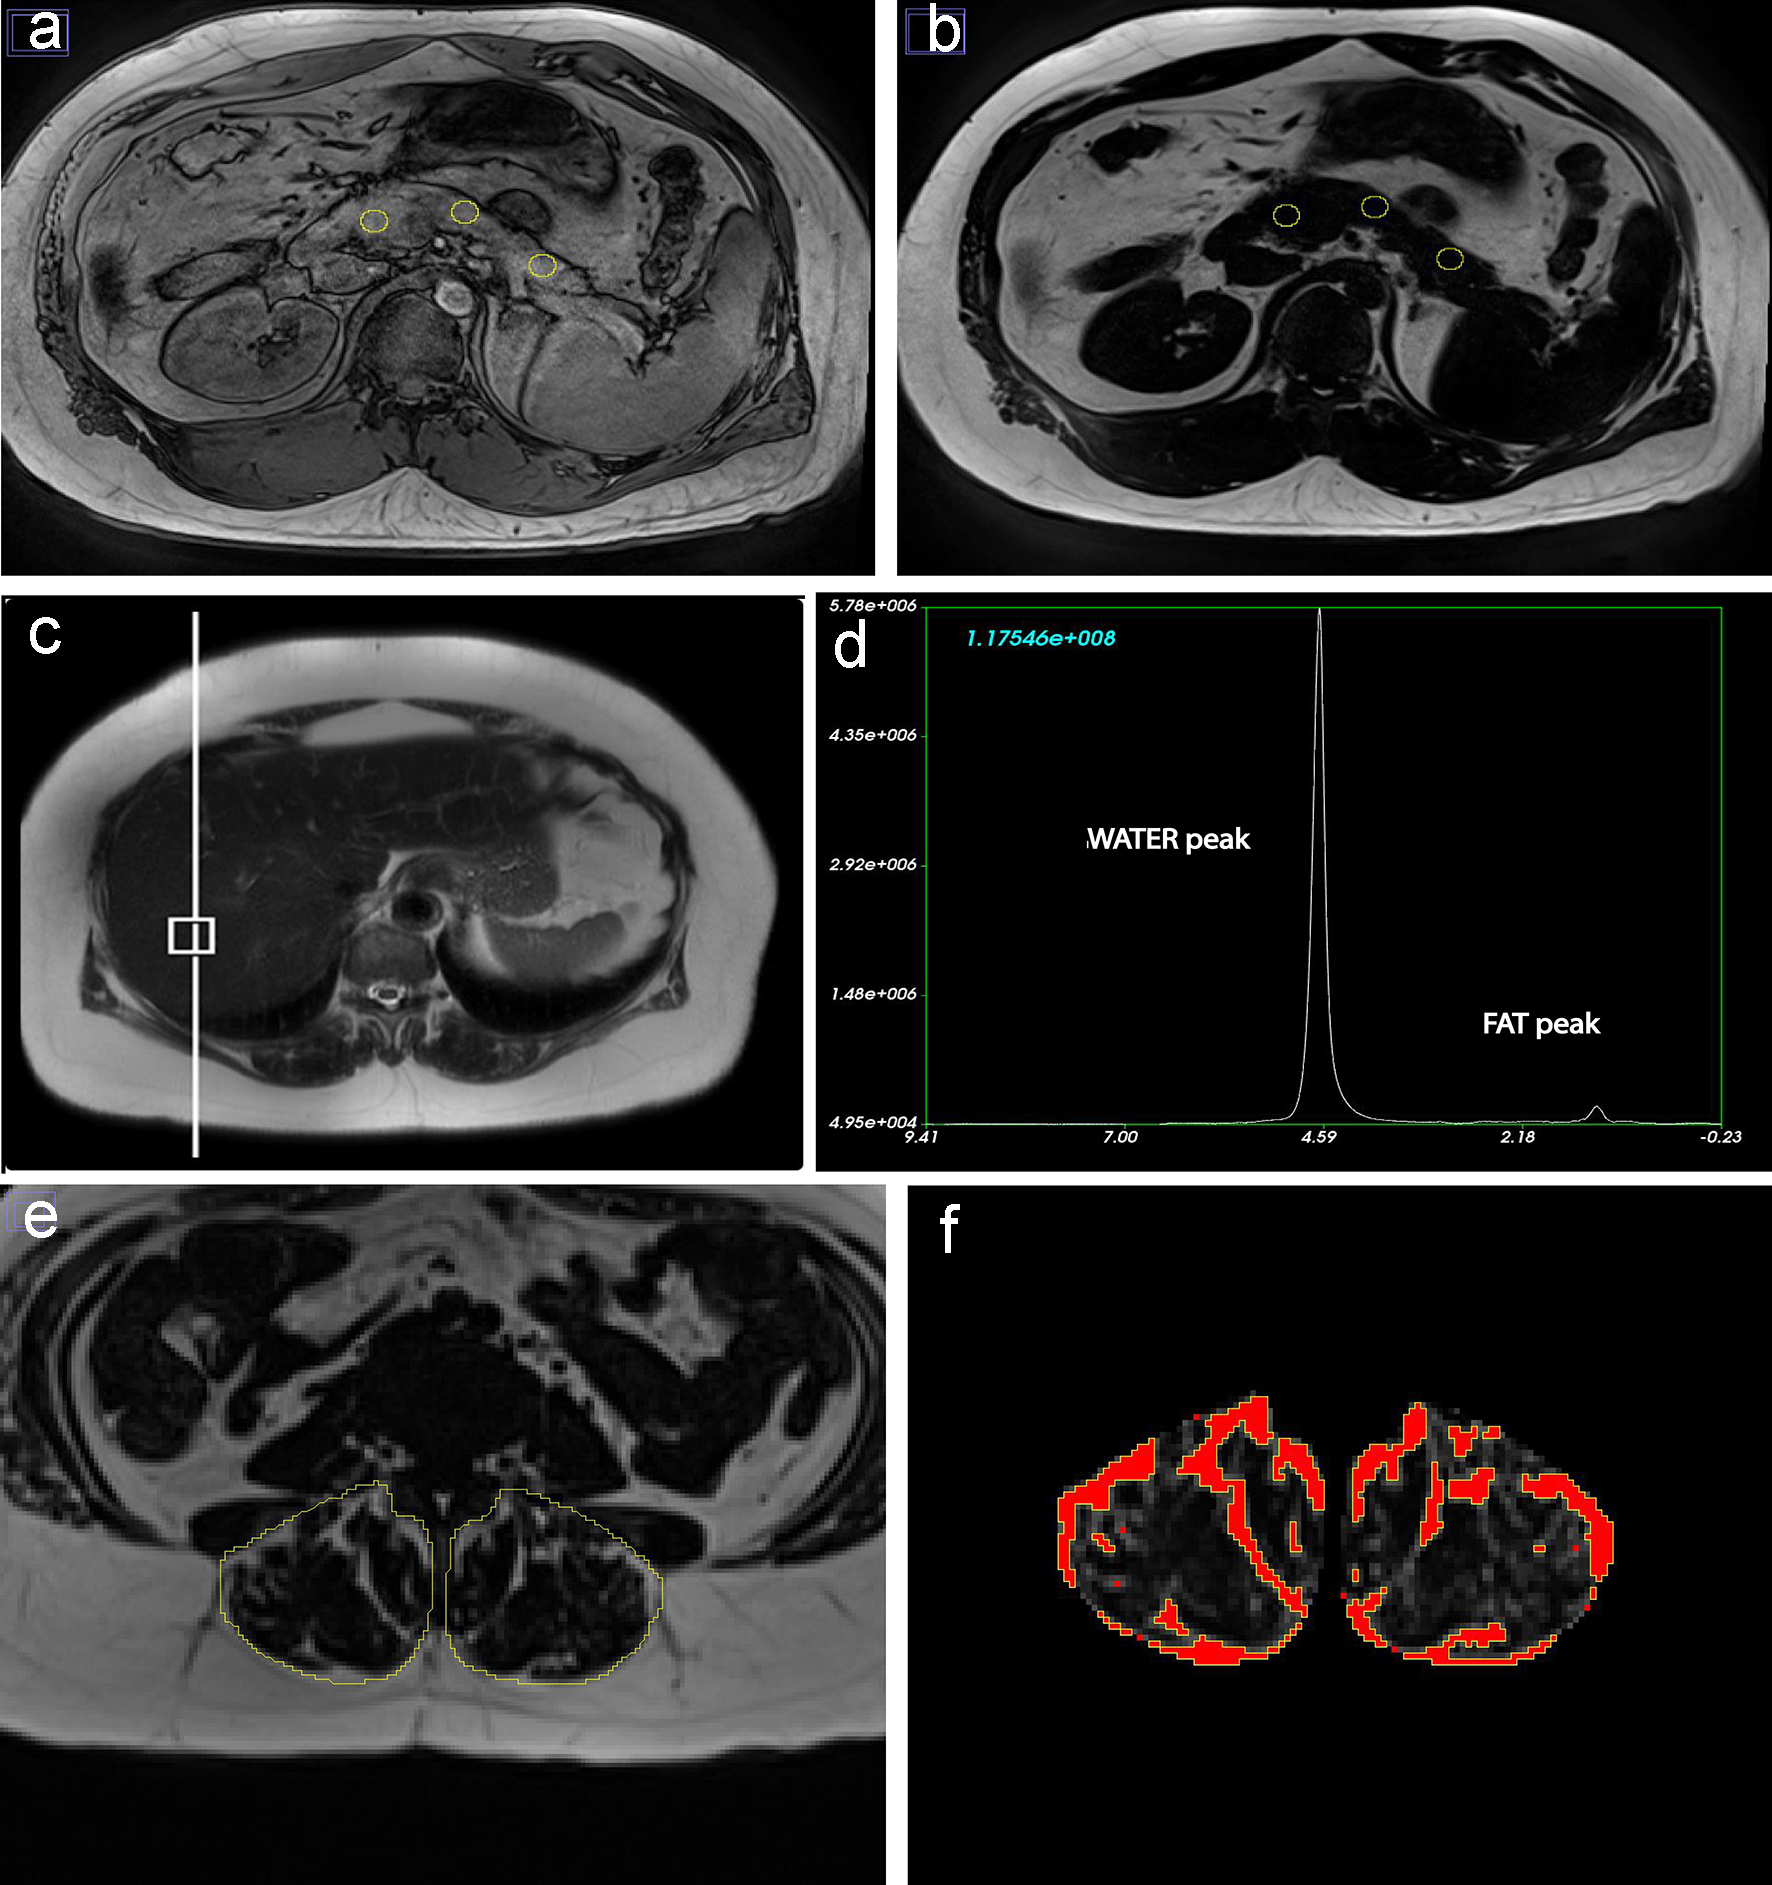
Figure 1. Fat phenotypes measurements for a 78-year-old European man who was never smoker and had low-to-moderate average alcohol consumption. (a, b) Intra-pancreatic fat deposition measurement by region of interest placement in the head, body and tail of the pancreas on out-of-phase and fat images. (c, d) Intra-hepatic fat deposition measurement with placement of the voxel within the liver and spectroscopy data using fat and water signals collected at the time of scan acquisition. (e, f) Skeletal muscle fat deposition measurement with selection of total erector spinae muscle area and quantification of fat pixels using the thresholding function of ImageJ.
Figure 2.
Figure 2. Contribution of cannabis use to variance in each of the fat phenotypes in the study cohort. Data are presented as the R2 metric (%). SFV: subcutaneous fat volume; VFV: visceral fat volume; IPFD: intra-pancreatic fat deposition; IHFD: intra-hepatic fat deposition; SMFD: skeletal muscle fat deposition.

Tables

Table 1. Baseline Characteristics of the Study Cohort
 
CharacteristicsNever cannabis usersNon-regular cannabis usersRegular cannabis usersP-value
Data are presented as median and interquartile range or frequency counts and percentages. BMI: body mass index; HbA1c: glycated hemoglobin.
No. of individuals91218
Age, years58 (47 - 69)52 (43 - 61)54 (45 - 63)0.015
Sex0.203
  Men59 (64.8%)17 (81%)7 (87.5%)
  Women32 (35.2%)4 (19%)1 (12.5%)
BMI, kg/m226.8 (22.3 - 31.3)27.9 (24.9 - 30.9)34.3 (30.3 - 38.3)0.170
Ethnicity0.092
  European40 (44%)10 (47.6%)1 (12.5%)
  Maori14 (15.4%)6 (28.6%)4 (50%)
  Pacific Islander2 (2.1%)01 (12.5%)
  Asian16 (17.6%)3 (14.3%)0
  Other19 (20.9%)2 (9.5%)2 (25%)
HbA1c, mmol/mol39 (36 - 42)37 (34 - 40)35 (33 - 37)0.293
Insulin, mU/L9.80 (6.23- 16.38)12.0 (6.25 - 17.5)12.9 (5.35 - 14.2)0.072
C-peptide, nmol/L0.57 (0.40 - 0.83)0.58 (0.43 - 0.92)0.48 (0.22 - 0.61)0.108
Diabetes status0.437
  Normoglycemia65 (71.4%)15 (71.4%)5 (62.5%)
  Prediabetes19 (20.9%)5 (23.8%)3 (37.5%)
  Diabetes5 (5.5%)1 (4.76%)0 (0%)
Physical activity (n = 96)0.049
  Inactive (< 2.5 h/week)16 (22.5%)7 (33.3%)4 (66.7%)
  Active (> 2.5 h/week)55 (77.5%)12 (66.7%)2 (33.3%)
Tobacco smoking0.024
  Never44 (48.4%)3 (10.4%)0
  Former30 (33.0%)11 (51.7%)4 (50%)
  Light8 (8.8%)4 (20.7%)2 (25%)
  Moderate-heavy9 (9.8%)3 (17.2%)2 (25%)
Alcohol consumption (n = 113)0.192
  None (0 g/day)28 (33.3%)9 (44.8%)4 (50%)
  Low-moderate (< 40 g/day)44 (52.4%)9 (34.5%)1 (12.5%)
  Excess (≥ 40 g/day)12 (14.3%)3 (20.7%)3 (37.5%)


Table 2. Associations Between Cannabis Use and the Studied Fat Phenotypes
 
Fat phenotypeCannabis useMean ± SDModel 1Model 2Model 3
B95% CIP-valueB95% CIP-valueB95% CIP-value
LowerUpperLowerUpperLowerUpper
Model 1 was unadjusted. Model 2 was adjusted for age, sex and ethnicity. Model 3 was adjusted for age, sex, ethnicity, HbA1c level, tobacco smoking, alcohol consumption and physical activity. SD: standard deviation; B: beta coefficient; CI: confidence interval.
Subcutaneous fat volume, cm3Never2,769 ± 1,421RefRefRefRefRefRefRefRefRefRefRefRef
Non-regular2,928 ± 266-0.008-759.8706.90.943-0.043-911.6617.30.702-0.066-1037.0583.50.579
Regular4,061 ± 1,6440.246174.32467.10.0240.180-190.42118.90.1000.143-496.12031.90.230
Visceral fat volume, cm3Never2,390 ± 1,134RefRefRefRefRefRefRefRefRefRefRefRef
Non-regular2,190 ± 3500.006-596.7631.70.955-0.032-674.7495.90.762-0.028-702.8545.30.802
Regular2,522 ± 1,6530.072-647.41272.90.5190.048-674.81093.40.6390.023-872.31074.70.836
Intra-pancreatic fat deposition, %Never9.7 ± 1.7RefRefRefRefRefRefRefRefRefRefRefRef
Non-regular9.9 ± 1.7-0.070-1.370.710.529-0.028-1.240.970.811-0.046-1.390.960.714
Regular9.1 ± 1.80.007-1.531.630.9520.034-1.381.870.7640.032-1.562.020.798
Intra-hepatic fat deposition, %Never9.2 ± 8.4RefRefRefRefRefRefRefRefRefRefRefRef
Non-regular7.2 ± 2.00.097-2.005.420.3610.096-2.435.830.4150.069-2.885.320.554
Regular12.6 ± 7.80.3363.4515.030.0020.3703.9616.390.0020.3132.2814.960.008
Skeletal muscle fat deposition, %Never16.1 ± 5.0RefRefRefRefRefRefRefRefRefRefRefRef
Non-regular8.4 ± 1.9-0.147-6.201.190.1810.070-1.934.320.4480.085-1.954.840.399
Regular11.3 ± 5.5-0.135-9.382.160.2170.017-4.285.160.8530.030-4.486.100.760


Table 3. Associations Between Cannabis Use and the Studied Insulin Traits
 
Insulin traitsCannabis useMean ± SDModel 1Model 2Model 3
B95% CIP-valueB95% CIP-valueB95% CIP-value
LowerUpperLowerUpperLowerUpper
Model 1 was unadjusted. Model 2 was adjusted for age, sex and ethnicity. Model 3 was adjusted for age, sex, ethnicity, HbA1c level, tobacco smoking, alcohol consumption and physical activity. SD: standard deviation; B: beta coefficient; CI: confidence interval.
Indices of insulin sensitivity
  HOMA-IS (fasting)Never0.68 ± 0.42RefRefRefRefRefRefRefRefRefRefRefRef
Non-regular0.61 ± 0.35-0.020-0.5360.4800.9110.002-0.5940.5990.992-0.253-0.9910.2880.266
Regular0.45 ± 0.27-0.079-0.7450.4800.6620.064-0.7000.9130.7880.038-0.7390.8860.870
  Raynaud index (fasting)Never3.30 ± 2.56RefRefRefRefRefRefRefRefRefRefRefRef
Non-regular9.28 ± 20.770.281-0.7915.380.0760.3741.1318.280.0280.234-2.6414.770.165
Regular1.99 ± 1.71-0.054-26.7612.330.7280.031-14.0216.980.847-0.038-16.3012.670.800
  Matsuda index (post-prandial)Never0.72 ± 0.53RefRefRefRefRefRefRefRefRefRefRefRef
Non-regular0.74 ± 0.35-0.032-0.7320.6090.854-0.034-0.8340.7020.861-0.243-1.2620.3260.236
Regular0.46 ± 0.38-0.072-0.9760.6430.3660.032-0.9661.1110.8870.001-1.0071.0050.999
Indices of insulin secretion
  HOMA-β (fasting)Never142.6 ± 75.2RefRefRefRefRefRefRefRefRefRefRefRef
Non-regular223.8 ± 134.60.212-31.78126.420.2320.089-70.14109.810.6540.334-19.01167.790.112
Regular155.9 ± 44.30.167-50.49140.200.3450.115-90.79152.590.6060.167-72.25162.240.434
  Insulinogenic index 30’ (post-prandial)Never0.66 ± 1.27RefRefRefRefRefRefRefRefRefRefRefRef
Non-regular-0.03 ± 0.25-0.128-2.8231.4750.524-0.096-3.0362.0270.6810.046-3.0753.5550.879
Regular1.91 ± 0.76-0.026-2.2842.0150.898-0.145-3.7562.2370.602-0.025-3.7513.4850.939
  Insulinogenic index 60’ (post-prandial)Never0.53 ± 1.12RefRefRefRefRefRefRefRefRefRefRefRef
Non-regular0.28 ± 0.72-0.156-2.2030.9800.433-0.350-3.0320.2980.1010.085-3.4910.6340.399
Regular1.76 ± 1.490.4080.0103.1870.0491.0161.6206.3300.0031.0911.6766.8550.004