

| Journal of Clinical Medicine Research, ISSN 1918-3003 print, 1918-3011 online, Open Access |
| Article copyright, the authors; Journal compilation copyright, J Clin Med Res and Elmer Press Inc |
| Journal website http://www.jocmr.org |
Original Article
Volume 11, Number 6, June 2019, pages 401-406
Characteristics of Gut Microbiota in Patients With Diabetes Determined by Data Mining Analysis of Terminal Restriction Fragment Length Polymorphisms
Yuta Nakamuraa, Yoshio Nagaia, f, Toshio Kobayashib, Kentaro Furukawac, Yoichi Oikawad, e, Akira Shimadae, Yasushi Tanakaa
aDivision of Metabolism and Endocrinology, Department of Internal Medicine, St. Marianna University School of Medicine, 2-16-1, Sugao, Miyamae-ku, Kawasaki, Kanagawa 216-8511, Japan
bMiyagi University, Sendai, Miyagi 982-0215, Japan
cFurukawa Hospital, Yokohama, Kanagawa 221-0021, Japan
dDepartment of Internal Medicine, Tokyo Saiseikai Central Hospital, Tokyo 108-0073, Japan
eDepartment of Endocrinology and Diabetes, Saitama Medical University, Iruma-gun, Saitama 350-0495, Japan
fCorresponding Author: Yoshio Nagai, Division of Metabolism and Endocrinology, Department of Internal Medicine, St. Marianna University School of Medicine, 2-16-1, Sugao, Miyamae-ku, Kawasaki, Kanagawa 216-8511, Japan
Manuscript submitted February 19, 2019, accepted April 9, 2019
Short title: Gut Microbiota in Diabetes
doi: https://doi.org/10.14740/jocmr3791
| Abstract | ▴Top |
Background: This study was performed to clarify whether gut microbiota obtained from fecal samples could identify the type of diabetes in patients of each gender by using a combination of terminal restriction fragment length polymorphism (T-RFLP) analysis and data mining.
Methods: A cross-sectional study was performed at three centers. Fecal samples were collected from 12 Japanese patients with type 1 diabetes mellitus (T1D), 18 patients with type 2 diabetes mellitus (T2D), and 31 subjects without diabetes mellitus (non-DM). Amplification of fecal 16S rRNA was carried out. After digestion of the amplification products with restriction enzymes (AluI, BslI, HaeIII, and MspI), terminal restriction fragments (T-RFs) of DNA were detected. A data mining algorithm (classification and regression tree (CART) modeling system) provides a decision tree that classifies subjects into various groups according to pre-assigned characteristics.
Results: Among men, the error rate was 2.4% with MspI, while error rates were 0.0% with other restriction enzymes. Among women, the error rate was 0.0% with all restriction enzymes. The operational taxonomic units (OTUs) incorporated into the decision tree differed between men and women.
Conclusions: We were able to classify the 16SrRNA gene amplification products obtained from fecal samples of T1D patients, T2D patients, and non-DM subjects with a high level of precision by combining T-RFLP analysis and data mining. Specific gut microbiota patterns were found for T1D and T2D patients, as well as a sex difference of the patterns.
Keywords: Data mining; Diabetes; Gut microbiota; T-RFLP analysis
| Introduction | ▴Top |
Gut microbiota are increasingly recognized as having an important role in regulation of energy homeostasis and the immune system [1], and analysis of gut microbiota is becoming instrumental for assessment of the etiology and pathogenesis of some diseases, especially inflammatory bowel disease [2, 3]. The human gut contains approximately 100 trillion bacteria, including more than 1,000 different bacterial species [4, 5]. Conventional culture techniques can only detect 30% of the total gut microbiota [6], resulting in difficulty with performing meaningful analysis.
Recently, a new method has been proposed for analyzing the gut microbiota. In the field of molecular microbiology, identification of bacteria by high throughput DNA amplification and subsequent 16S rRNA gene sequencing has been used as a replacement for conventional culture techniques [7], and next-generation sequencing has been suggested as a suitable tool for studying the human microbiota [8]. However, the high cost and complexity of such methods are major obstacles to widespread adoption.
Terminal restriction fragment length polymorphisms (T-RFLP) analysis is another molecular biological method that could be used to obtain quantitative data on the gut microbiota [9]. This method is based on enzymatic digestion of PCR products and is suitable for handling many samples cost-effectively, although it not useful for identifying bacterial species. Thus, research using T-RFLP analysis needs to be based on a new concept. Data mining is a process of sorting and analyzing large data sets to identify patterns and establish relationships. This technique could allow us to recognize even unknown bacteria from certain patterns. Using a data mining approach, we were previously successful in identifying smokers by examining fecal samples from 92 Japanese men [10].
Diabetes mellitus is a metabolic disorder characterized by chronic hyperglycemia due to insufficient action of insulin and there are two major types. Type 1 diabetes (T1D) is caused by autoimmune destruction of pancreatic β cells, whereas type 2 diabetes (T2D) arises from the combination of relatively insufficient insulin secretion and obesity-associated insulin resistance.
A previous study of gender differences in the gut microbiota showed that the microbiota may regulate sex hormone levels and influence individual susceptibility to autoimmunity [11].
Based on the above considerations, this study was performed to clarify whether gut microbiota obtained from fecal samples could identify the type of diabetes in patients of each gender by using a combination of T-RFLP analysis and data mining.
| Methods | ▴Top |
Study design
A cross-sectional study was performed at three centers in Japan: St. Marianna University School of Medicine Hospital (Kawasaki, Japan), Tokyo Saiseikai Central Hospital (Tokyo, Japan), and Furukawa Hospital (Yokohama, Japan).
Subjects
Between April 2015 and December 2016, 12 Japanese patients with T1D, 18 patients with T2D, and 31 subjects without diabetes mellitus (non-DM) were enrolled in this study. The subjects included 37 men (four patients with T1D, 14 patients T2D, and 19 non-DM subjects) and 24 women (eight patients with T1D, four patients with T2D, and 12 non-DM subjects). Diabetes was diagnosed and classified as type 1 or type 2 by diabetologists. The exclusion criteria for this study were as follows: 1) Antimicrobial therapy; 2) Prior gastrointestinal surgery; and 3) Severe liver or kidney disease. The non-DM group was recruited from among persons undergoing regular health screening tests.
This study was conducted in accordance with the ethical principles of the Declaration of Helsinki, and was approved by the ethics committee of St. Marianna University School of Medicine. All patients gave written informed consent prior to participation.
Materials
Fecal samples were collected from the subjects and bacterial DNA was isolated from 100 mg of feces using the method described by Takahashi et al [12]. Amplification of fecal 16S rRNA was carried out as described by Nagashima et al [13]. After digestion of the amplification products with restriction enzymes (AluI, BslI, HaeIII, and MspI), terminal restriction fragments (T-RFs) of DNA were detected. T-RF lengths were determined with an ABI PRISM® 3130xl Genetic Analyzer (Applied Biosystems, Foster City, CA, USA). As the apparent size of identical T-RFs may vary by 1 - 2 bp among different gels and/or different lanes of the same gel, major T-RFs having a size within 1 - 2 bp were summarized as operational taxonomic units (OTUs). Each OTU was designated on the basis of the restriction enzyme and restriction fragment length (bp), for example the AluI 44 bp OTU was abbreviated as A44. OTUs were quantified by determining the percentage of each individual OTU relative to the total OTU area, and this was expressed as the peak percent area under the curve (% area under the curve (AUC)).
Statistical analysis
A data mining algorithm (classification and regression tree (CART) modeling system), which is the usual method of data mining, provides a decision tree that classifies subjects into various groups according to pre-assigned characteristics. CART divides subjects into two subsets by comparing the Gini coefficient according to the OTU data, such that the subjects within each subset are more homogeneous than in the previous subset. The CART system is flexible and allows unequal misclassification costs to be considered, unlike the other data mining systems. A major point of data mining and the decision tree thus constructed is that a single selected OTU is used for each step of the tree. The default setting of the CART system allows a decision tree to grow up to five steps. Balance nodes [14], which are boosting and duplicating a minor data, are used to correct imbalances in the dataset, which readily develop with higher nominal partitions, and we confirmed that more accurate results could be obtained with the specified test criteria. If necessary, balancing is carried out by boosting infrequent values at the time of decision tree construction.
| Results | ▴Top |
Baseline characteristics of the subjects are shown in Table 1. In the present study, all patients diagnosed with T1D showed an acute-onset pattern of hyperglycemia and were positive for glutamic acid decarboxylase (GAD) antibody by radioimmune assay. The median (interquartile range: IQR) age of the T1D group, T2D group, and non-DM group was 46 (38 - 60) years, 45 (40 - 63) years, and 47 (41 - 53) years, respectively (P = 0.833). Body mass index (BMI) was 21.7 (19.8 - 23.8), 28.9 (25.0 - 32.0), and 22.0 (19.8 - 24.8) kg/m2, respectively (P < 0.001), being higher in the T2D group than in the other groups. The estimated duration of diabetes was 4.0 (1.0 - 5.0) years in the T1D group and 3.0 (1.0 - 4.3) years in the T2D group (P = 0.232). Hemoglobin A1c (HbA1c) was 7.5% (6.7-8.6%) and 10.1% (9.2-12.0%), respectively (P < 0.001), being higher in the T2D group than in T1D group. Antidiabetic drugs are also shown in Table 1.
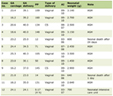 Click to view | Table 1. Characteristics of the Subjects (Median (IQR)) |
Data mining provided the decision trees displayed in Figure 1. Figure 1a, which was applied the balance node (i.e. using T1D twice), shows the decision tree obtained by using the restriction enzyme BslI in men. Node 0 (at the left side of the tree) was divided into nodes 1 and 2 by using B366 with a cut-off value of 1.334. In node 1 (B366 ≤ 1.334), all nine subjects were from the non-DM group, while node 2 (B366 > 1.334) included eight patients with T1D, 14 patients with T2D, and 10 subjects from the non-DM group. After performing five similar steps, all of the subjects were classified and the decision tree was constructed. Six of the eight T1D patients were classified at node 8 (B366 > 1.334, B749 > 3.032, and B968 > 0.980), while 12 of 14 T2D patients were classified at node 9 (B366 > 1.334, B749 ≤ 3.032, B338 ≤ 1.613, and B494 ≤ 8.932). In the T1D group, six patients were classified at node 8 and two were classified at node 12. In the T2D group, 12 patients were classified at node 9 and two were classified at node 14. In the non-DM group, nine subjects were classified at node 1, three were classified at node 6, one was classified at node 10, and six were classified at node 13.
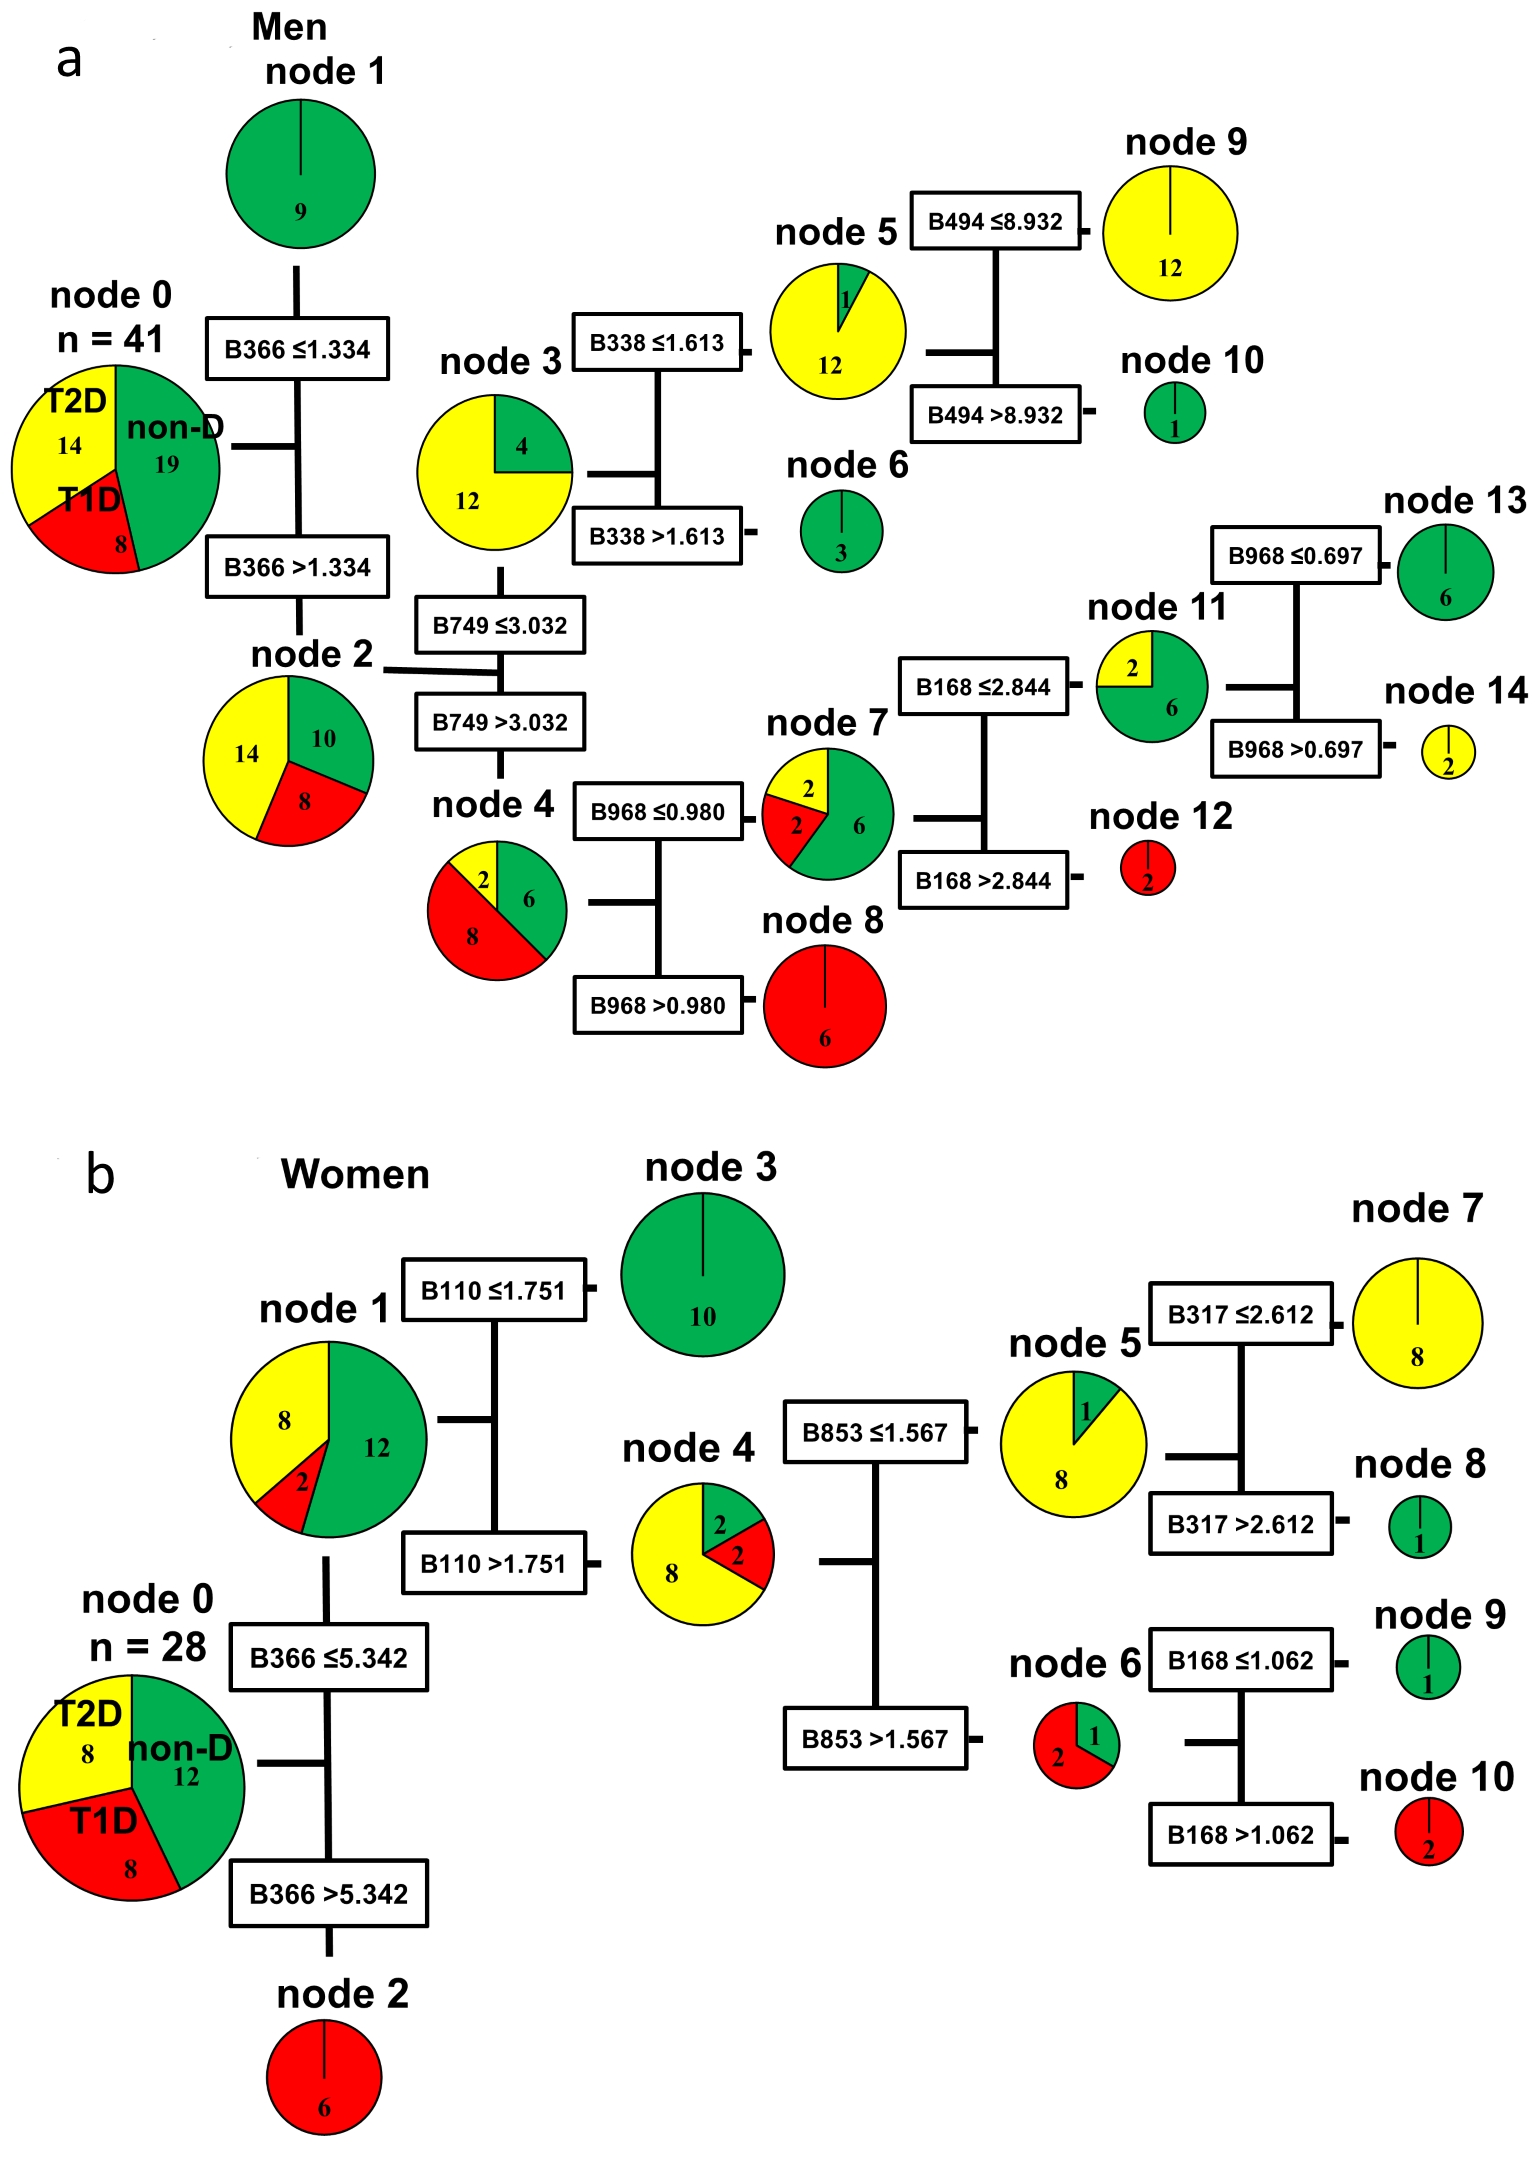 Click for large image | Figure 1. Decision trees created by the classification and regression tree (CART) method based on BslI digestion of 16SrRNA gene amplification products from fecal samples. Each operation taxonomic unit (OTU) is named by the combination of a restriction enzyme and restriction fragment length (bp). For example, the BslI 366 bp OTU is designated as B366. The cut-off value for each OTU was calculated from the OTU data of all subjects by the CART method using the Gini coefficient. Similar steps were repeated to construct the decision tree. Node 0 (at the left side of the decision tree) is the root node, namely the starting point for construction of the tree. The decision tree pathways indicate the species, quantities, and OTUs used to divide the different groups of subjects. (a) Decision tree for men. (b) Decision tree for women. non-DM: non-diabetes mellitus group; T1D: type 1 diabetes mellitus group; T2D: type 2 diabetes mellitus group. |
Figure 1b, which was applied the balance node (i.e. using T2D twice), shows the results obtained in women using the restriction enzyme BslI. Node 0 was divided into nodes 1 and 2 by using B366 with a cut-off value of 5.342. Node 1 (B366 ≤ 5.342) contained two patients with T1D, eight patients with T2D, and 12 non-DM subjects, while node 2 (B366 > 5.342) contained six T1D patients. The decision tree for women only required four similar steps to classify all of the female subjects, so it was simpler than the decision tree for men. In the T2D group, all eight patients were classified at node 7 (B366 ≤ 5.342, B110 > 1.751, B853 ≤ 1.567, and B317 ≤ 2.612). In the T1D group, six patients were classified at node 2 and two patients were classified at node 10. In the non-DM group, 10 subjects were classified at node 3, one was classified at node 8, and one was classified at node 9.
The results of decision tree analysis using four restriction enzymes are shown in Table 2. Among men, the error rate was 2.4% with MspI, while error rates were 0.0% with other restriction enzymes. Among women, the error rate was 0.0% with all restriction enzymes. The OTUs incorporated into the decision tree differed between men and women. In both men and women, node 0 was divided into nodes 1 and 2 by using B366. But the cut-off values were different between them (1.334 in men, 5.342 in women). Even after the second step, men and women showed different OTUs and the cut-off values (Fig. 1a, b). As shown in Table 2, the OTUs incorporated with other restriction enzymes were also totally different between men and women.
Click to view | Table 2. Comparison of the Results Obtained With Each Restriction Enzyme |
| Discussion | ▴Top |
In the present study, the combination of T-RFLP analysis and data mining was able to precisely classify the 16S rRNA gene amplification products obtained from fecal samples of the non-DM, T1D, and T2D groups. To our knowledge, no widely available data mining algorithm has previously been able to classify the type of diabetes by analysis of fecal samples. Our results suggest that non-DM persons, T1D patients, and T2D patients have specific gut microbiota patterns. It is interesting to note that T1D and T2D patients showed different patterns, even though both groups had metabolic disorders associated with hyperglycemia. Pathophysiology of T1D might not be homogeneous; therefore, we included acute onset T1D with GAD antibody and relatively recent onset (disease duration < 5 years) in this study. The reason why we could see clear difference between T1D and controls may be due to focusing on this “pure” population in T1D.
A previous study of T1D suggested that human gut microbiota have a role in the onset of this autoimmune disorder in young children with a high genetic risk profile [15]. A striking result of that study was the increase of Bacteroidetes and decline of Firmicutes in the gut microbiome over time as autoimmunity developed. In the present study, most subjects with T1D were assigned to the node with a higher OTU of B366 which contains Bacteroidetes, indicating that our findings were consistent with the previous report [15]. It is possible that our method could become a bacterial marker for early diagnosis of T1D or for predicting its onset among persons with a high risk of developing T1D.
Many studies have investigated associations between the gut microbiota and T2D, but few have found a causal relationship between gut microbiota and the onset of T2D. The changes of gut microbiota have been different in every study, suggesting that short-chain fatty acid (SCFA) or micro-inflammation might explain the association between gut microbiota and T2D [16, 17]. On the other hand, a decrease in SCFA is associated with intestinal barrier failure and translocation of lipopolysaccharide and gut bacteria into the circulation, leading to development of insulin resistance [18]. Changes of lipopolysaccharide and SCFA were not confirmed in the present study. However, the gut microbiota pattern which is characteristic of T2D may cause such changes.
Data mining by the CART method achieves reproducibility. After it has been used to create a decision tree, other individuals can be classified by applying the same process [19]. For example, a man would be classified at node 8 of Figure 1a if the OTUs of his gut microbiota digested by BslI showed B366 > 1.334, B749 > 3.032, and B968 > 0.980. In the present study, most men with T1D were classified at node 8 using BslI, suggesting that this gut microbiota pattern is characteristic of T1D. Accordingly, a male individual classified at node 8 may be likely to have T1D or an increased risk of developing it. Accordingly, it is possible that this method could be used to support the diagnosis of diabetes.
The main method currently employed for analysis of the gut microbiota is next generation sequencing. However, it has the weaknesses of ignoring unknown microbiota and high cost. We combined T-RFLP analysis with data mining in the present study, allowing us to recognize the overall pattern of gut microbiota and to evaluate the influence of unknown microbiota. In addition, the cost of our method is relatively low.
This study had several limitations. First, the number of the subjects was small. Second, the subjects were all Japanese, so we were unable to assess the influence of ethnic differences. Therefore, further large-scale studies will be needed to confirm our results.
In conclusion, we were able to classify the 16SrRNA gene amplification products obtained from fecal samples of T1D patients, T2D patients, and non-DM subjects with a high level of precision by combining T-RFLP analysis and data mining. Specific gut microbiota patterns were found for T1D and T2D patients, as well as a sex difference of the patterns.
Acknowledgments
None to declare.
Financial Disclosure
None to declare.
Conflict of Interest
The authors declare no conflict of interest.
Informed Consent
Written informed consent was obtained from all patients.
Author Contributions
Y Nakamura participated in data collection and wrote the manuscript; Y Nagai designed the study, participated in data collection, and edited the manuscript; TK was involved in statistical analysis and edited the manuscript; KF, YO, and AS participated in data collection and edited the manuscript; YT designed the study and edited the manuscript. All authors have approved the final version to be published.
| References | ▴Top |
- Musso G, Gambino R, Cassader M. Obesity, diabetes, and gut microbiota: the hygiene hypothesis expanded? Diabetes Care. 2010;33(10):2277-2284.
doi pubmed - Sartor RB. Microbial influences in inflammatory bowel diseases. Gastroenterology. 2008;134(2):577-594.
doi pubmed - Andoh A, Kobayashi T, Kuzuoka H, Tsujikawa T, Suzuki Y, Hirai F, Matsui T, et al. Characterization of gut microbiota profiles by disease activity in patients with Crohn's disease using data mining analysis of terminal restriction fragment length polymorphisms. Biomed Rep. 2014;2(3):370-373.
doi pubmed - Gill SR, Pop M, Deboy RT, Eckburg PB, Turnbaugh PJ, Samuel BS, Gordon JI, et al. Metagenomic analysis of the human distal gut microbiome. Science. 2006;312(5778):1355-1359.
doi pubmed - Neish AS. Microbes in gastrointestinal health and disease. Gastroenterology. 2009;136(1):65-80.
doi pubmed - Zoetendal EG, Vaughan EE, de Vos WM. A microbial world within us. Mol Microbiol. 2006;59(6):1639-1650.
doi pubmed - Woese CR, Kandler O, Wheelis ML. Towards a natural system of organisms: proposal for the domains Archaea, Bacteria, and Eucarya. Proc Natl Acad Sci U S A. 1990;87(12):4576-4579.
doi pubmed - Kim SW, Suda W, Kim S, Oshima K, Fukuda S, Ohno H, Morita H, et al. Robustness of gut microbiota of healthy adults in response to probiotic intervention revealed by high-throughput pyrosequencing. DNA Res. 2013;20(3):241-253.
doi pubmed - Sakamoto M, Hayashi H, Benno Y. Terminal restriction fragment length polymorphism analysis for human fecal microbiota and its application for analysis of complex bifidobacterial communities. Microbiol Immunol. 2003;47(2):133-142.
doi pubmed - Kobayashi T, Fujiwara K. Identification of heavy smokers through their intestinal microbiota by data mining analysis. Biosci Microbiota Food Health. 2013;32(2):77-80.
doi pubmed - Markle JG, Frank DN, Mortin-Toth S, Robertson CE, Feazel LM, Rolle-Kampczyk U, von Bergen M, et al. Sex differences in the gut microbiome drive hormone-dependent regulation of autoimmunity. Science. 2013;339(6123):1084-1088.
doi pubmed - Takahashi S, Tomita J, Nishioka K, Hisada T, Nishijima M. Development of a prokaryotic universal primer for simultaneous analysis of Bacteria and Archaea using next-generation sequencing. PLoS One. 2014;9(8):e105592.
doi - Nagashima K, Hisada T, Sato M, Mochizuki J. Application of new primer-enzyme combinations to terminal restriction fragment length polymorphism profiling of bacterial populations in human feces. Appl Environ Microbiol. 2003;69(2):1251-1262.
doi pubmed - Kobayashi T, Fujiwara K. Technical aspects of nominal partitions on accuracy of data mining classification of intestinal microbiota - comparison between 7 restriction enzymes. Biosci Microbiota Food Health. 2014;33(3):129-138.
doi pubmed - Giongo A, Gano KA, Crabb DB, Mukherjee N, Novelo LL, Casella G, Drew JC, et al. Toward defining the autoimmune microbiome for type 1 diabetes. ISME J. 2011;5(1):82-91.
doi pubmed - Byrne CS, Chambers ES, Morrison DJ, Frost G. The role of short chain fatty acids in appetite regulation and energy homeostasis. Int J Obes (Lond). 2015;39(9):1331-1338.
doi pubmed - Delzenne NM, Cani PD, Everard A, Neyrinck AM, Bindels LB. Gut microorganisms as promising targets for the management of type 2 diabetes. Diabetologia. 2015;58(10):2206-2217.
doi pubmed - Sato J, Kanazawa A, Ikeda F, Yoshihara T, Goto H, Abe H, Komiya K, et al. Gut dysbiosis and detection of "live gut bacteria" in blood of Japanese patients with type 2 diabetes. Diabetes Care. 2014;37(8):2343-2350.
doi pubmed - Emoto T, Yamashita T, Kobayashi T, Sasaki N, Hirota Y, Hayashi T, So A, et al. Characterization of gut microbiota profiles in coronary artery disease patients using data mining analysis of terminal restriction fragment length polymorphism: gut microbiota could be a diagnostic marker of coronary artery disease. Heart Vessels. 2017;32(1):39-46.
doi pubmed
This article is distributed under the terms of the Creative Commons Attribution Non-Commercial 4.0 International License, which permits unrestricted non-commercial use, distribution, and reproduction in any medium, provided the original work is properly cited.
Journal of Clinical Medicine Research is published by Elmer Press Inc.