Journal of Clinical Medicine Research, ISSN 1918-3003 print, 1918-3011 online, Open Access
Article copyright, the authors; Journal compilation copyright, J Clin Med Res and Elmer Press Inc
Journal website http://www.jocmr.org

Original Article

Volume 11, Number 6, June 2019, pages 401-406


Characteristics of Gut Microbiota in Patients With Diabetes Determined by Data Mining Analysis of Terminal Restriction Fragment Length Polymorphisms

Figure

Figure 1.
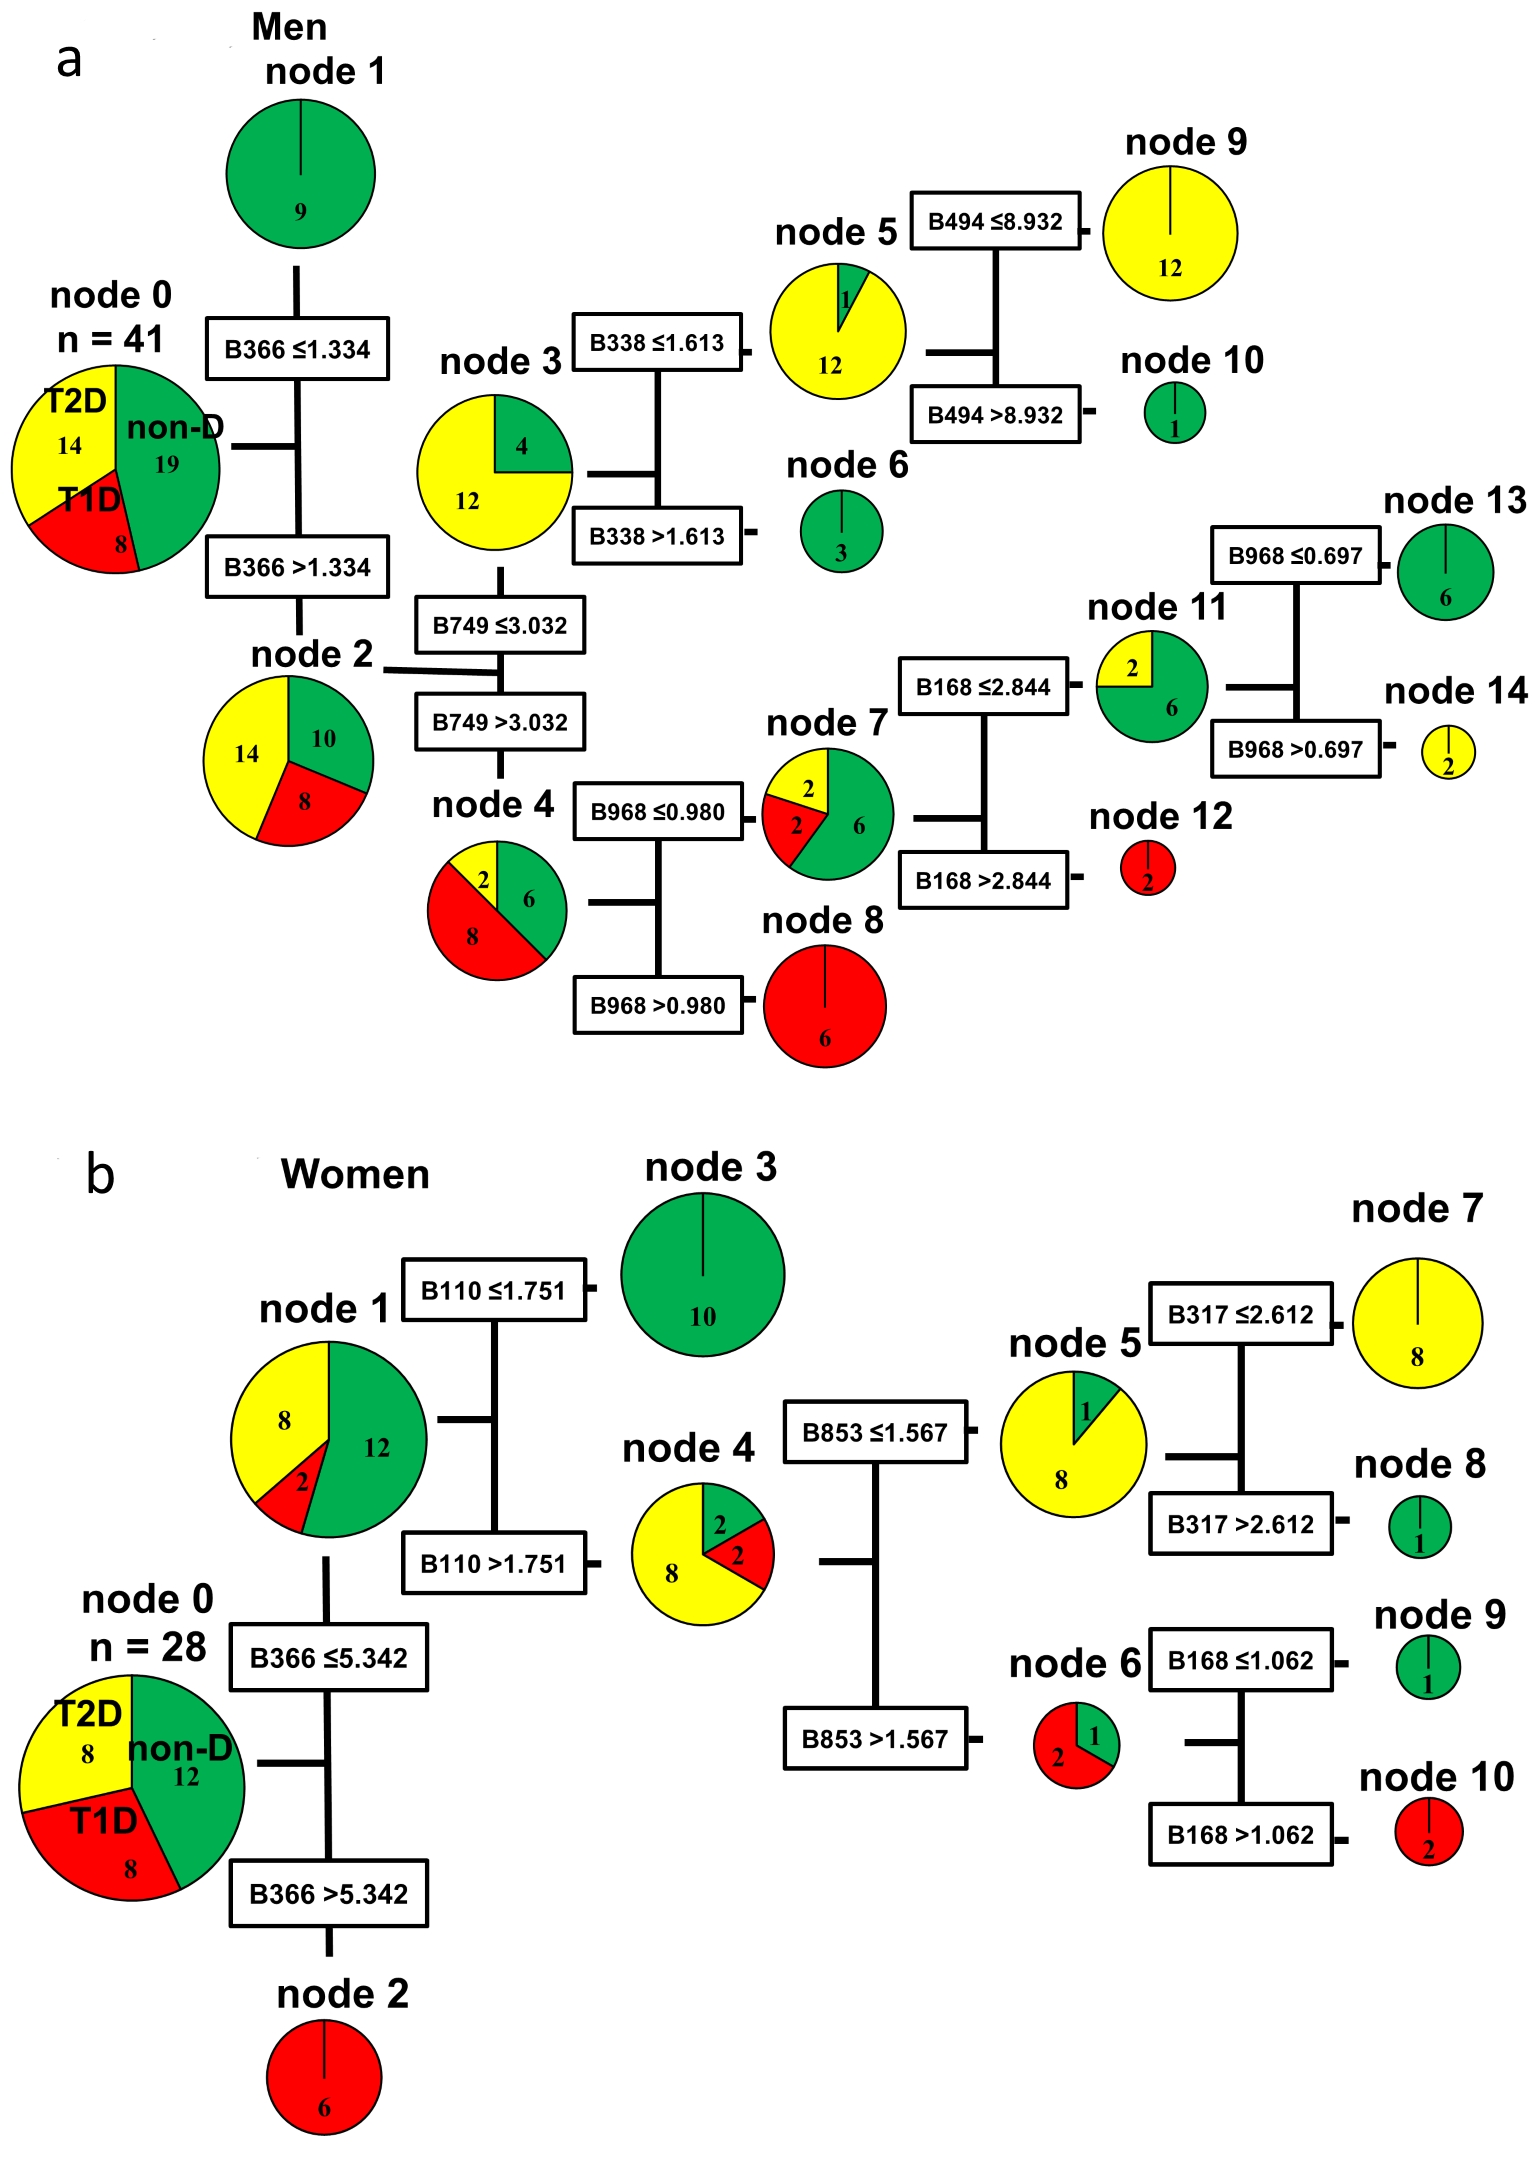
Figure 1. Decision trees created by the classification and regression tree (CART) method based on BslI digestion of 16SrRNA gene amplification products from fecal samples. Each operation taxonomic unit (OTU) is named by the combination of a restriction enzyme and restriction fragment length (bp). For example, the BslI 366 bp OTU is designated as B366. The cut-off value for each OTU was calculated from the OTU data of all subjects by the CART method using the Gini coefficient. Similar steps were repeated to construct the decision tree. Node 0 (at the left side of the decision tree) is the root node, namely the starting point for construction of the tree. The decision tree pathways indicate the species, quantities, and OTUs used to divide the different groups of subjects. (a) Decision tree for men. (b) Decision tree for women. non-DM: non-diabetes mellitus group; T1D: type 1 diabetes mellitus group; T2D: type 2 diabetes mellitus group.

Tables

Table 1. Characteristics of the Subjects (Median (IQR))
 
T1D groupT2D groupNon-DM group
IQR: interquartile range; T1D: type 1 diabetes mellitus; T2D: type 2 diabetes mellitus; non-DM: non-diabetes mellitus; BMI: body mass index; DM: diabetes mellitus; HbA1c: hemoglobin A1c; αGI: α-glucosidase inhibitor, DPP4-I: dipeptidyl peptidase-4 inhibitor; GLP-1RA: glucagon-like peptide-1 receptor agonist; SGLT2: sodium-glucose cotransporter 2 inhibitor. avs. T1D; bvs. T2D.
Number121831
Gender (women/men)8/44/1412/19
Age (years)46(38 - 60)45(40 - 63)47(41 - 53)P = 0.833
Weight (kg)52.5(51.0 - 66.8)73.8(68.0 - 92.1)a61(49.0 - 68.0)bP < 0.001
BMI (kg/m2)21.7(19.8 - 23.8)28.9(25.0 - 32.0) a2.0(19.8 - 24.8) bP < 0.001
Duration of DM (years)4.0(1.0 - 5.0)3.0(1.0 - 4.3)-P = 0.232
Neuropathy (+/-)0/121/17-
Retinopathy (+/-)0/122/16-
Nephropathy (stage 1/2/3/4/5)12/0/0/0/013/5/0/0/0-
HbA1c (%)7.5(6.7 - 8.6)10.1(9.2 - 12.0)-P < 0.001
Antidiabetic drugs
  Insulin1213
  Metformin113
  DPP4-I010
  αGI16
  GLP-1RA04
  Glinide02
  SGLT2-I01


Table 2. Comparison of the Results Obtained With Each Restriction Enzyme
 
Restriction enzymeSexBalance nodeErrorError rate (%)Dt first stepDt second stepDt steps
T2D: type 2 diabetes mellitus; T1D: type 1 diabetes mellitus; Dt: decision tree.
AluIWomenT2D × 20/280A216A233, A584
MenT1D × 20/410A830A819, A1794
BslIWomenT2D × 20/280B366B110, -4
MenT1D × 20/410B366-, B7495
HaeIIIWomenT2D × 20/280H58H93, -5
MenT1D × 20/410H45H160, -5
MspIWomenT2D × 20/280M494M494, M4763
MenT1D × 21/412.44M45M81, -5