

| Journal of Clinical Medicine Research, ISSN 1918-3003 print, 1918-3011 online, Open Access |
| Article copyright, the authors; Journal compilation copyright, J Clin Med Res and Elmer Press Inc |
| Journal website http://www.jocmr.org |
Original Article
Volume 12, Number 1, January 2020, pages 18-25
A Dashboard Prototype for Tracking the Impact of Diabetes on Hospital Readmissions Using a National Administrative Database
Timothy Wonga, Ethan Y. Brovmanb, Nikhilesh Raoc, Mitchell H. Tsaia, d, e, Richard D. Urmanb, f
aDepartment of Anesthesiology, University of Vermont College of Medicine, Burlington, VT, USA
bDepartment of Anesthesiology, Perioperative and Pain Medicine, Brigham and Women’s Hospital, Boston, MA, USA
cDexur Research and Analytics, New York, NY, USA
dDepartment of Orthopaedics and Rehabilitation, University of Vermont College of Medicine, Burlington, VT, USA
eDepartment of Surgery, University of Vermont College of Medicine, Burlington, VT, USA
fCorresponding Author: Richard D. Urman, Department of Anesthesiology, Perioperative, and Pain Medicine, Brigham and Women’s Hospital, 75 Francis St, Boston, MA 02115, USA
Manuscript submitted October 31, 2019, accepted December 3, 2019
Short title: Diabetes Dashboard
doi: https://doi.org/10.14740/jocmr4029
| Abstract | ▴Top |
Background: Over the past several decades, diabetes mellitus has contributed to a significant disease burden in the general population. Evidence suggests that patients with a coexisting diabetes diagnosis consume more hospital resources, and have higher readmission rates compared to those who do not. Against the backdrop of bundled-payment programs, healthcare systems cannot underestimate the importance of monitoring patient health information at the population level.
Methods: Using the data from the Centers for Medicare and Medicaid Services (CMS) administrative claims database, we created a dashboard prototype to enable hospitals to examine the impact of diabetes on their all-cause readmission rates and financial implications if diabetes was present at the index hospitalization. The technical design involved loading the relevant 10th revision of International Classification of Diseases (ICD-10) codes provided by the medical team and flagging diabetes patients at the claim. These patients were then tagged for readmissions within the same database. The odds ratios were determined based on data from two groups: those with diabetes at index hospitalization which include type 1 only, type 2 only, and type 1 and type 2 diabetes, plus those without diabetes at index hospitalization.
Results: The dashboard presents summary data of diabetes readmissions quality metrics at a national level. Users can visualize summary data of each state and compare odds ratios for readmissions as well as raw hospitalization data at their facility. Dashboard users can also view data classified by a diagnosis-related group (DRG) system. In addition to a “national” data view, for users who inquire about data specific to demographic regions, the DRG view can be further stratified at the state level or county level. At the DRG level, users can view data about the cost per readmissions for all index hospitalization with and without diabetes.
Conclusions: The dashboard prototype offers users a virtual interface which displays visual data for quick interpretation, monitors changes at a population level, and enables administrators to benchmark facility data against local and national trends. This is an important step in using data analytics to drive population level decision making to ultimately improve medical systems.
Keywords: Diabetes; Complications; Dashboard; Information systems; Admission; Morbidity
| Introduction | ▴Top |
In the USA, diabetes mellitus and associated complications represent a rapidly growing burden on both patients and the health care system. Despite advances in medical technology and medical management, diabetes still contributes to a significant disease burden. Over the two decades between 1990 and 2010, the number of adults living with diabetes more than tripled from 6.5 million to 20.7 million [1], and forecasting models have shown that the prevalence of diabetes will continue to increase over the next few decades [2-4] as 84 million Americans are estimated to be living with prediabetes in 2018.
Diabetes impacts patient morbidity, mortality and quality of life, and contributes to significant care costs for hospitals nationwide. According to the American Diabetes Association, the total economic costs attributed to the hospitalization of patients with diagnosed diabetes in the USA were estimated to be $327 billion in 2017 [5]. This represents a 26% increase from the last estimate of $245 billion in 2012 [5]. These figures illustrate that even a minor reduction in the number of admissions or readmissions related to diabetes can result in substantial financial savings. Understanding various aspects of hospitalization of these patients, from admission to discharge, offers clinicians, hospital administrators and payors an insight into the impact of diabetes on patient outcomes.
The morbidity of diabetes from macrovascular disease and microvascular disease has been long established [6-8]. Patients with diabetes are also commonly at risk for other comorbidities including obesity, hyperlipidemia, hypertension, fractures, and periodontal disease [9]. As a result, adults with diabetes tend to utilize hospital systems at a higher frequency than those without diabetes. It is not uncommon that these patients are admitted to and/or discharged from the hospital with a primary diagnosis other than diabetes [10, 11]. For example, Lawson et al demonstrated that for patients with heart failure, type 2 diabetes was associated with increased risk of first hospitalization [12]. Similarly, several studies have shown that readmission rates are higher in patients with diabetes compared to those without diabetes [13-15]. As a result, hospitals and other healthcare facilities need to develop tools that systematically monitor and benchmark their patient populations, allowing for targeted interventions to improve quality and reduce costs.
Effective management tools should display information about patients with diabetes who experienced a hospitalization, an increased length of hospital stay, readmission, and complications. Any visual tool should enable health care systems not only to monitor their own metrics, but also to compare their performance to other institutions, both locally and nationally. The aim of this study was to develop a data dashboard prototype using national administrative data from the Centers for Medicare and Medicaid Services (CMS), to identify cases of diabetes, both type 1 and type 2, in patients who were admitted for key index admissions such as myocardial infarction, pneumonia, sepsis, stroke, and hip fractures, among others.
| Materials and Methods | ▴Top |
Data source
This retrospective study analyzed data from the Medicare Limited Data Set (LDS), which is an administrative claims database produced by the CMS. The LDS represents approximately 35% of all inpatient hospital discharges in the USA. Since LDS data do not contain specific direct identifiers as defined in the Health Insurance Portability and Accountability Act (HIPAA) Privacy Rule, this study is exempted from review by the Institutional Review Board (IRB). This study was conducted in compliance with the ethical standards of the responsible institution on human subjects as well as with the Helsinki Declaration.
The CMS compiles an administrative claims database, which contains data from all hospitals in the USA involved in the care of Medicare patients. This study utilized data from October 2015 through September 2018. Specifically, the data include all index hospital admissions extracted from October 2015 through August 2018 and track all-cause readmissions for another 30 days. All reasons for readmissions were collected if diabetes was present at the index hospitalization. In addition, the CMS has made certain hospital metrics available to health care consumers [16].
Identification of patients with diabetes at index hospitalization and the 10th revision of International Classification of Diseases (ICD-10) code identification
A medical coding team selected the ICD-10 codes based on review of the codes and medical literature searches. The following databases were searched: Web of Science, EMBASE, MEDLINE and Science Direct. First, hospital coders would identify diabetes as a comorbidity based on electronic health record entries. We then identified diabetes in the CMS data using ICD-10 codes. The ICD-10 coding methodology has flagged all diabetes (type 1 and type 2) codes from E08 to E13, and those codes were used for the dashboard. Based on these ICD-10 codes, patients with diabetes were flagged at each individual claim and grouped into cohorts with and without diabetes. Cohorts that were with fewer than 11 cases were not identified as per CMS privacy guidelines.
Dashboard design and development
The dashboard prototype was developed with the technical assistance from the Dexur Research and Analytics, a research organization specializing in the analysis of large datasets. In the creation of the dashboard, Dexur programmers created a series of queries driven by ICD-10 codes associated with diabetes as a comorbidity. The technical design involved loading the relevant ICD-10 codes provided by the medical team and flagging diabetes patients at the claim. These patients were then tagged for readmissions within the same database. The odds ratios are determined based on data from two groups: those with diabetes at index hospitalization which include type 1 only, type 2 only, and type 1 and type 2 diabetes, plus those who have not been classified into type 1 or type 2 diabetes at index hospitalization. The calculated odds ratios are then displayed for three stratified groups: type 1 readmissions odds ratio with diabetes, type 2 readmissions odds ratio with diabetes and type 1 and 2 readmissions odds ratio with diabetes respectively. The web pages are served from pre-calculated reports in the database. Dexur stores the information available from CMS on in-house servers at its aggregated data warehouse. Quality assurance algorithms flag outliers for manual review by data technicians. Programmers at Dexur utilized Python programing language (V 3.7.4, Python Software Foundation, Delaware, US) and other open source tools to display information from the database in the user interface online. The dashboard is available for users to view via HTML pages from the personal computer (PC), mobile device or a tablet on an open internet connection.
| Results | ▴Top |
Dashboard search functions
Users of the dashboard are able to search through all-cause readmission rates for patients with and without diabetes for any hospital in the USA involved in the treatment of Medicare patients. The dashboard presents summary data of diabetes readmissions quality metrics at a national level. Users can visualize summary data of each US state and compare odds ratios for readmissions as well as raw hospitalization numbers data (Fig. 1). The information about readmission can also be processed, upon request, to generate graphs showing odds ratios with a 95% confidence interval in a form of point with bar, instead of column graph, as shown in Figure 2. Additionally, dashboard users can view data classified by a diagnosis-related group (DRG) system, i.e. general medicine, cardiovascular, or orthopedics (Fig. 3). In addition to a “national” data view, for users who inquire about data specific to demographic regions, the DRG view can be further stratified at the state level or county level.
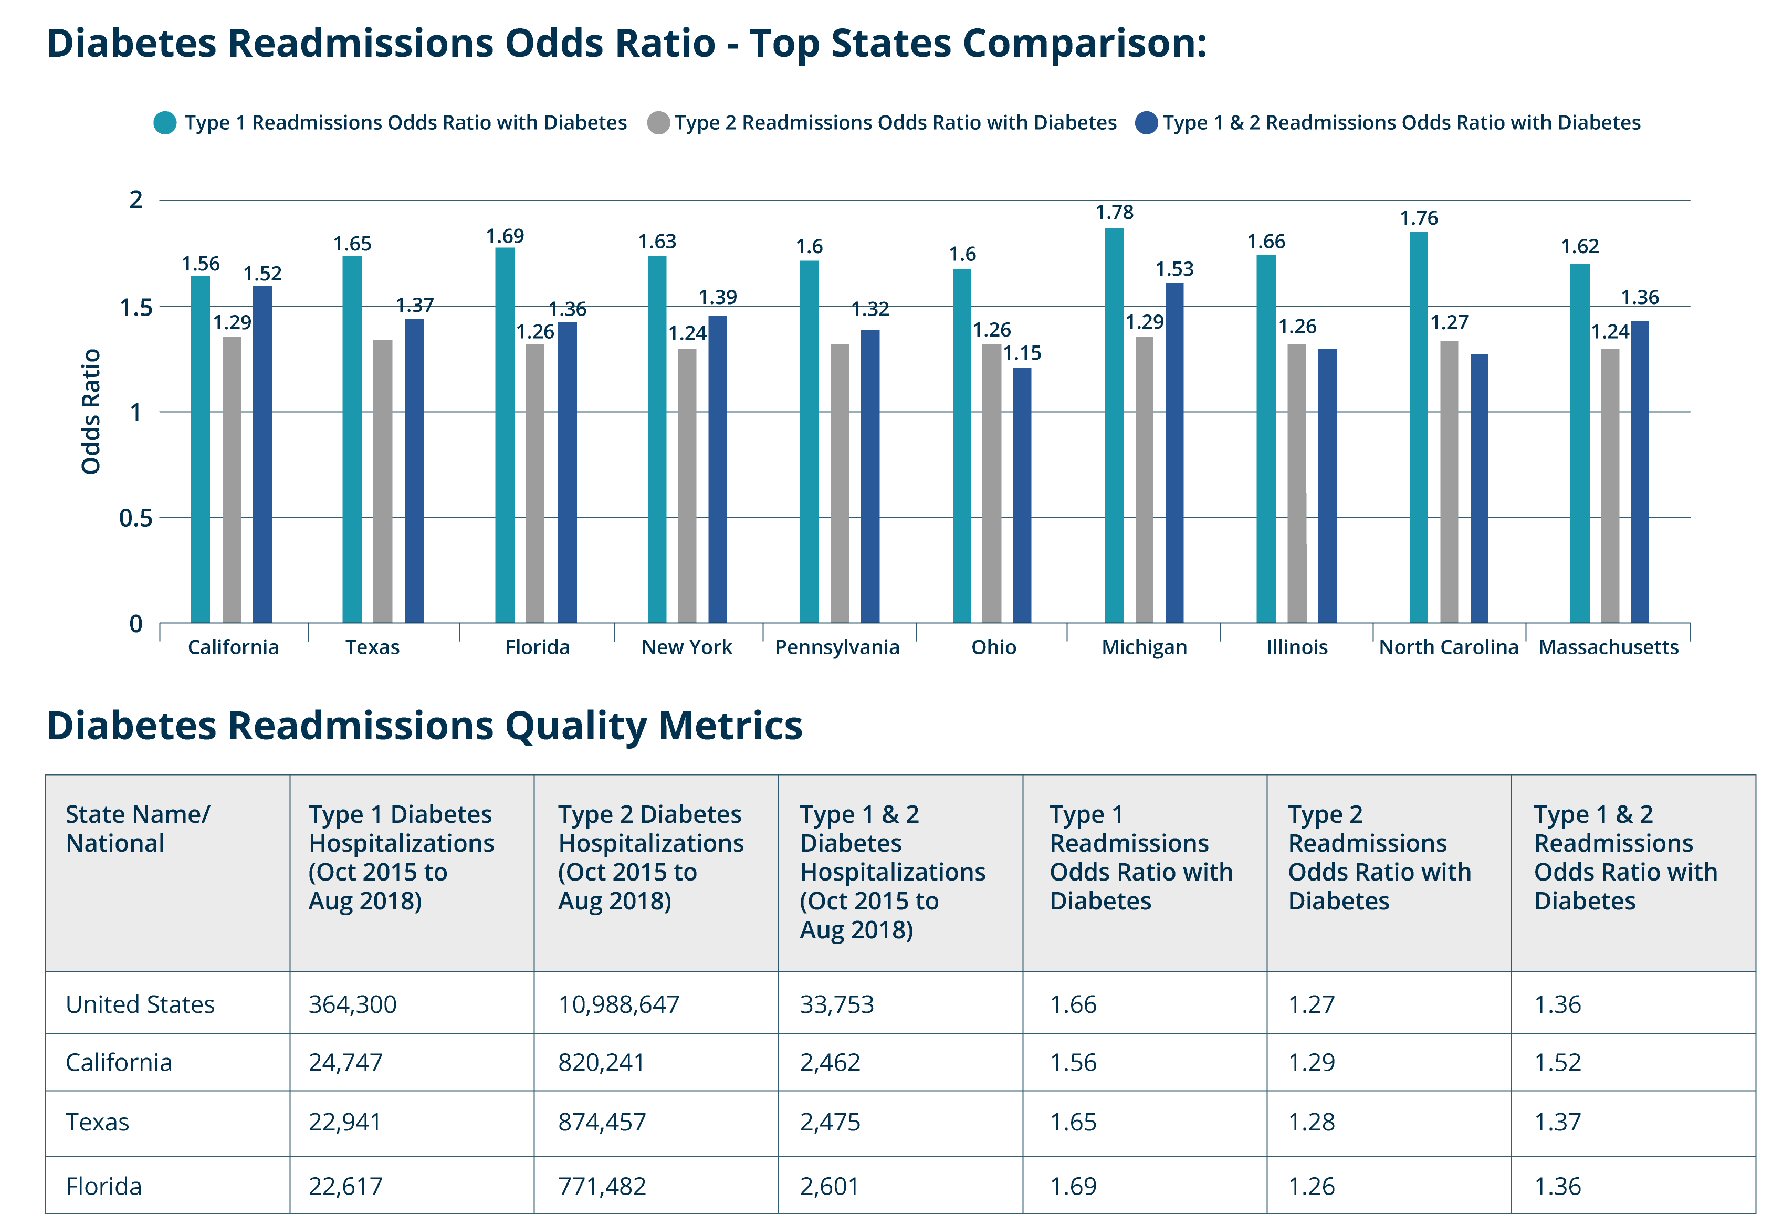 Click for large image | Figure 1. Screen capture of the diabetes readmissions quality metrics as a national summary view. |
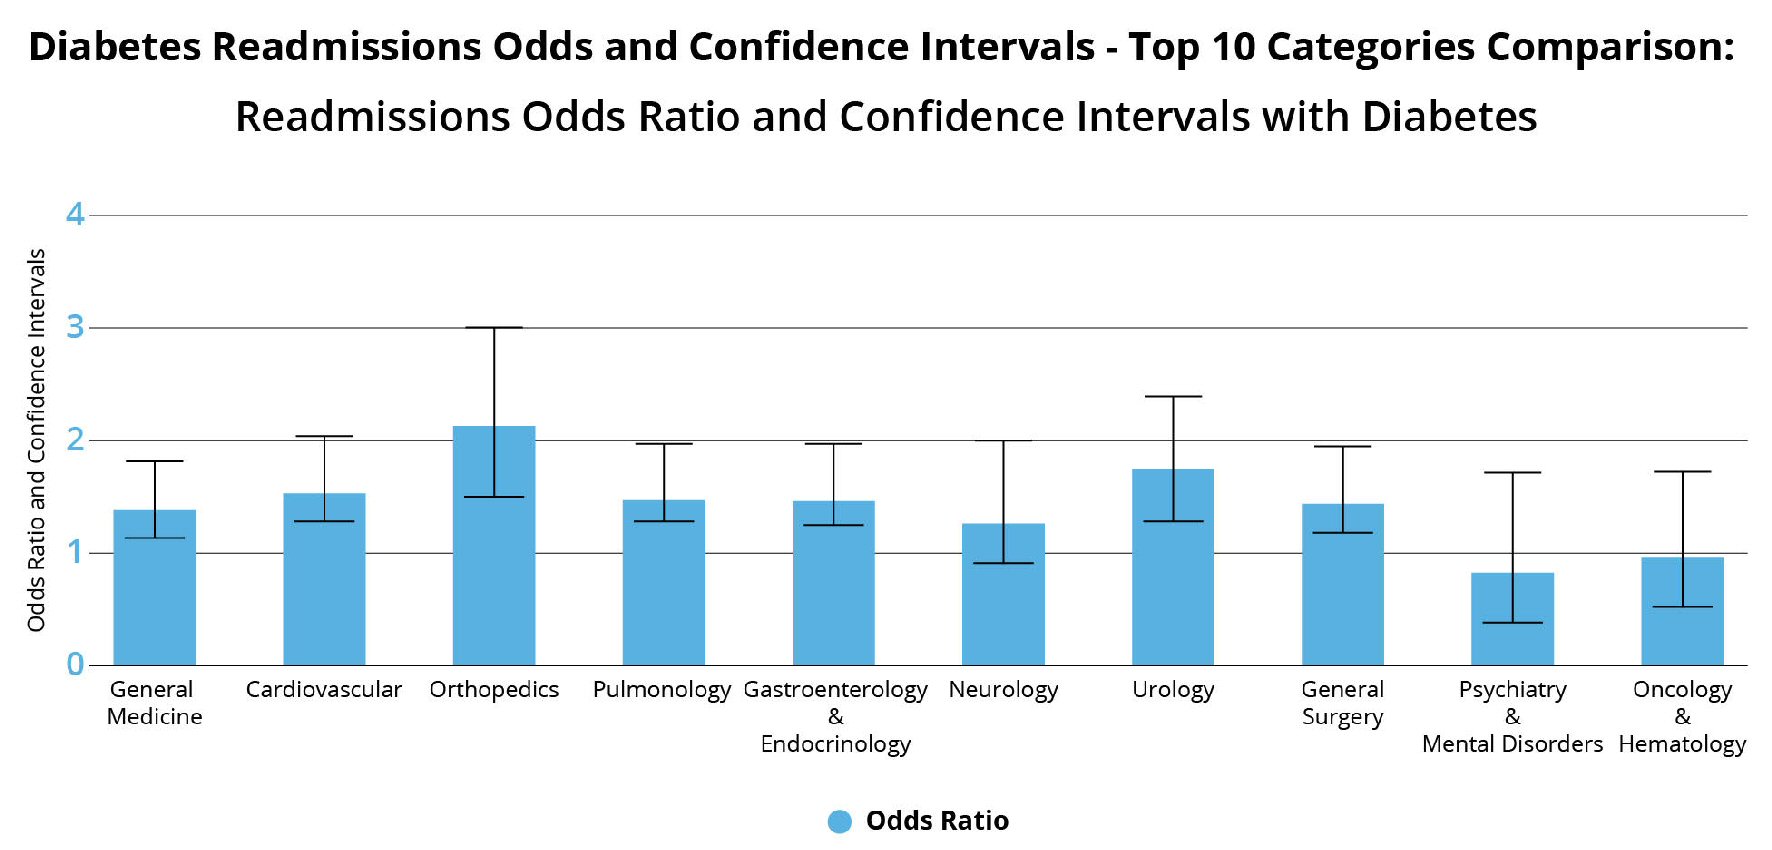 Click for large image | Figure 2. Screen capture of the diabetes readmission showing odds ratio and confidence intervals for top 10 categories comparisons. |
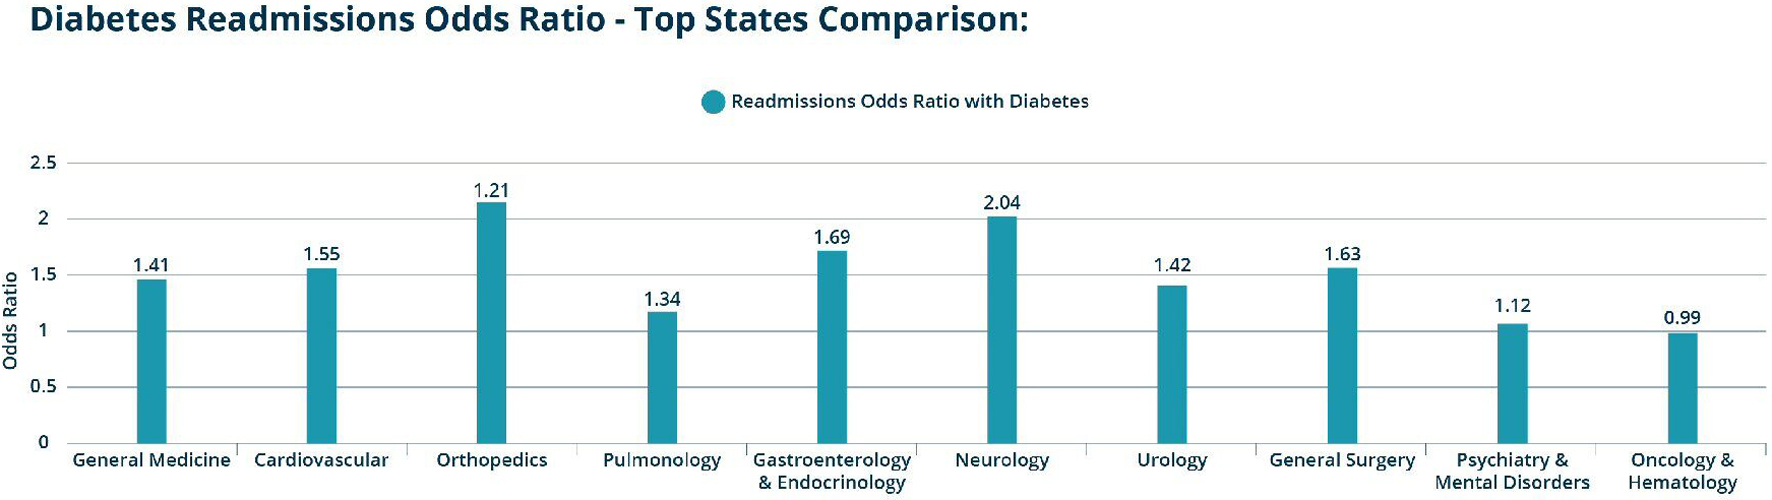 Click for large image | Figure 3. Screen capture of dashboard data at the diagnosis-related group (DRG) view at the national level (can be viewed at the US state or county levels). |
The dashboard also has functionality that enables users to compare readmission data at the hospital level. First, there is the hospitals state summary view, which can be used to compare readmission odds ratios between hospitals within the same state (Fig. 4). For hospital-specific data there is the hospital DRG view, which looks at readmissions at the DRG level (Fig. 5).
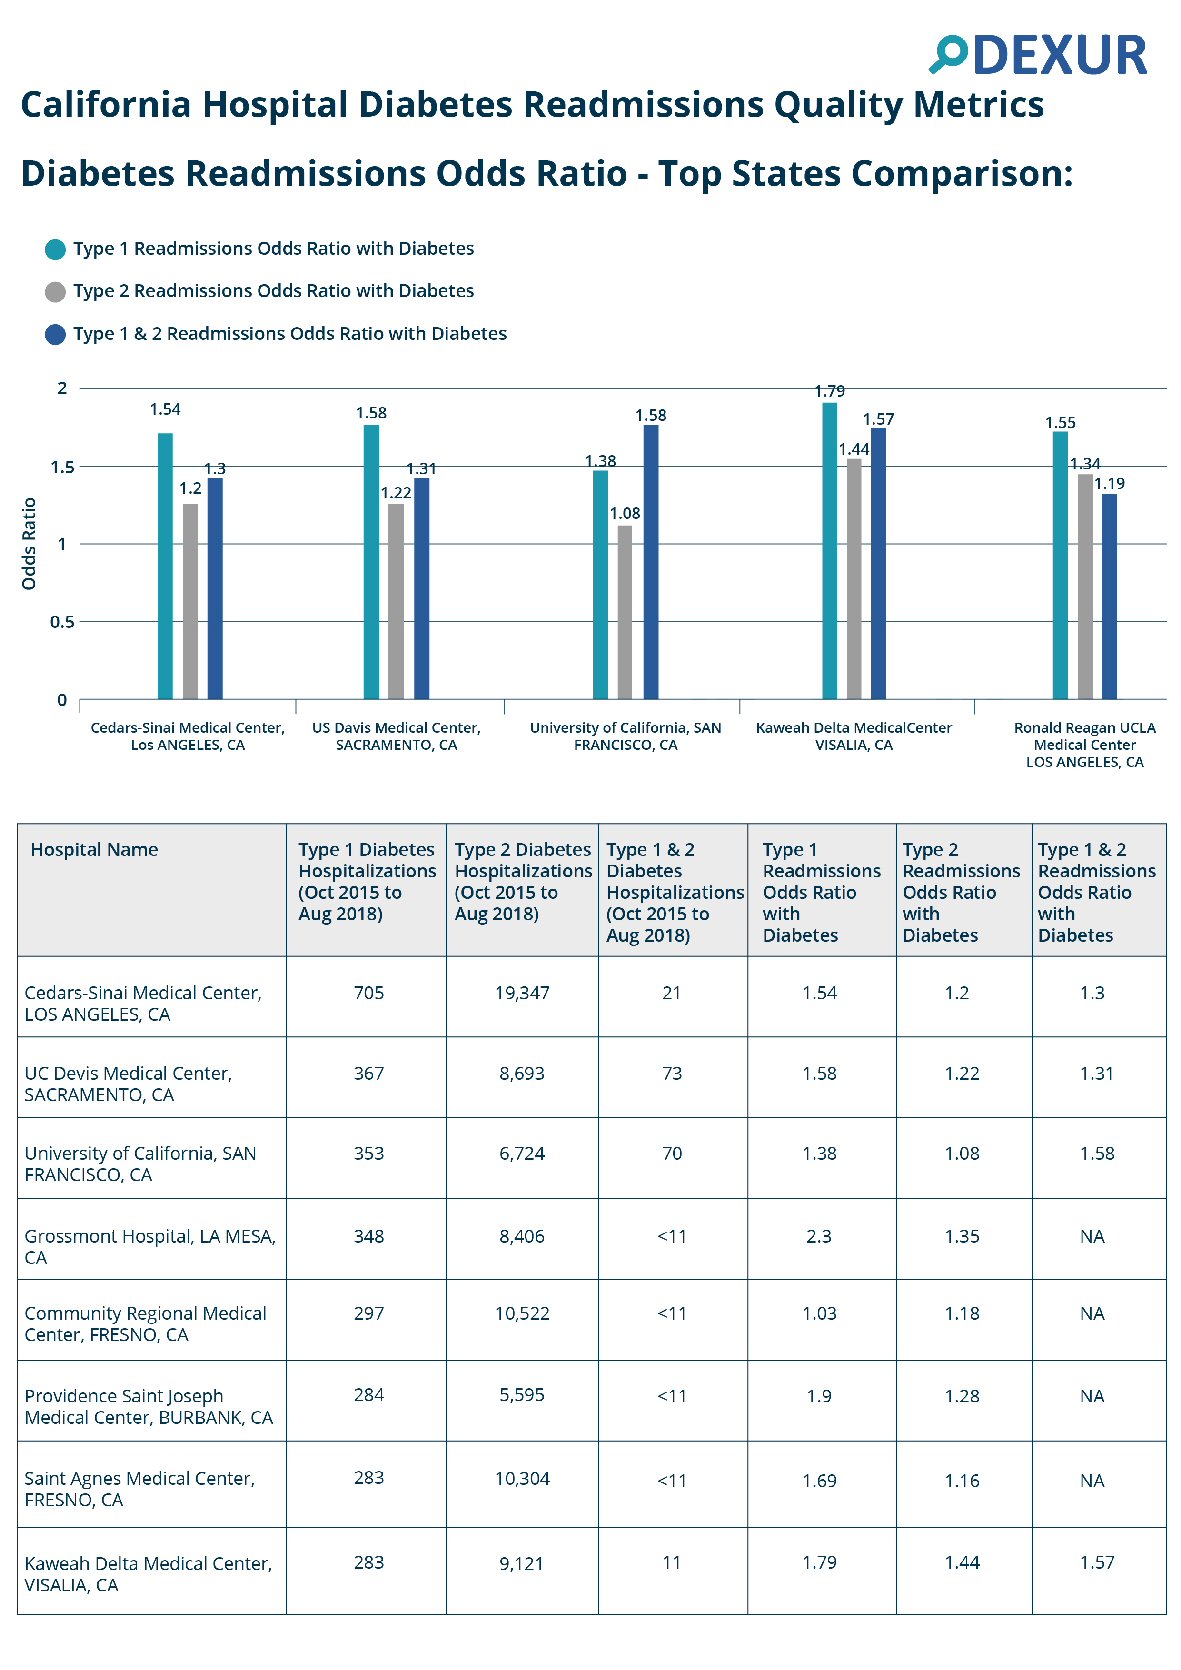 Click for large image | Figure 4. Screen capture of the hospital summary view by states for sample hospitals in California. |
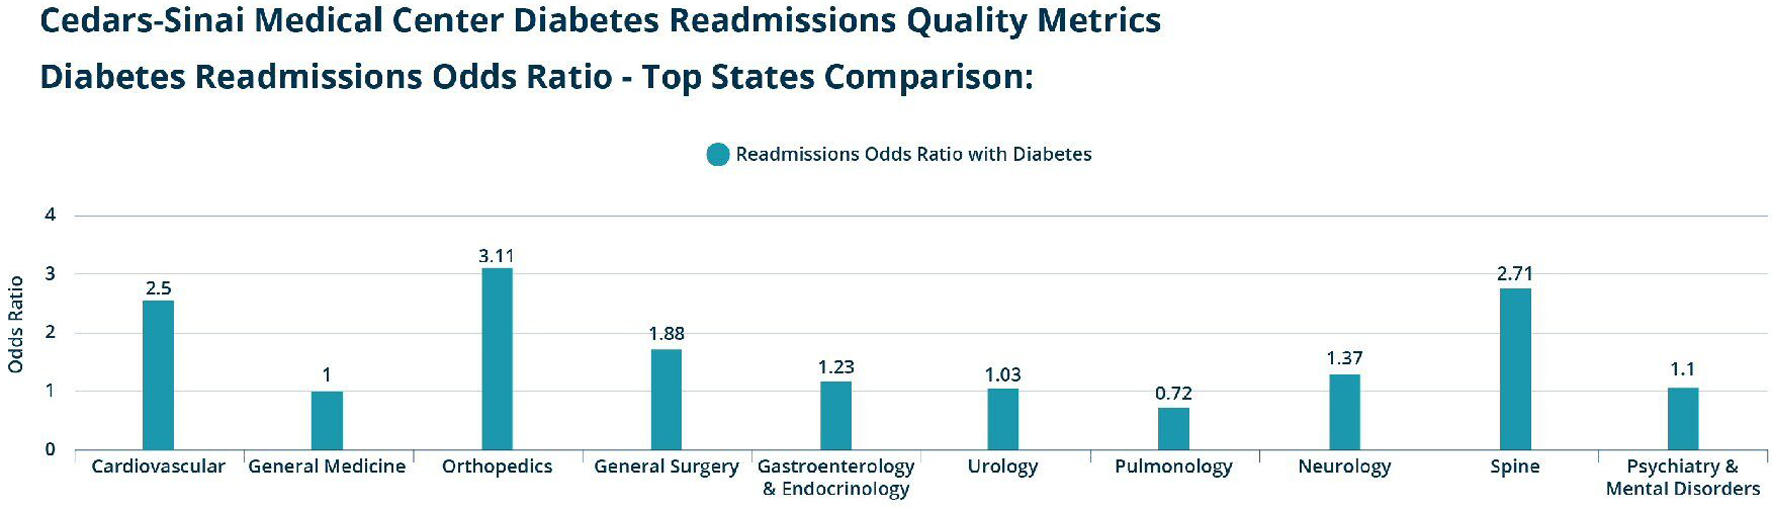 Click for large image | Figure 5. Screen capture of dashboard data at the diagnosis-related group (DRG) level for a sample hospital (Cedars-Sinai Medical Center). |
Readmission rates
This dashboard tracks readmission rates related to diabetes at the national, state, county and hospital levels. The key variable in this dashboard is the odds ratio for all-cause readmissions in patients who have diabetes. The odds ratios are displayed for three stratified groups: type 1 readmissions odds ratio with diabetes, type 2 readmissions odds ratio with diabetes and type 1 and 2 readmissions odds ratio with diabetes. When viewed at the DRG level, the odds ratio for all-cause readmission with diabetes is displayed for each DRG. At the DRG level, users can view data about the cost per readmissions for all index hospitalization with and without diabetes. This view also displays the top five readmitted DRG groups for all index hospitalizations (Figs. 3, 5).
| Discussion | ▴Top |
In our study, we utilized the CMS administrative claims database to provide a succinct, visual representation of the burden of diabetes on hospital readmissions across the country. The prototype dashboard demonstrates that a patient with diabetes impacts a hospital’s readmissions rate regardless of the reason for the index hospitalization. Interested users can search, analyze and present data via a user-friendly interface for easy interpretation with this dashboard, and the data generated can be used to compare an institution’s data against regional and national trends. In short, this tool presents health care providers with timely information needed to make clinical decisions towards improving the quality of patient care.
Prior studies have shown that clinicians have high satisfaction with the use of dashboards in clinical workflows [17, 18]. Clinical dashboards utilize visual displays to present a large amount of information, thereby enabling clinicians to tackle information overload by synthesizing a large amount of information in order to quickly aid in decision making. As technology continues to evolve, the integration of electronic health information with health analytics can improve the efficiency and quality of modern medical practice. Additionally, as more health systems are moving to 100% digital environments, dashboards may be used as closed loop, real time information systems that are integrated into electronic health records. This can play a crucial role in facilitating patient care and quality improvement initiatives with rapid feedback response times.
More recently, the use of clinical dashboards to provide feedback to clinicians and managers has been increasing, with many studies being published within the last decade [19, 20]. Clinical dashboards have been used in a variety of healthcare settings. For example, they have been used in the intensive care unit (ICU) to aid in the management of critically ill patients [18, 21]. Additionally, dashboards have been successfully implemented in emergency department settings [22, 23] and in ambulatory diabetes care [24]. The utilization of these dashboards has improved the efficiency and accuracy of data acquisition for high quality care in many healthcare settings.
At the hospital level, dashboards have been used to monitor and facilitate quality improvement initiatives. For example, one hospital utilized a clinical dashboard to improve time to antibiotic administration and decrease overall hospital length of stay in surgical ICU patients with sepsis [25]. Another study used a clinical dashboard as an approach towards reducing all-cause readmission rates for heart failure patients [26]. In both studies, the hospitals utilized dashboards to analyze primary data and facilitate interventions towards quality improvement processes. Pertinent to this study, dashboards have been utilized to improve implementation of clinical guidelines for the treatment of patients with diabetes [27]. Diabetes has long been associated with increased risk of surgical site infection, sepsis and other healthcare-associated infections, and these dashboards have been designed to reduce the incidence of central-line associated blood stream infections and sepsis [28-30].
Diabetes as an illness affects individuals through a progressive, multi-systemic nature. Not surprisingly, it has been associated with higher readmission rates for many different index hospitalizations [31, 32]. Data from our dashboard agree with these prior studies, with an odds ratio for readmission for type 1 and type 2 diabetes in the USA being 1.66 and 1.27, respectively. The dashboard also demonstrates that the readmission odds ratio for patients with these two diagnoses is elevated across the board regardless of the DRG or index hospitalization.
As previously mentioned, users should be able to utilize the dashboard to benchmark local data against national data and to identify opportunities for improvement. For example, an administrator in Hawaii can see that the odds ratio of Hawaii for type 1 diabetes mellitus and type 2 diabetes mellitus are 1.37 and 1.18, both lower than the national benchmark data. Likewise, administrators from Michigan will see that the odds ratio for type 1 diabetes mellitus and type 2 diabetes mellitus for their state are 1.78 and 1.29, which are higher compared to national data. Further, if a hospital discovers that chronic obstructive pulmonary disease (COPD) is a common DRG for readmission, then the quality officers could intervene through quality improvement measures to reduce COPD exacerbations. This initiative could include early outpatient follow-up with a patient’s primary care physician or through sustained patient education efforts. At the institutional level, hospital administrators can use the dashboard to compare their own hospital data versus the other hospitals in the state by filtering the odds ratio data by DRG for their own hospital. The DRG view page also displays the cost per readmission and top five readmission DRG groups for patients with and without diabetes. In this scenario, if a hospital sees that it has higher readmission rates caused by skin ulcers or infections, then administrators could implement policies to improve outpatient follow-up with wound care services. Ultimately, this dashboard can give clinicians and hospital administrators the opportunity to detect common sources of hospital readmissions in diabetes patients at their institution. It offers the ability to analyze a large set of data before committing resources in funding or staff hours, and provides preliminary data to justify the investment of resources towards quality improvement measures.
Future directions may include integrating the dashboard into local electronic health records and mainstream quality improvement measures toward reducing all-cause readmission in patients with diabetes. Further, the dashboard can be utilized to track other significant clinical outcomes such as ICU stay, length of stay and mortality rate in patients with diabetes. Finally, HealthGrades (Healthgrades Operating Company, Inc., Denver, USA), a source of information about physicians and hospitals, found nearly 1 million patient safety lapses resulting in an additional $8.9 billion in health care costs among the Medicare population [33]. With continual refinement, future dashboards could detect clinical pathway lapses and preventable medical errors.
Limitations
There are several limitations to this study. First, this study data set is limited to Medicare patients included in the CMS database and may represent a disproportionately increased risk of all-cause readmissions because of an older population. As a result, the true odds ratio for all-cause readmissions may be slightly overestimated when applied to the general population. Second, the study may be limited by regional or hospital differences in ICD coding quality. Coding accuracy can vary in procedures and definitions when used by coders in different regions. Finally, it is important to note that quality metrics and odds ratio in the figures have not been adjusted for the size of population, age, income level, comorbidities or other demographic factors. Appropriate adjustments for the aforementioned factors can be made as we continue working on future reiterations of the dashboard.
Conclusions
This study constructed a novel dashboard as a method to track the readmission burden for hospitals across the USA related to diabetes. This dashboard can help hospitals administrators and quality officers better understand the impact of diabetes on hospital readmissions and gives administrators and clinicians a tool to benchmark hospital data in comparison to local and national trends. These data can be used to initiate and track quality improvement processes and to reduce the costs of care. Tackling quality improvement initiative involves the appropriate use of data and metrics to understand processes, analyze problems, set goals, and measure change [34]. This dashboard prototype presents readmission data via a clear mechanistic interface allowing physicians, administrators and hospitals to monitor and improve care for patients with diabetes.
Acknowledgments
None to declare.
Financial Disclosure
The authors received no financial support for the research, authorship, and/or publication of this article. Data were analyzed by Dexur Research and Analytics.
Conflict of Interest
The authors declare that there is no conflict of interest.
Informed Consent
Not applicable.
Author Contributions
All authors contributed to the study design, data analysis and writing of the manuscript.
Abbreviations
CMS: Centers for Medicare and Medicaid Services; ICD: International Classification of Diseases; DRG: diagnosis-related group; ICU: intensive care unit; COPD: chronic obstructive pulmonary disease
| References | ▴Top |
- Gregg EW, Li Y, Wang J, Burrows NR, Ali MK, Rolka D, Williams DE, et al. Changes in diabetes-related complications in the United States, 1990-2010. N Engl J Med. 2014;370(16):1514-1523.
doi pubmed - Rowley WR, Bezold C, Arikan Y, Byrne E, Krohe S. Diabetes 2030: Insights from Yesterday, Today, and Future Trends. Popul Health Manag. 2017;20(1):6-12.
doi pubmed - Lin J, Thompson TJ, Cheng YJ, Zhuo X, Zhang P, Gregg E, Rolka DB. Projection of the future diabetes burden in the United States through 2060. Popul Health Metr. 2018;16(1):9.
doi pubmed - Boyle JP, Honeycutt AA, Narayan KM, Hoerger TJ, Geiss LS, Chen H, Thompson TJ. Projection of diabetes burden through 2050: impact of changing demography and disease prevalence in the U.S. Diabetes Care. 2001;24(11):1936-1940.
doi pubmed - American Diabetes A. Economic Costs of Diabetes in the U.S. in 2017. Diabetes Care. 2018;41(5):917-928.
doi pubmed - Bertoni AG, Krop JS, Anderson GF, Brancati FL. Diabetes-related morbidity and mortality in a national sample of U.S. elders. Diabetes Care. 2002;25(3):471-475.
doi pubmed - Bethel MA, Sloan FA, Belsky D, Feinglos MN. Longitudinal incidence and prevalence of adverse outcomes of diabetes mellitus in elderly patients. Arch Intern Med. 2007;167(9):921-927.
doi pubmed - Epstein M, Sowers JR. Diabetes mellitus and hypertension. Hypertension. 1992;19(5):403-418.
doi pubmed - American Diabetes A. 3. Comprehensive Medical Evaluation and Assessment of Comorbidities. Diabetes Care. 2017;40(Suppl 1):S25-S32.
doi pubmed - Aubert RE, Geiss LS, Ballard DJ, Cocanougher B, Herman WH. Chapter 27: Diabetes-related hospitalization and hospital utilization. In: Diabetes in America 2nd ed. Bethesda, MD, National Institutes of Health, 1995, p. 553-570. NIH publication 95-1468.
- Aro S, Kangas T, Reunanen A, Salinto M, Koivisto V. Hospital use among diabetic patients and the general population. Diabetes Care. 1994;17(11):1320-1329.
doi pubmed - Lawson CA, Jones PW, Teece L, Dunbar SB, Seferovic PM, Khunti K, Mamas M, et al. Association between type 2 diabetes and all-cause hospitalization and mortality in the UK general heart failure population: stratification by diabetic glycemic control and medication intensification. JACC Heart Fail. 2018;6(1):18-26.
doi pubmed - Ostling S, Wyckoff J, Ciarkowski SL, Pai CW, Choe HM, Bahl V, Gianchandani R. The relationship between diabetes mellitus and 30-day readmission rates. Clin Diabetes Endocrinol. 2017;3(3.
doi pubmed - Liu JW, Ahn J, Raspovic KM, Liu GT, Nakonezny PA, Lavery LA, Wukich DK. Increased Rates of Readmission, Reoperation, and Mortality Following Open Reduction and Internal Fixation of Ankle Fractures Are Associated With Diabetes Mellitus. J Foot Ankle Surg. 2019;58(3):470-474.
doi pubmed - Sonmez H, Kambo V, Avtanski D, Lutsky L, Poretsky L. The readmission rates in patients with versus those without diabetes mellitus at an urban teaching hospital. J Diabetes Complications. 2017;31(12):1681-1685.
doi pubmed - Centers for Medicare & Medicaid Services. Hospital Compare. https://www.medicare.gov/hospitalcompare/search.html. Accessed June 8, 2019.
- Lee K, Jung SY, Hwang H, Yoo S, Baek HY, Baek RM, Kim S. A novel concept for integrating and delivering health information using a comprehensive digital dashboard: An analysis of healthcare professionals' intention to adopt a new system and the trend of its real usage. Int J Med Inform. 2017;97:98-108.
doi pubmed - Dziadzko MA, Herasevich V, Sen A, Pickering BW, Knight AM, Moreno Franco P. User perception and experience of the introduction of a novel critical care patient viewer in the ICU setting. Int J Med Inform. 2016;88:86-91.
doi pubmed - Dowding D, Randell R, Gardner P, Fitzpatrick G, Dykes P, Favela J, Hamer S, et al. Dashboards for improving patient care: review of the literature. Int J Med Inform. 2015;84(2):87-100.
doi pubmed - Stone AB, Jones MR, Rao N, Urman RD. A Dashboard for Monitoring Opioid-Related Adverse Drug Events Following Surgery Using a National Administrative Database. Am J Med Qual. 2019;34(1):45-52.
doi pubmed - Pickering BW, Dong Y, Ahmed A, Giri J, Kilickaya O, Gupta A, Gajic O, et al. The implementation of clinician designed, human-centered electronic medical record viewer in the intensive care unit: a pilot step-wedge cluster randomized trial. Int J Med Inform. 2015;84(5):299-307.
doi pubmed - Staib A, Sullivan C, Jones M, Griffin B, Bell A, Scott I. The ED-inpatient dashboard: Uniting emergency and inpatient clinicians to improve the efficiency and quality of care for patients requiring emergency admission to hospital. Emerg Med Australas. 2017;29(3):363-366.
doi pubmed - Batley NJ, Osman HO, Kazzi AA, Musallam KM. Implementation of an emergency department computer system: design features that users value. J Emerg Med. 2011;41(6):693-700.
doi pubmed - Koopman RJ, Kochendorfer KM, Moore JL, Mehr DR, Wakefield DS, Yadamsuren B, Coberly JS, et al. A diabetes dashboard and physician efficiency and accuracy in accessing data needed for high-quality diabetes care. Ann Fam Med. 2011;9(5):398-405.
doi pubmed - Jung AD, Baker J, Droege CA, Nomellini V, Johannigman J, Holcomb JB, Goodman MD, et al. Sooner is better: use of a real-time automated bedside dashboard improves sepsis care. J Surg Res. 2018;231:373-379.
doi pubmed - Banerjee D, Thompson C, Kell C, Shetty R, Vetteth Y, Grossman H, DiBiase A, et al. An informatics-based approach to reducing heart failure all-cause readmissions: the Stanford heart failure dashboard. J Am Med Inform Assoc. 2017;24(3):550-555.
doi pubmed - Basques BA, Miller CP, Golinvaux NS, Bohl DD, Grauer JN. Morbidity and readmission after open reduction and internal fixation of ankle fractures are associated with preoperative patient characteristics. Clin Orthop Relat Res. 2015;473(3):1133-1139.
doi pubmed - Trevelin SC, Carlos D, Beretta M, da Silva JS, Cunha FQ. Diabetes mellitus and sepsis: a challenging Association. Shock. 2017;47(3):276-287.
doi pubmed - Bomberg H, Kubulus C, List F, Albert N, Schmitt K, Graber S, Kessler P, et al. Diabetes: a risk factor for catheter-associated infections. Reg Anesth Pain Med. 2015;40(1):16-21.
doi pubmed - Pageler NM, Longhurst CA, Wood M, Cornfield DN, Suermondt J, Sharek PJ, Franzon D. Use of electronic medical record-enhanced checklist and electronic dashboard to decrease CLABSIs. Pediatrics. 2014;133(3):e738-746.
doi pubmed - Wijayaratna SM, Cundy T, Drury PL, Sehgal S, Wijayaratna SA, Wu F. Association of type 2 diabetes with prolonged hospital stay and increased rate of readmission in patients with lower limb cellulitis. Intern Med J. 2017;47(1):82-88.
doi pubmed - Najafian A, Selvarajah S, Schneider EB, Malas MB, Ehlert BA, Orion KC, Haider AH, et al. Thirty-day readmission after lower extremity bypass in diabetic patients. J Surg Res. 2016;200(1):356-364.
doi pubmed - Health Grades Seventh Annual Patient Safety in American Hospitals Study. 2010. Retrieved from http://www.healthgrades.com/media/DMS/pdf/PatientSafetyInAmericanHospitalsStudy2010.pdf.
- Valentine EA, Falk SA. Quality Improvement in Anesthesiology - Leveraging Data and Analytics to Optimize Outcomes. Anesthesiol Clin. 2018;36(1):31-44.
doi pubmed
This article is distributed under the terms of the Creative Commons Attribution Non-Commercial 4.0 International License, which permits unrestricted non-commercial use, distribution, and reproduction in any medium, provided the original work is properly cited.
Journal of Clinical Medicine Research is published by Elmer Press Inc.