

| Journal of Clinical Medicine Research, ISSN 1918-3003 print, 1918-3011 online, Open Access |
| Article copyright, the authors; Journal compilation copyright, J Clin Med Res and Elmer Press Inc |
| Journal website http://www.jocmr.org |
Original Article
Volume 11, Number 6, June 2019, pages 435-446
Relationship of Anthropometric Indices to Abdominal Body Composition: A Multi-Ethnic New Zealand Magnetic Resonance Imaging Study
Aya Cervantesa, Ruma G. Singha, Jin U. Kima, Steve V. DeSouzaa, Maxim S. Petrova, b
aSchool of Medicine, University of Auckland, Auckland, New Zealand
bCorresponding Author: Maxim S. Petrov, Room 12.085A, Auckland City Hospital, Auckland 1023, New Zealand
Manuscript submitted March 18, 2019, accepted April 10, 2019
Short title: Abdominal Fat Distribution by MRI
doi: https://doi.org/10.14740/jocmr3820
| Abstract | ▴Top |
Background: Conventional anthropometric indices (body mass index (BMI) and waist circumference (WC)) have limitations, in part, due to ethnic differences in fat distribution. Assessment of abdominal body composition using magnetic resonance imaging (MRI) is increasingly used to gain deeper insights into the pathophysiology of diabetes mellitus, cardiovascular diseases and metabolic syndrome, but the knowledge of abdominal volumes in indigenous populations is scarce. This study aimed to assess abdominal fat distribution and total abdominal volume using MRI in a multi-ethnic cohort that includes Maori (the indigenous people of New Zealand) and Pacific Islanders (PI).
Methods: MRI was used to quantify subcutaneous adipose tissue (SAT) volume, visceral adipose tissue (VAT) volume and total abdominal (TAb) volume by two independent raters in a blinded fashion. WC and BMI were also measured. Multinomial regression was used to compare the volumes between ethnic groups. Linear regression was used to investigate the ethnicity-specific associations between anthropometric indices and abdominal volumes. Three statistical models were built to adjust for age, sex, prediabetes/diabetes status and other covariates.
Results: A total of 87 individuals (37 Caucasians, 24 Maori/PI and 26 others) were studied. Maori/PI had a significantly higher VAT volume compared with Caucasians across all statistical models, with the highest odds ratio of 2.1 (95% confidence interval: 1.1 - 4.2; P = 0.026). SAT and TAb volumes did not differ significantly between the groups. WC explained up to 72.9% of variance in VAT volume among Maori/PI and up to 50.7% among Caucasians. BMI explained up to 67.6% of variance in VAT volume among Maori/PI and up to 52.1% among Caucasians.
Conclusions: Greater visceral fat deposition among Maori/PI might go some way towards explaining the increased rates of metabolic disorders observed in this ethnic group. Conventional anthropometric indices do not correspond to the same abdominal volumes across different ethnic groups.
Keywords: Visceral fat; Subcutaneous fat; Abdominal volume; Magnetic resonance imaging; Ethnicity
| Introduction | ▴Top |
Distribution of abdominal fat is increasingly recognized as a driving force behind diabetes, metabolic syndrome and cardiovascular disorders. Modern cross-sectional imaging, such as magnetic resonance imaging (MRI) and computed tomography (CT), can accurately quantify the compartment-specific distribution of adipose tissue in the abdomen. Specifically, fat accumulation around intra-abdominal organs, termed visceral adipose tissue (VAT) [1], has emerged as a stronger correlate of metabolic risks than subcutaneous adipose tissue (SAT) [2, 3]. This can be explained by functional and metabolic differences between the two compartments: VAT is metabolically more active than SAT and produces inflammatory mediators contributing to chronic low-grade inflammation, increased insulin resistance and impaired lipid metabolism [4-7].
Although MRI/CT is the gold standard for quantifying the size of abdominal compartments, they are costly, time-consuming and labor-intensive. These factors make MRI/CT impractical for routine use and signify the need for developing a more practical (yet reasonably accurate) method to measure abdominal fat distribution. Anthropometric indices, such as waist circumference (WC) [8-10] and body mass index (BMI) [11, 12], are well-established predictors of morbidity and mortality and are commonly used as proxies for adiposity in the general population. However, their associations with specific abdominal compartments (i.e. SAT, VAT and total abdominal (TAb) volumes) in different ethnic backgrounds vary [13-15]. To date, studies investigating ethnicity-specific associations have predominantly focused on ethnic groups in the USA, with only a handful of studies investigating ethnic groups in other parts of the world. In particular, there are no published data on abdominal volumes in Maori (the indigenous people of New Zealand) and Pacific Islanders (PI) though they have a significantly greater burden of obesity than Caucasians. Further, to the best of our knowledge, abdominal fat distribution has never been assessed in adult New Zealand population using MRI.
The aims were to assess ethnicity-specific differences in abdominal volumes using MRI in a multi-ethnic New Zealand study, to investigate the associations between conventional anthropometric indices and MRI-derived abdominal volumes across the ethnicities and to derive ethnicity-specific equations to predict VAT volume.
| Materials and Methods | ▴Top |
Study design
The present study represents a secondary analysis of data, whereas the primary analysis focused on glucose metabolism after an attack of acute pancreatitis and was published elsewhere [16]. Participants were included in the study if they were at least 18 years old, provided informed consent and had a history of acute pancreatitis. Participants were excluded if they had chronic pancreatitis or any other disease of the exocrine pancreas, any intervention involving the pancreas, malignancy, pregnancy, cystic fibrosis, coeliac disease, a history of acute infectious or inflammatory conditions requiring medical treatment or evaluation in the preceding 6 months and used steroid therapy [16]. Participants with contraindications for MRI (e.g. metallic foreign body or electronic device implantations) were also excluded from the study. Participants were asked to confirm their ethnic background and were subsequently grouped into Caucasians, Maori/PI and Other. This study was approved by the Health and Disability Committee and conducted in compliance with the ethical standards of our institution on human subjects as well as with the Helsinki Declaration.
Anthropometric indices
BMI (kg/m2) was measured using a digital scale with a stadiometer (Health o meter® Professional, 2013; ©Pelstar LLC, McCook, IL, USA). WC (cm) was measured over light clothing at the umbilicus. Both BMI and WC were measured at the time of MRI acquisition.
MRI acquisition and analyses
Abdominal MRI was performed at the Center of Advanced MRI (University of Auckland) with a 3.0-Tesla MAGNETOM Skyra scanner (Siemens, Erlangen, Germany). Participants were instructed to lie in the supine position and hold their breath after expiration for the duration of the scan. Axial T1-weighted volumetric interpolated breath-hold examination Dixon sequence was used. Sequential parameters were reported elsewhere [17].
All MRI scans were analyzed using the ImageJ software (National Institutes of Health, USA). Adipose tissue volumes were quantified using series of fat images (Fig. 1a, b), identified from the second lumbar (L2) vertebral level to the fifth lumbar (L5) vertebral level. The SAT and VAT compartments were segmented and separated into two image series for subsequent measurements. The gray-scale images were then converted into binary images using the threshold-function to highlight adipose tissue pixels from the non-adipose tissue (e.g. organs and blood vessels) region. The pixel count of the highlighted area was measured for each image of the SAT and VAT abdominal series. For quantification of SAT and VAT volumes, the total sum of pixel counts was multiplied by the pixel area and slice thickness. For quantification of TAb volume, identical series of water images (from L2 to L5) were used. The free-hand tool was used to select the outer boundary of the abdomen (Fig. 1c) and the total sum of pixel counts (for the entire abdominal series) was then multiplied by pixel area and slice thickness to obtain the TAb volume.
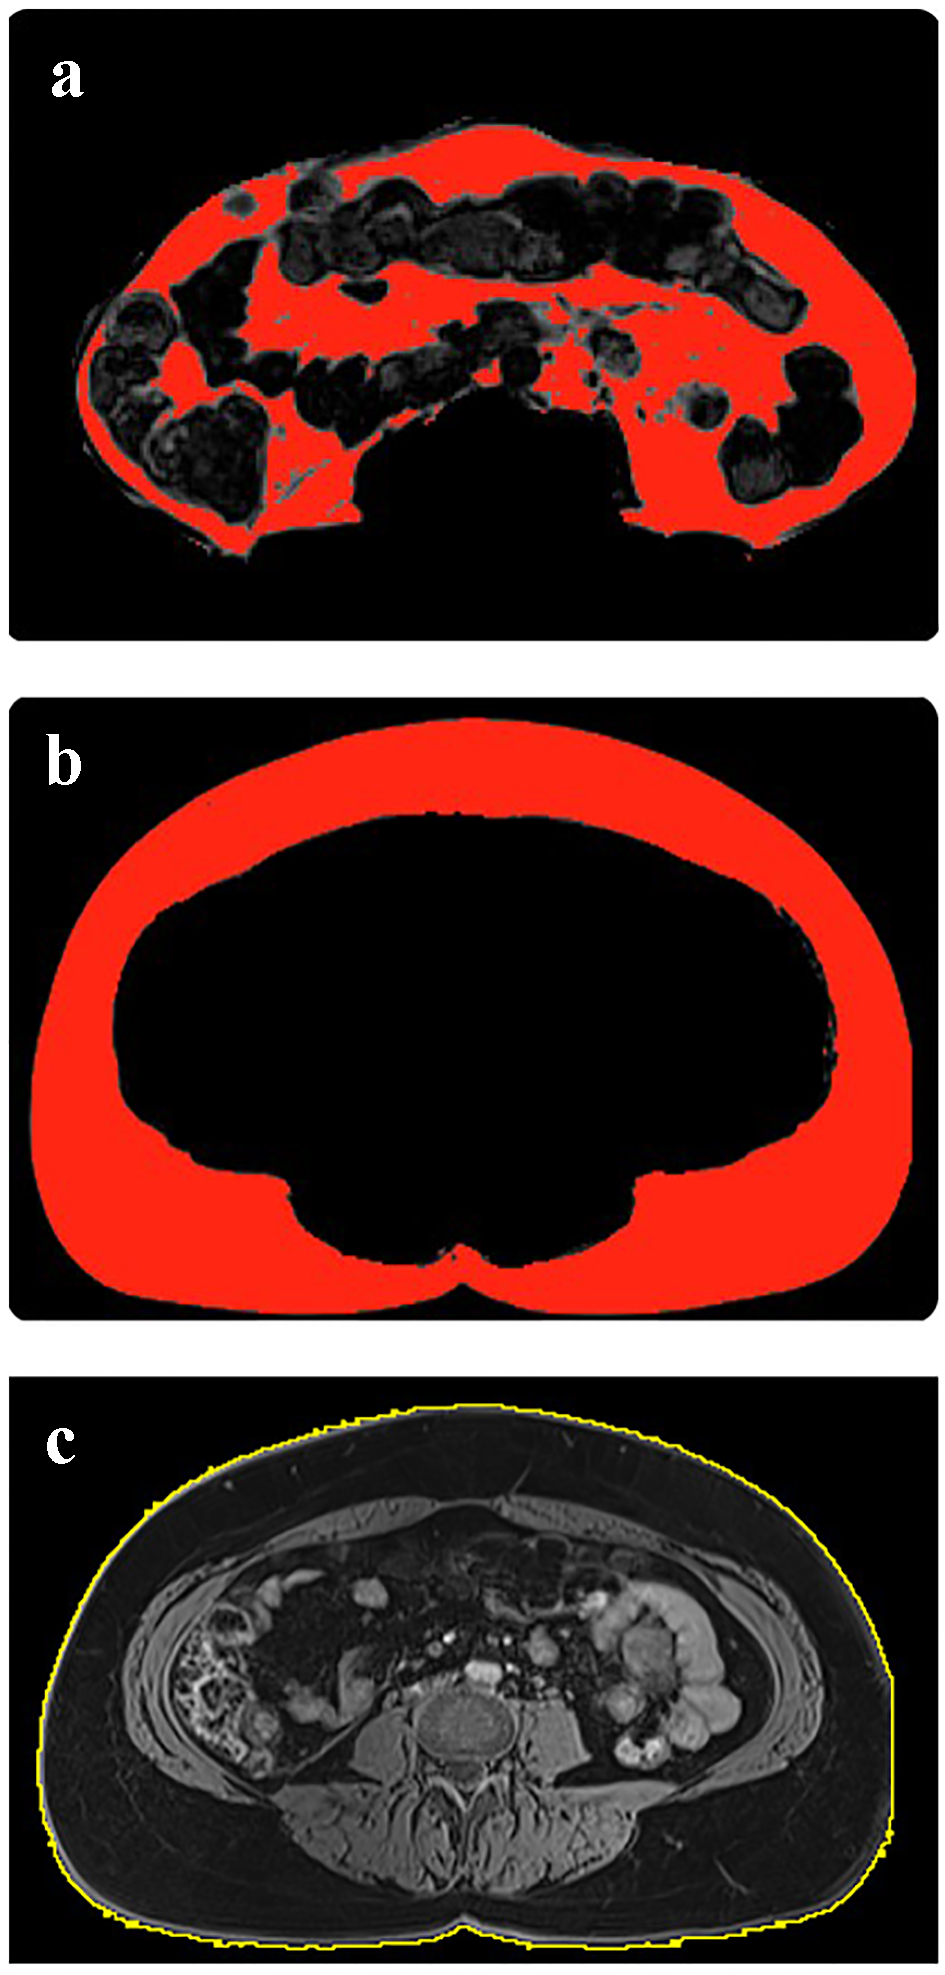 Click for large image | Figure 1. Quantification of visceral adipose tissue volume (a), subcutaneous adipose tissue volume (b) and total abdominal volume (c). |
Intra-class correlation coefficient (ICC) and associated 95% confidence interval (CI) were used to evaluate inter-rater reliability of the three MRI measurements in all study participants, done independently by two raters blinded to ethnic group allocation and other characteristics. ICC values < 0.5, 0.5 - 0.75, 0.75 - 0.9 and > 0.9 were indicative of poor, moderate, good and excellent inter-rater reliability, respectively [18]. The average values of the two independent sets of measurements were used for statistical analyses.
Other variables
On the study date, fasting blood samples were collected after at least 8 h of fasting. Fasting blood glucose was analyzed using enzymatic colourimetric assay (F. Hoffman-La Roche Ltd). In line with the American Diabetes Association guidelines [19], glycated hemoglobin (HbA1c) was measured using the boronate affinity chromatography assay (Trinity Biotech, Wicklow, Ireland), which is certified by the National Glycohemoglobin Standardization Program (NGSP) and standardized to the Diabetes Control and Complications Trial reference assay. The presence of prediabetes (HbA1c 39 - 48 mmol/mol and/or fasting plasma glucose (FBG) 5.6 - 6.7 mmol/L) or diabetes mellitus (HbA1c > 48 mmol/mol and/or FBG > 6.7 mmol/L) was determined according to the American Diabetes Association guidelines [19].
Statistical analysis
All statistical analyses were performed using SPSS 23.0 for Mac OSX (IBM Corp., 2015). Analysis of variance and Chi-squared tests were used to assess differences in baseline characteristics for continuous and categorical variables, respectively. All data were reported as mean ± standard deviation (SD) or frequencies for continuous and categorical variables, respectively.
First, multinomial logistic regression was conducted to investigate the difference in abdominal volumes between the ethnic groups. Ethnicity was analyzed as the dependent variable, with Caucasians set as the reference group. Each MRI-derived abdominal volume (VAT, SAT and TAb) was used as the independent variable in one unadjusted and three adjusted models. Model 1 was adjusted for demographic factors (age and sex). Model 2 was adjusted for demographic and metabolic (prediabetes/diabetes mellitus status) factors. Model 3 was adjusted for demographic, metabolic and pancreatitis-related (etiology, recurrence and time since acute pancreatitis) factors. Data were presented as odds ratio (OR) and 95% CI.
Second, linear regression was performed to investigate the relationship between anthropometric indices and MRI-derived abdominal volumes, in the entire cohort and each of the ethnic groups. Data for VAT volume were not normally distributed and were log10 transformed for analysis. Each abdominal volume (VAT, SAT and TAb) was used as the dependent variable and each anthropometric index (WC and BMI) was used as the independent variable in one unadjusted and three adjusted models (as described above). Data were presented as β coefficients, 95% CI and R2 metric.
Third, linear regression was performed to derive ethnicity-specific equations with a view to estimating VAT volume from variables that do not require the use of MRI. Anthropometric measures (height, weight, BMI and WC), demographic factors (age and sex) and pancreatitis-related factors (etiology, recurrence and time since acute pancreatitis) were used as predictor variables. In the linear model that included all predictor variables, collinear variables (as indicated by the highest variance inflation factor (VIF)) were removed one at a time until multicollinearity was minimized (VIF < 5). Then, backward elimination method was used to remove predictor variables that did not significantly contribute to the model (P ≥ 0.05).
| Results | ▴Top |
Patient characteristics
A total of 87 participants were recruited into the study, of whom 37 (42.5%) were Caucasians, 24 (27.5%) were Maori/PI and 26 (29.8%) belonged to other ethnicities. The mean ± SD age of the entire cohort was 54.3 ± 1.6 years and 56 (64.4%) of the study participants were men. Other baseline characteristics are presented in Table 1.
 Click to view | Table 1. Baseline Characteristics of the Study Participants |
Inter-rater reliability
The inter-rater reliability of the measurements of the three MRI-derived abdominal volumes was as follows: ICC of 0.998 (95% CI: 0.996 - 0.998) for VAT volume, 0.998 (95% CI: 0.997 - 0.999) for SAT volume and 0.998 (95% CI: 0.997 - 0.999) for TAb volume (Fig. 2).
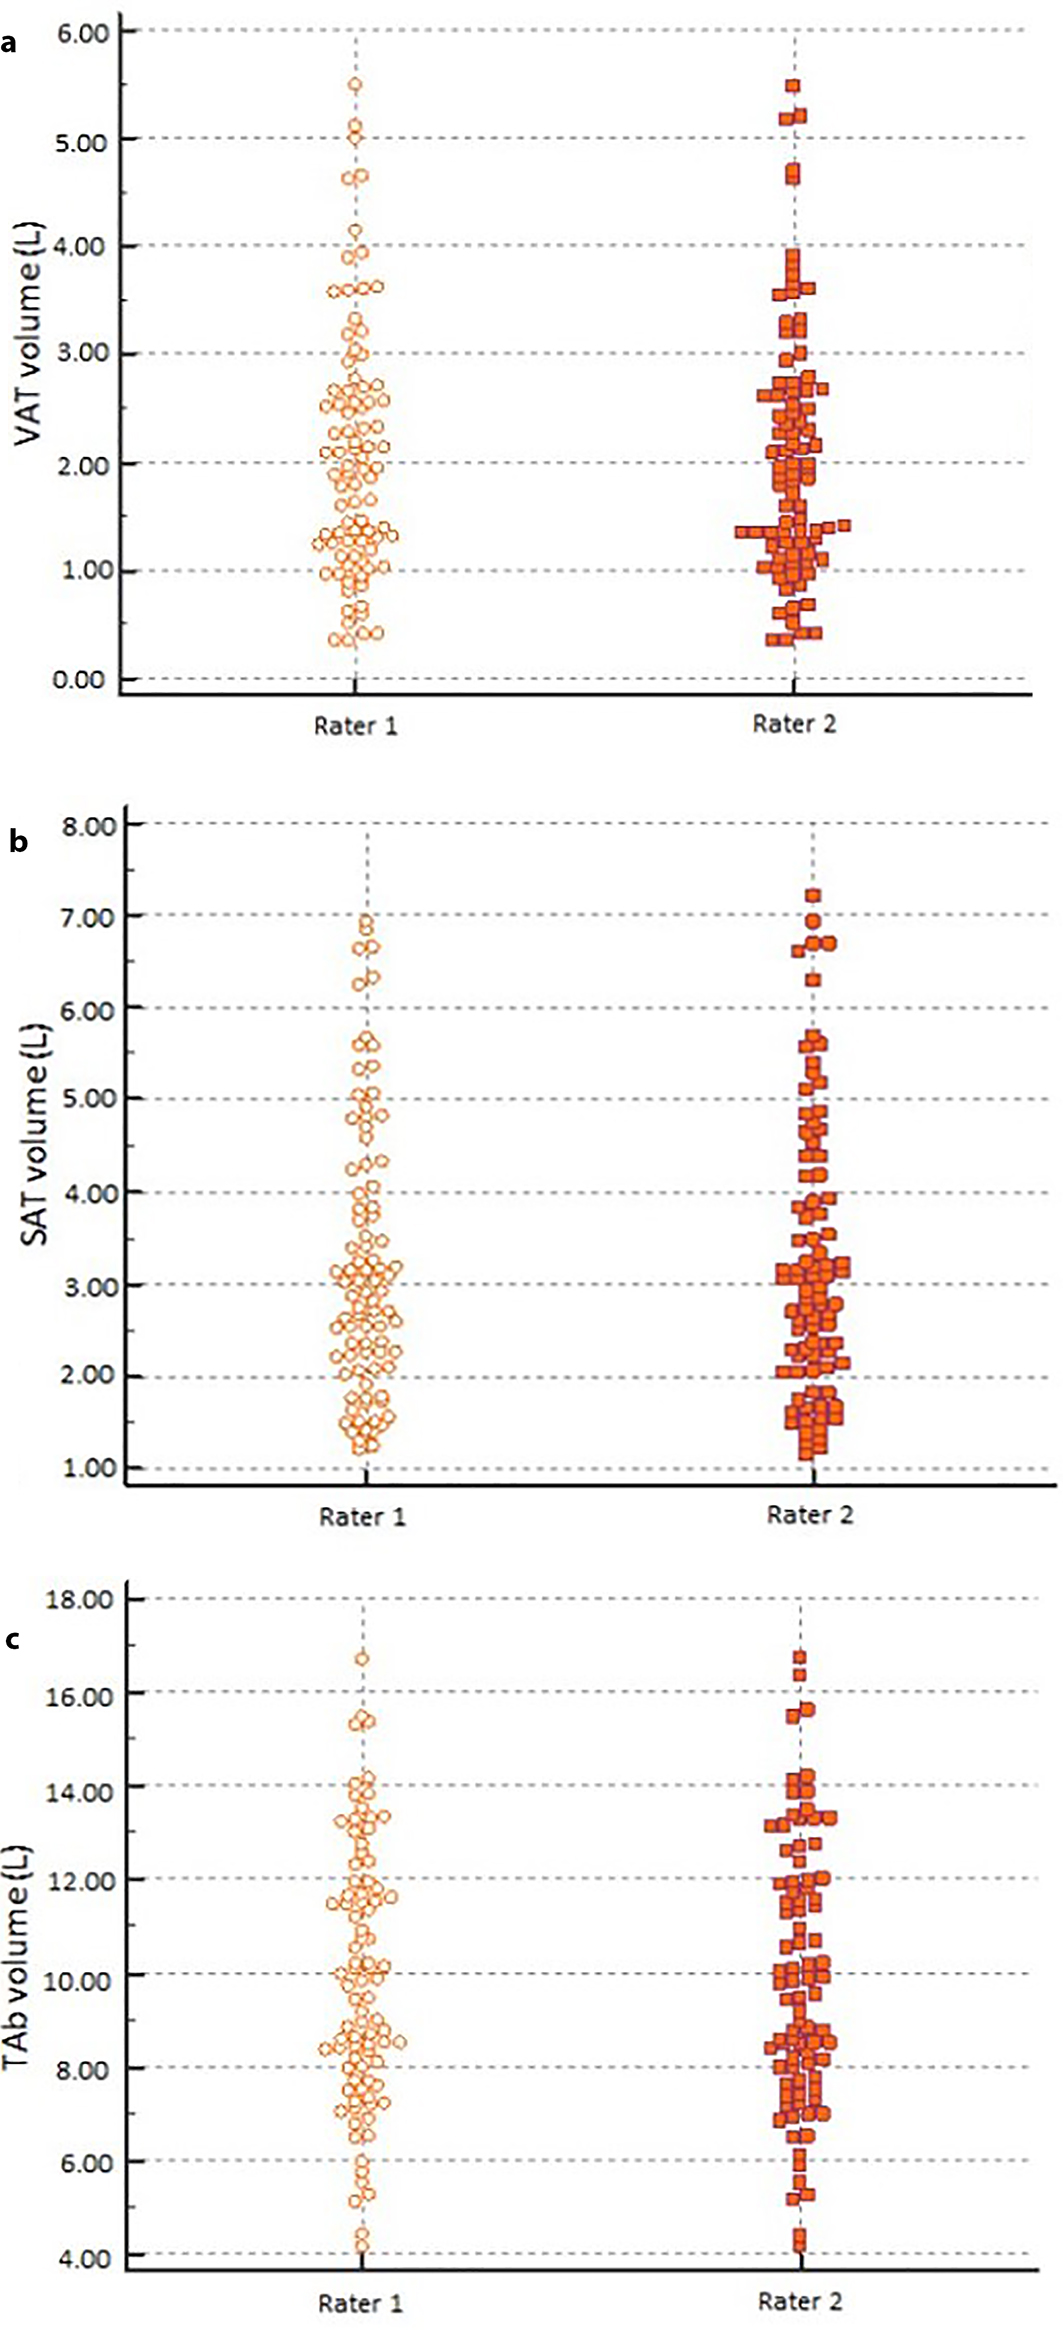 Click for large image | Figure 2. Comparison of VAT volume (a), SAT volume (b), and TAb volume (c) measurements between the independent raters. VAT: visceral adipose tissue; SAT: subcutaneous adipose tissue; TAb: total abdominal. |
Abdominal volumes stratified by ethnicity
The mean ± SD of VAT volume was 1.74 ± 1.04, 2.58 ± 1.10 and 1.82 ± 0.98 L in Caucasians, Maori/PI and other ethnicities, respectively. VAT volume was significantly higher among Maori/PI in the unadjusted and all the three adjusted models, with the highest OR (95% CI; P value) of 2.146 (1.095 - 4.209; P = 0.026) in model 3. The mean ± SD of SAT volume was 3.18 ± 1.32, 3.62 ± 1.64 and 3.00 ± 1.60 L in Caucasians, Maori/PI and other ethnicities, respectively. SAT volume did not significantly differ between the ethnicities in both the unadjusted and adjusted models (Table 2). The mean ± SD of TAb volume was 9.64 ± 2.69, 11.19 ± 2.45 and 9.00 ± 2.89 L in Caucasians, Maori/PI and other ethnicities, respectively. TAb volume was significantly higher among Maori/PI in the unadjusted model with an OR of 1.233 (1.012 - 1.503; P = 0.038). However, it was not significantly different in any of the adjusted models (Table 2).
Click to view | Table 2. Ethnic Variations in MRI-Derived Abdominal Volumes |
WC and abdominal volumes
Overall, WC explained up to 46.9% of variance in VAT volume with a β coefficient of 44.519 (33.532 - 57.832; P < 0.001), 67.6% of variance in SAT volume with a β coefficient of 8.655 (7.272 - 10.038; P < 0.001) and 69.2% of variance in TAb volume with a β coefficient of 4.540 (3.840 - 5.239; P < 0.001), in the most adjusted model.
In Caucasians, WC explained up to 50.7% of variance in VAT volume with a β coefficient of 38.766 (19.700 - 57.832; P = 0.001), 66.8% of variance in SAT volume with a β coefficient of 7.980 (5.216 - 10.743; P < 0.001) and 64.3% of variance in TAb volume with a β coefficient of 4.540 (3.840 - 5.239; P < 0.001), in the most adjusted model.
In Maori/PI, WC explained up to 72.9% of variance in VAT volume with a β coefficient of 64.270 (35.571 - 92.969; P < 0.001), 67.8% of variance in SAT volume with a β coefficient of 11.404 (5.486 - 17.321; P = 0.001) and 81.4% of variance in TAb volume with a β coefficient of 5.439 (3.609 - 7.269; P < 0.001), in the most adjusted model.
In other ethnicities, WC explained up to 41.7% of variance in VAT volume with a β coefficient of 39.052 (6.548 - 71.556; P = 0.021), 90.5% of variance in SAT volume with a β coefficient of 8.919 (6.915 - 10.924; P < 0.001) and 75.9% of variance in TAb volume with a β coefficient of 4.928 (2.946 - 6.911; P <0.01), in the most adjusted model.
Other ethnicity-specific associations between WC and VAT, SAT and TAb volumes are presented in Table 3.
Click to view | Table 3. Ethnicity-Specific Associations Between Waist Circumference and Abdominal Volumes |
BMI and abdominal volumes
Overall, BMI explained up to 49.9% of variance in VAT volume with a β coefficient of 19.941 (15.057 - 24.825; P < 0.001), 76.9% of variance in SAT volume with a β coefficient of 3.846 (3.342 - 4.350; P < 0.001) and 78.6% of variance in TAb volume with a β coefficient of 2.059 (1.802 - 2.316; P < 0.001), in the most adjusted model.
In Caucasians, BMI explained up to 52.1% of variance in VAT volume with a β coefficient of 14.857 (7.817 - 21.898; P < 0.001), 74.5% of variance in SAT volume with a β coefficient of 3.149 (2.312 - 3.985; P < 0.001) and 80.8% of variance in TAb volume with a β coefficient of 1.763 (1.378 - 2.148; P < 0.001), in the most adjusted model.
In Maori/PI, BMI explained up to 67.6% of variance in VAT volume with a β coefficient of 21.205 (6.288 - 36.122; P = 0.008), 89.8% of variance in SAT volume with a β coefficient of 5.868 (4.273 - 7.463; P < 0.001) and 91.5% of variance in TAb volume with a β coefficient of 2.436 (1.846 - 3.027; P < 0.001), in the most adjusted model.
In other ethnicities, BMI explained up to 44.1% of variance in VAT volume with a β coefficient of 14.749 (0.047 - 29.453; P = 0.049), 88.3% of variance in SAT volume with a β coefficient of 3.296 (2.454 - 4.138; P < 0.001) and 74.0% of variance in TAb volume with a β coefficient of 1.813 (1.031 - 2.594; P < 0.001), in the most adjusted model.
Other ethnicity-specific associations between BMI and VAT, SAT and TAb volumes are presented in Table 4.
Click to view | Table 4. Ethnicity-Specific Associations Between Body Mass Index and Abdominal Volumes |
Ethnicity-specific predictive equations
Ethnicity-specific equations that estimate VAT volume were constructed. In Caucasians, only BMI, age and sex were significantly associated with VAT volume (Table 5). The predicted VAT volume in Caucasians was calibrated with MRI-derived VAT volume, which yielded an R2 value of 0.636. In Maori/PI, only WC and sex were significantly associated with VAT volume (Table 5). The predicted VAT volume in Maori/PI was calibrated with MRI-derived VAT volume, which yielded an R2 value of 0.593. In other ethnicities, only WC and height were significantly associated with VAT volume (Table 5). The predicted VAT volume in other ethnicities was calibrated with MRI-derived VAT volume, which yielded an R2 value of 0.546.
Click to view | Table 5. Ethnicity-Specific Equations to Estimate VAT Volume |
| Discussion | ▴Top |
To the best of our knowledge, this is the first MRI study to investigate differences in adult abdominal body composition between Maori/PI and Caucasians as well as other ethnicities. State-of-the-art MRI was used to derive three abdominal volumes (VAT, SAT and TAb) in the present study, whereas most of the previously published studies in the field elected to use a time-saving (but less accurate) approach - VAT and SAT areas. All abdominal MRI series were analyzed by two independent raters and an excellent inter-rater reliability (ICCs > 0.9) was achieved. Results were yielded using multi-level statistical modelling that adjusted for several covariates, including age, sex and prediabetes/diabetes status. There were three key findings. First, VAT volume was significantly higher among Maori and PI compared with Caucasians, consistently across all the statistical models. Second, there were ethnicity-specific associations between conventional anthropometric indices (BMI and WC) and VAT volume (as well as the other two abdominal volumes). Third, ethnicity-specific equations that predict MRI-derived VAT volume from non-MRI-related variables (specifically, demographic factors and anthropometric indices) were developed.
One of the novel findings of this study was that Maori and PI have significantly higher VAT volume compared with Caucasians, despite having similar SAT volume. Maori and PI have the highest rates of obesity in adult population of New Zealand, with 50% of Maori and 69% of PI classified as obese [20]. The findings of the present study further show that excessive fat accumulation in the VAT compartment, and not the SAT compartment, primarily contributes to the overall adiposity in this ethnic group. Further, there was no statistically significant difference in SAT volume between the ethnicities. Physiologically, SAT acts as a “metabolic sink” with high propensity to absorbing excess circulating free fatty acids and glycerol, which in turn gets stored as triglycerides in adipocytes [7]. Once SAT exceeds its lipid storage capacity, fat begins to accumulate in other compartments, in particular VAT [21]. It is believed that individuals with higher VAT volume are at an increased risk of developing metabolic disturbances [18, 22-24]. While demographic factors (such as age and sex) are known to influence VAT accumulation [25], emerging evidence also shows that certain genetic mutations disturb lipid storage and energy homeostasis, leading to an increased propensity for VAT accumulation (independent of the presence of general adiposity) [26-28]. In the same vein, ethnic diversity and associated genetic backgrounds were also reported to influence fat distribution and abdominal composition in African Americans [29] and Asians [30]. The finding that Maori and PI have higher VAT volume (compared with Caucasians), independent of demographics and diabetes status, suggests that this ethnic group might be prone to excessive fat accumulation in the VAT compartment [31]. Future studies investigating genetic variants and gene expression patterns related to metabolism in Maori and PI will provide deeper insights into genetic susceptibility in these individuals.
To further explore the effect of ethnicity, we investigated the strength of associations between the abdominal volumes and conventional anthropometric indices (in both the unadjusted and adjusted analyses) in the three studied ethnic groups. In the overall cohort, both WC and BMI had stronger associations with SAT and TAb volumes than VAT volume, which is in concordance with the findings from previous studies in the USA [9, 32-34]. Although WC is considered a more accurate measure of abdominal adiposity than BMI, WC does not distinguish between SAT and VAT. Further, SAT comprises a larger proportion of abdominal adipose tissue [32, 35], which may explain why anthropometric indices have a stronger association with SAT than VAT. However, we also found that WC was better at estimating VAT volume among Maori and PI than other ethnicities, in both the unadjusted and adjusted models. From previous studies, it is worth noting that the degree of variance in VAT explained by WC was different in African Americans [32] and Filipinos [36] (compared with Caucasians). This suggests that WC does not estimate visceral adiposity with the same accuracy across various ethnic groups and, hence, its thresholds may not be appropriate to use in a “one size fits all” way. This also highlights the need for a more accurate ethnicity-tailored method to estimate VAT volume.
In the present study, ethnicity-specific equations that predict VAT volume were constructed using a combination of demographic and anthropometric variables. Of the anthropometric variables investigated, BMI was a better predictor of VAT volume in Caucasians whereas WC was a better predictor of VAT volume in Maori/PI and other ethnicities. The predicted VAT volume explained 54.6-63.6% of variance in the MRI-derived VAT volume, which is similar to the goodness of fit of other published equations that estimate VAT volume in other ethnic settings (51-81%) [34, 37, 38]. Previous studies have established VAT as a significant risk factor for metabolic syndrome [39, 40] and diabetes mellitus [41]. While the usefulness of VAT to predict an individual risk of morbidity is well recognized, it is not a routinely used marker of metabolic risk because of the complex, labor-intensive and time-consuming post-processing of CT/MRI images. Further, MRI and CT are costly and access to them is limited (especially in developing countries). Therefore, an indirect and accurate estimation of VAT volume might be a valuable tool to identify high-risk individuals. Ethnicity-specific equations based on simple and readily available variables, as derived in the present study, might prove useful in estimation of VAT volume in the general population. This method could be easily used in health screening and grading metabolic health risk, hence allowing timely preventative interventions (e.g. diet and lifestyle modifications). However, predictive power of the equations and performance not only at a group level but also at an individual level need to be tested in future studies.
There are several limitations that need to be addressed. First, the present study included individuals with a history of acute pancreatitis [42, 43]. This is because the project that had received funding was focused on glucose metabolism in individuals following acute pancreatitis [16, 18]. However, complete clinical resolution was achieved in all study participants prior to MRI acquisition and no conventional abnormalities of the pancreas were detected in all study participants. Further, all the studied associations were adjusted for pancreatitis-related characteristics to yield the most conservative estimates. Nevertheless, findings of the present study should be considered only hypothesis-generating and purposely designed studies are now warranted. Second, sexes were not evenly distributed between the groups whereas sex is an important determinant of fat distribution. However, all the studied associations were adjusted for sex. Third, the present study did not investigate genetic variations; therefore inferences cannot be made regarding innate differences in adipose tissue distribution [44, 45]. While our analysis did control for demographic and metabolic factors, future studies should investigate the prevalence of genetic variations among ethnic groups that may contribute to variance in patterns of fat accumulation. Fourth, the developed predictive equations were not validated because of the relatively small sample size. Internal and external validations of the equations are now warranted. Last, diet and physical activity might have influenced the studied associations. Unfortunately, these data were not available. However, if there were a bias, it would be a non-differential bias as there are no published data on differing patterns of diet and physical activity between the studied ethnicities.
In conclusion, Maori and PI have significantly increased accumulation of fat in the VAT compartment than Caucasians, even after controlling for demographic and metabolic factors. WC and BMI reflect different volume of the abdominal fat compartments in the studied ethnic groups. Accurate identification of individuals with high VAT volume across all ethnic groups may help to facilitate earlier lifestyle modification in high-risk individuals.
Acknowledgments
This study was part of the COSMOS program. COSMOS is supported in party by the Royal Society of New Zealand (Rutherford Discovery Fellowship to Associate Professor Max Petrov), which played no role in the study design, collection, analysis, interpretation of data, or writing of the manuscript.
Financial Disclosure
None.
Conflict of Interest
None.
Informed Consent
Informed consent was provided by all study participants.
Author Contributions
Data collection: Aya Cervantes, Jin U. Kim, Steve V. DeSouza; statistical analysis: Aya Cervantes, Ruma G. Singh; data interpretation: Aya Cervantes, Maxim S. Petrov; manuscript write-up: Aya Cervantes; revision of the manuscript: Jin U. Kim, Steve V. DeSouza, Ruma G. Singh, Maxim S. Petrov; study supervision: Maxim S. Petrov.
| References | ▴Top |
- Jensen MD. Role of body fat distribution and the metabolic complications of obesity. J Clin Endocrinol Metab. 2008;93(11 Suppl 1):S57-63.
doi pubmed - Porter SA, Massaro JM, Hoffmann U, Vasan RS, O'Donnel CJ, Fox CS. Abdominal subcutaneous adipose tissue: a protective fat depot? Diabetes Care. 2009;32(6):1068-1075.
doi pubmed - Ibrahim MM. Subcutaneous and visceral adipose tissue: structural and functional differences. Obes Rev. 2010;11(1):11-18.
doi pubmed - Singh RG, Pendharkar SA, Gillies NA, Miranda-Soberanis V, Plank LD, Petrov MS. Associations between circulating levels of adipocytokines and abdominal adiposity in patients after acute pancreatitis. Clin Exp Med. 2017;17(4):477-487.
doi pubmed - Gillies N, Pendharkar SA, Asrani VM, Mathew J, Windsor JA, Petrov MS. Interleukin-6 is associated with chronic hyperglycemia and insulin resistance in patients after acute pancreatitis. Pancreatology. 2016;16(5):748-755.
doi pubmed - Arner P. Differences in lipolysis between human subcutaneous and omental adipose tissues. Ann Med. 1995;27(4):435-438.
doi pubmed - Fain JN, Madan AK, Hiler ML, Cheema P, Bahouth SW. Comparison of the release of adipokines by adipose tissue, adipose tissue matrix, and adipocytes from visceral and subcutaneous abdominal adipose tissues of obese humans. Endocrinology. 2004;145(5):2273-2282.
doi pubmed - Petrov MS. Abdominal fat: a key player in metabolic acute pancreatitis. Am J Gastroenterol. 2013;108(1):140-142.
doi pubmed - Pouliot MC, Despres JP, Lemieux S, Moorjani S, Bouchard C, Tremblay A, Nadeau A, et al. Waist circumference and abdominal sagittal diameter: best simple anthropometric indexes of abdominal visceral adipose tissue accumulation and related cardiovascular risk in men and women. Am J Cardiol. 1994;73(7):460-468.
doi - de Koning L, Merchant AT, Pogue J, Anand SS. Waist circumference and waist-to-hip ratio as predictors of cardiovascular events: meta-regression analysis of prospective studies. Eur Heart J. 2007;28(7):850-856.
doi pubmed - Romero-Corral A, Somers VK, Sierra-Johnson J, Thomas RJ, Collazo-Clavell ML, Korinek J, Allison TG, et al. Accuracy of body mass index in diagnosing obesity in the adult general population. Int J Obes (Lond). 2008;32(6):959-966.
doi pubmed - Tulloch-Reid MK, Williams DE, Looker HC, Hanson RL, Knowler WC. Do measures of body fat distribution provide information on the risk of type 2 diabetes in addition to measures of general obesity? Comparison of anthropometric predictors of type 2 diabetes in Pima Indians. Diabetes Care. 2003;26(9):2556-2561.
doi pubmed - Misra A, Wasir JS, Vikram NK. Waist circumference criteria for the diagnosis of abdominal obesity are not applicable uniformly to all populations and ethnic groups. Nutrition. 2005;21(9):969-976.
doi pubmed - Lovejoy JC, de la Bretonne JA, Klemperer M, Tulley R. Abdominal fat distribution and metabolic risk factors: effects of race. Metabolism. 1996;45(9):1119-1124.
doi - Kadowaki T, Sekikawa A, Murata K, Maegawa H, Takamiya T, Okamura T, El-Saed A, et al. Japanese men have larger areas of visceral adipose tissue than Caucasian men in the same levels of waist circumference in a population-based study. Int J Obes (Lond). 2006;30(7):1163-1165.
doi pubmed - Singh RG, Nguyen NN, DeSouza SV, Pendharkar SA, Petrov MS. Comprehensive analysis of body composition and insulin traits associated with intra-pancreatic fat deposition in healthy individuals and people with new-onset prediabetes/diabetes after acute pancreatitis. Diabetes Obes Metab. 2019;21(2):417-423.
doi pubmed - DeSouza SV, Priya S, Cho J, Singh RG, Petrov MS. Pancreas shrinkage following recurrent acute pancreatitis: an MRI study. Eur Radiol. 2019; [Epub ahead of print].
doi - Singh RG, Cervantes A, Kim JU, Nguyen NN, DeSouza SV, Dokpuang D, Lu J, et al. Intra-pancreatic fat deposition and visceral fat volume are associated with the presence of diabetes after acute pancreatitis. Am J Physiol Gastrointest Liver Physiol. 2019; [Epub ahead of print].
doi - American Diabetes A. 2. Classification and Diagnosis of Diabetes: Standards of Medical Care in Diabetes-2018. Diabetes Care. 2018;41(Suppl 1):S13-S27.
doi pubmed - Das SL, Kennedy JI, Murphy R, Phillips AR, Windsor JA, Petrov MS. Relationship between the exocrine and endocrine pancreas after acute pancreatitis. World J Gastroenterol. 2014;20(45):17196-17205.
doi pubmed - Freedland ES. Metabolism role of a critical visceral adipose tissue threshold (CVATT) in metabolic syndrome: implications for controlling dietary carbohydrates: a review. Nutr Metab. 2004;1:1-12.
doi pubmed - Despres JP. Abdominal obesity as important component of insulin-resistance syndrome. Nutrition. 1993;9(5):452-459.
pubmed - Preis SR, Massaro JM, Robins SJ, Hoffmann U, Vasan RS, Irlbeck T, Meigs JB, et al. Abdominal subcutaneous and visceral adipose tissue and insulin resistance in the Framingham heart study. Obesity (Silver Spring). 2010;18(11):2191-2198.
doi pubmed - Petrov MS, Yadav D. Global epidemiology and holistic prevention of pancreatitis. Nat Rev Gastroenterol Hepatol. 2019;16(3):175-184.
doi pubmed - Hunter GR, Gower BA, Kane BL. Age related shift in visceral fat. Int J Body Compos Res. 2010;8(3):103-108.
pubmed - Mills GW, Avery PJ, McCarthy MI, Hattersley AT, Levy JC, Hitman GA, Sampson M, et al. Heritability estimates for beta cell function and features of the insulin resistance syndrome in UK families with an increased susceptibility to type 2 diabetes. Diabetologia. 2004;47(4):732-738.
doi pubmed - Jackson AS, Stanforth PR, Gagnon J, Rankinen T, Leon AS, Rao DC, Skinner JS, et al. The effect of sex, age and race on estimating percentage body fat from body mass index: The Heritage Family Study. Int J Obes Relat Metab Disord. 2002;26(6):789-796.
doi pubmed - Heid IM, Jackson AU, Randall JC, Winkler TW, Qi L, Steinthorsdottir V, Thorleifsson G, et al. Meta-analysis identifies 13 new loci associated with waist-hip ratio and reveals sexual dimorphism in the genetic basis of fat distribution. Nat Genet. 2010;42(11):949-960.
doi pubmed - Cardel M, Higgins PB, Willig AL, Keita AD, Casazza K, Gower BA, Fernandez JR. African genetic admixture is associated with body composition and fat distribution in a cross-sectional study of children. Int J Obes (Lond). 2011;35(1):60-65.
doi pubmed - Wang T, Ma X, Peng D, Zhang R, Sun X, Chen M, Yan J, et al. Effects of obesity related genetic variations on visceral and subcutaneous fat distribution in a Chinese population. Sci Rep. 2016;6:20691.
doi pubmed - Pendharkar SA, Mathew J, Zhao J, Windsor JA, Exeter DJ, Petrov MS. Ethnic and geographic variations in the incidence of pancreatitis and post-pancreatitis diabetes mellitus in New Zealand: a nationwide population-based study. N Z Med J. 2017;130(1450):55-68.
pubmed - Camhi SM, Bray GA, Bouchard C, Greenway FL, Johnson WD, Newton RL, Ravussin E, et al. The relationship of waist circumference and BMI to visceral, subcutaneous, and total body fat: sex and race differences. Obesity (Silver Spring). 2011;19(2):402-408.
doi pubmed - Bouchard C. BMI, fat mass, abdominal adiposity and visceral fat: where is the 'beef'? Int J Obes (Lond). 2007;31(10):1552-1553.
doi pubmed - Ross R, Leger L, Morris D, de Guise J, Guardo R. Quantification of adipose tissue by MRI: relationship with anthropometric variables. J Appl Physiol (1985). 1992;72(2):787-795.
doi pubmed - Perry AC, Applegate EB, Jackson ML, Deprima S, Goldberg RB, Ross R, Kempner L, et al. Racial differences in visceral adipose tissue but not anthropometric markers of health-related variables. J Appl Physiol (1985). 2000;89(2):636-643.
doi pubmed - Araneta MR, Barrett-Connor E. Ethnic differences in visceral adipose tissue and type 2 diabetes: Filipino, African-American, and white women. Obes Res. 2005;13(8):1458-1465.
doi pubmed - Eastwood SV, Tillin T, Wright A, Heasman J, Willis J, Godsland IF, Forouhi N, et al. Estimation of CT-derived abdominal visceral and subcutaneous adipose tissue depots from anthropometry in Europeans, South Asians and African Caribbeans. PLoS One. 2013;8(9):e75085.
doi pubmed - Conway JM, Chanetsa FF, Wang P. Intraabdominal adipose tissue and anthropometric surrogates in African American women with upper- and lower-body obesity. Am J Clin Nutr. 1997;66(6):1345-1351.
doi pubmed - Fox CS, Massaro JM, Hoffmann U, Pou KM, Maurovich-Horvat P, Liu CY, Vasan RS, et al. Abdominal visceral and subcutaneous adipose tissue compartments: association with metabolic risk factors in the Framingham Heart Study. Circulation. 2007;116(1):39-48.
doi pubmed - Kwon H, Kim D, Kim JS. Body fat distribution and the risk of incident metabolic syndrome: a longitudinal cohort study. Sci Rep. 2017;7(1):10955.
doi pubmed - Ng AC, Wai DC, Tai ES, Ng KM, Chan LL. Visceral adipose tissue, but not waist circumference is a better measure of metabolic risk in Singaporean Chinese and Indian men. Nutr Diabetes. 2012;2:e38.
doi pubmed - Cervantes A, Singh RG, Pendharkar SA, Bharmal SH, Petrov MS. Profile of gut hormones, pancreatic hormones and pro-inflammatory cytokines in New Zealand Maori. Gastroenterology Res. 2018;11(4):280-289.
doi pubmed - Cervantes A, Waymouth EK, Petrov MS. African-Americans and Indigenous peoples have increased burden of diseases of the exocrine pancreas: a systematic review and meta-analysis. Dig Dis Sci. 2019;64(1):249-261.
doi pubmed - Merriman TR, Wilcox PL. Cardio-metabolic disease genetic risk factors among Maori and Pacific Island people in Aotearoa New Zealand: current state of knowledge and future directions. Ann Hum Biol. 2018;45(3):202-214.
doi pubmed - Krishnan M, Major TJ, Topless RK, Dewes O, Yu L, Thompson JMD, McCowan L, et al. Discordant association of the CREBRF rs373863828 A allele with increased BMI and protection from type 2 diabetes in Maori and Pacific (Polynesian) people living in Aotearoa/New Zealand. Diabetologia. 2018;61(7):1603-1613.
doi pubmed
This article is distributed under the terms of the Creative Commons Attribution Non-Commercial 4.0 International License, which permits unrestricted non-commercial use, distribution, and reproduction in any medium, provided the original work is properly cited.
Journal of Clinical Medicine Research is published by Elmer Press Inc.