| Journal of Clinical Medicine Research, ISSN 1918-3003 print, 1918-3011 online, Open Access |
| Article copyright, the authors; Journal compilation copyright, J Clin Med Res and Elmer Press Inc |
| Journal website http://www.jocmr.org |
Letter to the Editor
Volume 10, Number 9, September 2018, pages 732-735
Illustrating the Sense of a Network Meta-Analysis by Means of Dedicated Plots: A Way for Making It Conceptually Easier and More Immediately Understandable
Renato De Vecchisa, d, Carmelina Arianob, Angelos Rigopoulosc, Michel Noutsiasc
aPreventive Cardiology and Rehabilitation Unit, DSB 29 “S.Gennaro dei Poveri Hospital”, Napoli, Italy
bDepartment of Geriatrics, “Casa Sollievo della Sofferenza” Hospital, San Giovanni Rotondo, Italy
cMid-German Heart Center, Division of Cardiology, Angiology and Intensive Medical Care, University Hospital Halle, Martin-Luther-University Halle-Wittenberg, Halle, Germany
dCorresponding Author: Renato De Vecchis, Preventive Cardiology and Rehabilitation Unit, DSB 29 “S.Gennaro dei Poveri Hospital”, via S. Gennaro dei Poveri 25, 80136 Napoli, Italy
Manuscript submitted July 9, 2018, accepted July 20, 2018
Short title: Network Meta-Analysis Plots: A Useful Tool
doi: https://doi.org/10.14740/jocmr3536w
When there is a need to compare three or more treatments for the same clinical indication, the network meta-analysis (NeMa) offers the important advantage of “incorporating” in a single analysis all the evidence available, allowing therefore to better manage any condition of multiple comparisons. Therefore NeMa overcomes the main limit of traditional meta-analysis; the latter, in fact, is able to compare two treatments against each other, but is not able to analyze the cases in which the treatment regimens to be compared are ≥ 3. Considering on the one hand two innovative treatments T1 and T2 and on the other hand the corresponding standard treatment S, it is frequent the case in which there are randomized controlled trials (RCTs) comparing T1 vs. S and also T2 vs. S, but there is a lack of controlled head-to-head comparison studies between the two innovative drugs, i.e., studies based on direct comparison of T1 with T2. Within a NeMa, the comparison between two treatments that have been the subject of a specific comparative RTC is defined “direct” (in this example, the comparisons T1 vs. S and T2 vs. S), while we usually term “indirect” the comparison between two treatments for which it would be interesting make a comparative assessment, but for which a specific RCT does not exist yet (e.g., T1 vs. T2).
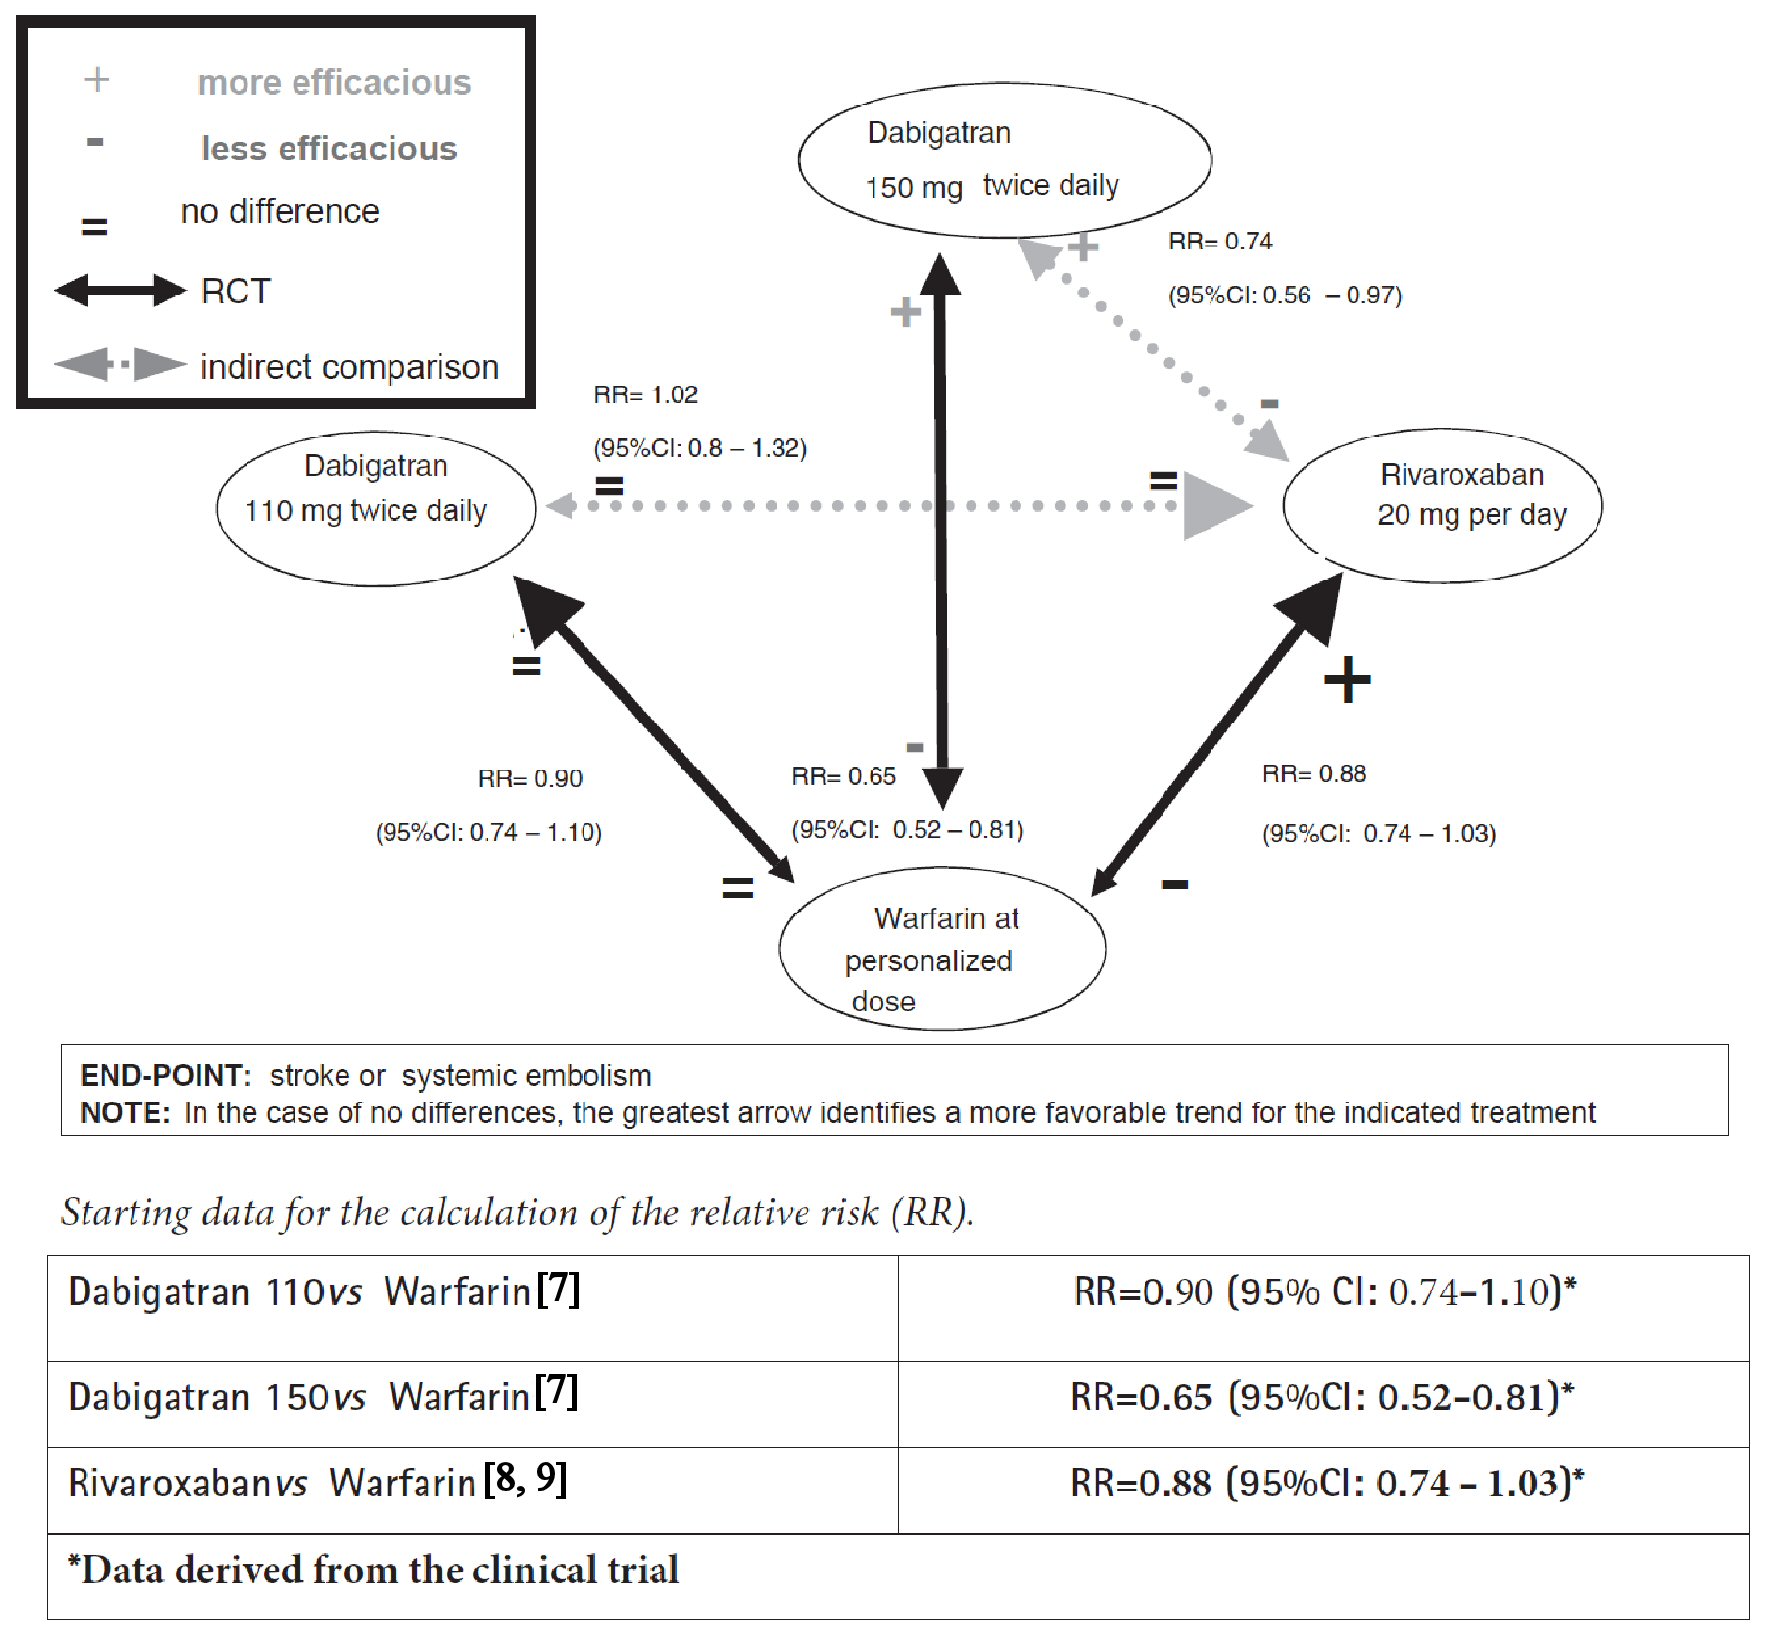
According to personalized way of representing the NeMa graphs adopted by our team, the direct comparisons are depicted by means of continuous arrows, while the indirect ones are represented by dashed arrows (Fig. 1).
 Click for large image | Figure 1. Network meta-analysis graph concerning comparisons between dabigatran, rivaroxaban and warfarin in patients with atrial fibrillation. |
The statistical calculation techniques concerning NeMa are complex. Therefore, on this point we prefer to refer to the specialized literature about the subject [1-3]. Nevertheless, as for the interpretation of the results, our modality of drawing the NeMa graphs might become a major strength of this new technique, due to communicative efficacy of the instrument and its ability to synthesize the experimental evidence.
What can the reader receive from this network of arrows and numbers? First of all, the distinction between continuous arrows and dashed arrows seems to be very functional to us in order to identify direct and indirect comparisons. Moreover, the symbols +, - and =, adopted to indicate the data with statistical significance of each comparison, represent a useful notation in our opinion.
Despite the graphical effectiveness of this innovative tool, the issue of what is the real meaning of the NeMa is still alive, that is, it is open to more than one interpretation. In fact, there are more conservative positions, which recognize for the NeMa only the merit of proposing in quantitative terms what is already evident in narrative terms, and more favorable positions according to which all these statistical comparisons, both direct and indirect, deserve in full to be presented because they provide useful knowledge to the problem of multiple comparisons between subjects, e.g. between multiple different drugs. To illustrate the practical application of NeMa, two examples are given below.
Example 1 is the first example which takes into consideration two widely known anticoagulant drugs (dabigatran and rivaroxaban) studied in the treatment of patients with atrial fibrillation at risk of cardio-embolic stroke or non-central nervous system (CNS) systemic embolism (renal, splenic, mesenteric, peripheral arterial embolism, etc.). No RCT has been reported in the literature to directly compare dabigatran with rivaroxaban in the clinical setting of non-valvular atrial fibrillation (NVAF). In fact, the three currently available studies of direct comparison of dabigatran with rivaroxaban [4-6] are observational studies, more exactly retrospective cohort studies, and therefore, as such, burdened by the threat of possible biases, for example confounding by indication. On the other hand, for the prevention of cardio-embolic stroke in NVAF there are two large RCTs, the former of which includes dabigatran [7] whereas the latter is centered around rivaroxaban [8, 9], both having the warfarin as comparator drug, administered according to international normalized ratio (INR).
More exactly, in the trial by Connolly et al [7] dabigatran was administered at a dose of 110 mg twice daily to a first group of patients, at a dose of 150 mg twice daily to a second group with the aim of comparing these two groups with a third group of patients receiving warfarin according to their INR. Conversely, in the ROCKET-AF trial [8, 9], rivaroxaban was given at a dose of 20 mg per day. The two studies differ for the selection modality of patient population: for the ROCKET-AF trial the patient population had at least two risk factors and a CHADS2 score ≥ 3; for the RE-LY trial the patients had at least one risk factor and a CHADS2 score ≥ 0. In both studies, the primary end-point was the occurrence of stroke or non-CNS systemic embolism.
The results of the dabigatran trial show that, compared to warfarin, the new anticoagulant at a dose of 150 mg twice daily has greater efficacy and equal adverse reactions (major bleeding), while at a dose of 110 mg twice daily it is equally effective and shows less adverse reactions, in particular less cases of major bleeding. On the other hand, the rivaroxaban trial shows that the new anticoagulant has a substantially overlapping efficacy compared to warfarin, albeit the trend in favor of the new drug does not reach the threshold of statistical significance. In the absence of a direct comparison trial between dabigatran and rivaroxaban, the network meta-analysis summarizes all the comparative efficacy data concerning these three drugs (Fig. 1) [7-9].
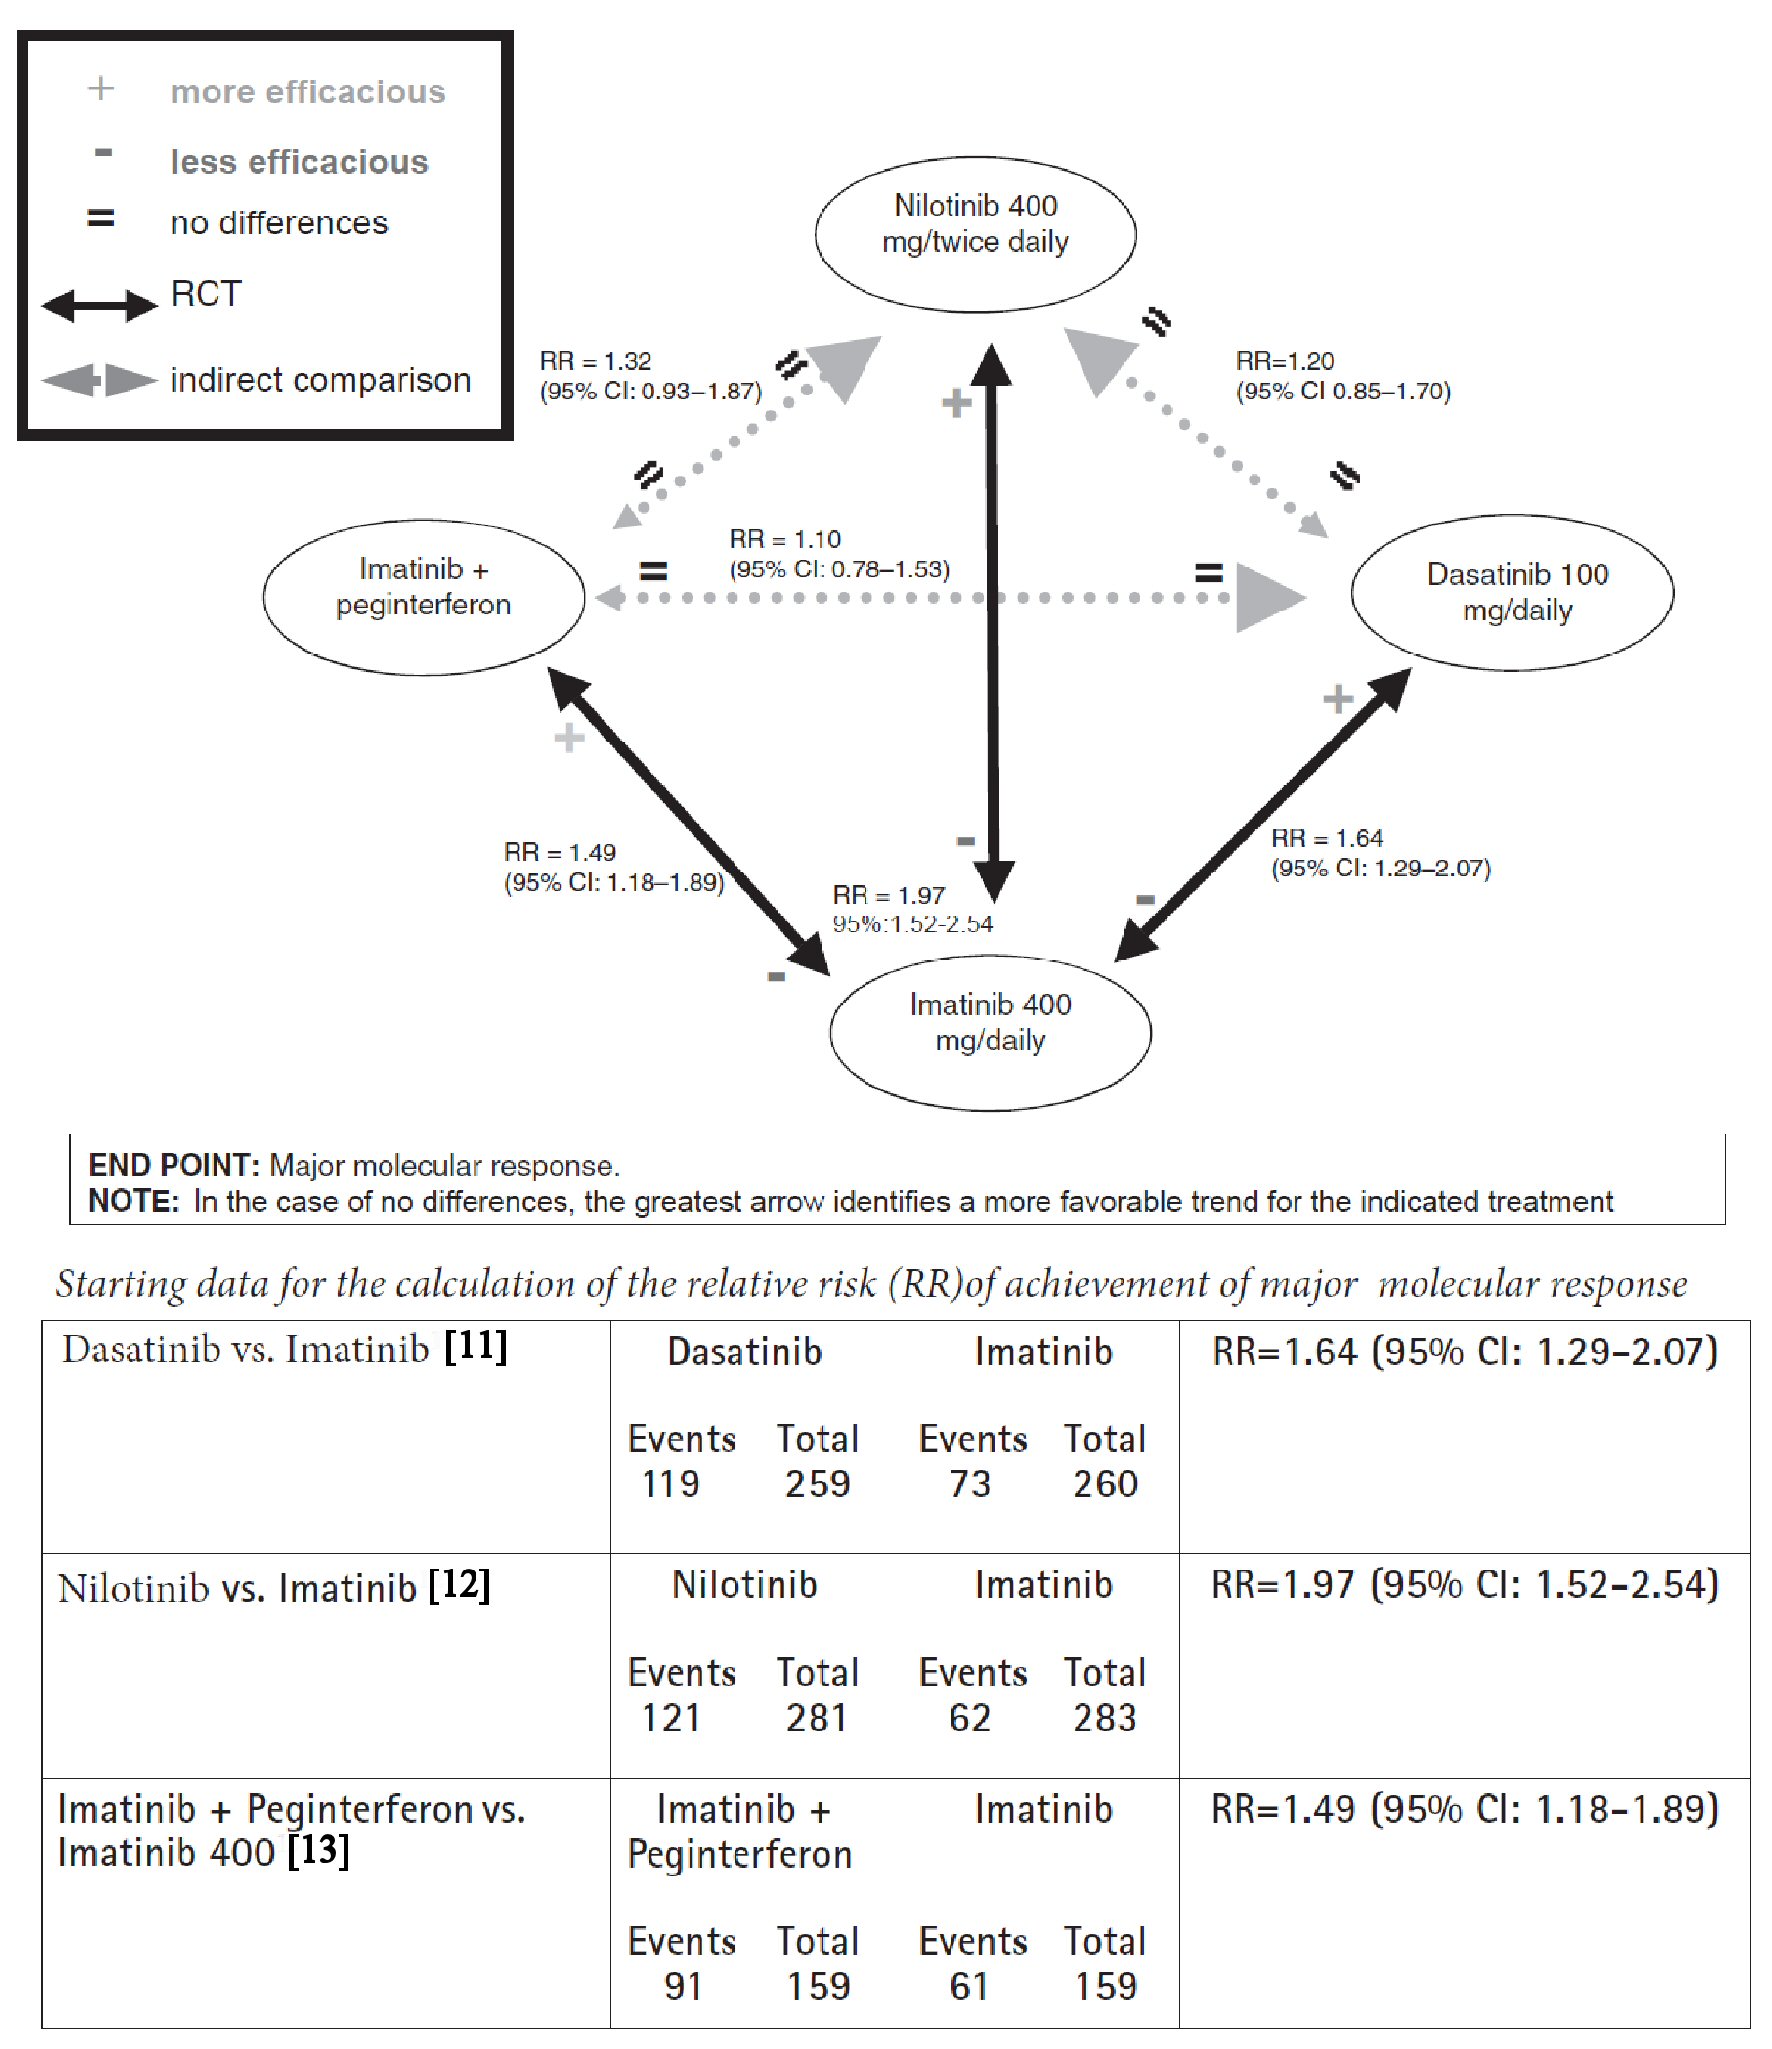
Example 2 is the second example which concerns the first-line treatment of chronic myeloid leukemia in Philadelphia chromosome-positive patients. Since the time of the first trial (which dates back to 2003) [10], imatinib has been proved to be a safe and effective standard of care in first-line treatment of chronic myeloid leukemia. In 2010, a study of dasatinib as first-line [11] showed significantly better results than imatinib, and at the same exact time a study centered on nilotinib [12] demonstrated the superiority of this second drug compared to imatinib. Finally, in December 2010, a study was published that showed the superiority of the combination therapy imatinib + pegylated interferon compared to imatinib alone [13]. Head-to-head comparison trials among the three most innovative options, namely direct comparisons concerning nilotinib vs. dasatinib vs. imatinib + interferon are missing. Choosing the endpoint of the “major molecular response” at 12 months, the network meta-analysis generates the scheme illustrated in Figure 2 [11-13]. Based on the data shown, no significant difference appears to emerge between the three new treatments.
 Click for large image | Figure 2. Network meta-analysis graph concerning comparisons between imatinib, dasatinib, nilotinib, and association imatinib plus peginterferon in chronic myeloid leukemia with positivity of chromosome Philadelphia. End-point: major molecular response. |
In conclusion, NeMa might play a role of paramount importance in the evidence-based medicine and our network plots may be useful as an innovative iconographic complement for data presentation.
Conflict of Interest
Renato De Vecchis, Carmelina Ariano and Angelos Rigopoulos state that they have no conflict of interest to declare. Michel Noutsias releases the following declaration about his potential conflict of interest. Michel Noutsias has received grants by the Deutsche Forschungsgemeinschaft (DFG) through the Sonderforschungsbereich Transregio19 “Inflammatory Cardiomyopathy” (SFBTR19; TP B2), and by the University Hospital Giessen and Marburg Foundation Grant “T cell functionality” (UKGM 10/2009). Michel Noutsias has been consultant to the Institute for Cardiac Diagnosis and Therapy, Berlin (June, 2004 - June, 2008) and has received honoraria for presentations and/or participated in advisory boards from AstraZeneca, Bayer, Boehringer Ingelheim, Fresenius, Miltenyi Biotech, Novartis, Pfizer and Zoll.
| References | ▴Top |
- Lumley T. Network meta-analysis for indirect treatment comparisons. Stat Med. 2002;21(16):2313-2324.
doi pubmed - Ades AE, Mavranezouli I, Dias S, Welton NJ, Whittington C, Kendall T. Network metaanalysis with competing risk outcomes. Value Health. 2010;13:976-83.
doi pubmed - Brignardello-Petersen R, Bonner A, Alexander PE, Siemieniuk RA, Furukawa TA, Rochwerg B, Hazlewood GS, et al. Advances in the GRADE approach to rate the certainty in estimates from a network meta-analysis. J Clin Epidemiol. 2018;93:36-44.
doi pubmed - Graham DJ, Reichman ME, Wernecke M, Hsueh YH, Izem R, Southworth MR, Wei Y, et al. Stroke, bleeding, and mortality risks in elderly medicare beneficiaries treated with dabigatran or rivaroxaban for nonvalvular atrial fibrillation. JAMA Intern Med. 2016;176(11):1662-1671.
doi pubmed - Hernandez I, Zhang Y. Comparing stroke and bleeding with rivaroxaban and dabigatran in atrial fibrillation: analysis of the US Medicare Part D data. Am J Cardiovasc Drugs. 2017;17(1):37-47.
doi pubmed - Noseworthy PA, Yao X, Abraham NS, Sangaralingham LR, McBane RD, Shah ND. Direct Comparison of Dabigatran, Rivaroxaban, and Apixaban for Effectiveness and Safety in Nonvalvular Atrial Fibrillation. Chest. 2016;150(6):1302-1312.
doi pubmed - Connolly SJ, Ezekowitz MD, Yusuf S, Reilly PA, Wallentin L, Randomized Evaluation of Long-Term Anticoagulation Therapy I. Newly identified events in the RE-LY trial. N Engl J Med. 2010;363(19):1875-1876.
doi pubmed - ROCKET AF Study Investigators. Rivaroxaban-once daily, oral, direct factor Xa inhibition compared with vitamin K antagonism for prevention of stroke and Embolism Trial in Atrial Fibrillation: rationale and design of the ROCKET AF study. Am Heart J. 2010;159(3):340-347 e341.
- Aalbers J. Rivaroxaban equals warfarin treatment in atrial fibrillation patients at high risk of stroke. Cardiovasc J Afr. 2010;21(6):342-343.
pubmed - Hughes TP, Kaeda J, Branford S, Rudzki Z, Hochhaus A, Hensley ML, Gathmann I, et al. Frequency of major molecular responses to imatinib or interferon alfa plus cytarabine in newly diagnosed chronic myeloid leukemia. N Engl J Med. 2003;349(15):1423-1432.
doi pubmed - Kantarjian H, Shah NP, Hochhaus A, Cortes J, Shah S, Ayala M, Moiraghi B, et al. Dasatinib versus imatinib in newly diagnosed chronic-phase chronic myeloid leukemia. N Engl J Med. 2010;362(24):2260-2270.
doi pubmed - Saglio G, Kim DW, Issaragrisil S, le Coutre P, Etienne G, Lobo C, Pasquini R, et al. Nilotinib versus imatinib for newly diagnosed chronic myeloid leukemia. N Engl J Med. 2010;362(24):2251-2259.
doi pubmed - Preudhomme C, Guilhot J, Nicolini FE, Guerci-Bresler A, Rigal-Huguet F, Maloisel F, Coiteux V, et al. Imatinib plus peginterferon alfa-2a in chronic myeloid leukemia. N Engl J Med. 2010;363(26):2511-2521.
doi pubmed
This article is distributed under the terms of the Creative Commons Attribution Non-Commercial 4.0 International License, which permits unrestricted non-commercial use, distribution, and reproduction in any medium, provided the original work is properly cited.
Journal of Clinical Medicine Research is published by Elmer Press Inc.


