

| Journal of Clinical Medicine Research, ISSN 1918-3003 print, 1918-3011 online, Open Access |
| Article copyright, the authors; Journal compilation copyright, J Clin Med Res and Elmer Press Inc |
| Journal website http://www.jocmr.org |
Original Article
Volume 10, Number 11, November 2018, pages 822-829
Higher Fasting and Postprandial Free Fatty Acid Levels Are Associated With Higher Muscle Insulin Resistance and Lower Insulin Secretion in Young Non-Obese Women
Mika Takeuchia, Satomi Minatob, c, Kaori Kitaokab, d, Ayaka Tsuboib, e, Miki Kurataa, b, Tsutomu Kazumib, f, g, Keisuke Fukuoa, b
aDepartment of Food Sciences and Nutrition, School of Human Environmental Sciences, Mukogawa Women’s University, Nishinomiya, Hyogo, Japan
bResearch Institute for Nutrition Sciences, Mukogawa Women’s University, Nishinomiya, Hyogo, Japan
cGraduate School of Human Science and Environment, University of Hyogo, Himeji, Hyogo, Japan
dDepartment of Welfare and Nutrition, Faculty of Health Welfare, Kansai University of Welfare Sciences, Kashiwara, Osaka, Japan
eDepartment of Nutrition, Osaka City Juso Hospital, Osaka, Japan
fDiabetes Division, Kohnan Kakogawa Hospital, Kakogawa, Hyogo, Japan
gCorresponding Author: Tsutomu Kazumi, Research Institute for Nutrition Sciences, Mukogawa Women’s University, 6-46, Ikebiraki-cho, Nishinomiya, Hyogo 663-8558, Japan
Manuscript submitted July 7, 2018, accepted August 20, 2018
Short title: FFA, Insulin Resistance and Insulin Secretion
doi: https://doi.org/10.14740/jocmr3534w
| Abstract | ▴Top |
Background: To assess the relationship of the shape of glucose concentration curve during a standardized meal test to serum free fatty acid (FFA) concentrations, insulin resistance and insulin secretion in young non-obese women.
Methods: Thirty-five young women had a standardized meal for breakfast with measurement of glucose, insulin and FFA concentrations at 0 (fasting), 30, 60 and 120 min; the areas under the concentration curves were calculated (AUCg, AUCi and AUCffa, respectively). Meal-induced insulin response (MIR) was calculated as the ratio between the incremental insulin and glucose concentrations during the first 30 min of meal tests. In two women (group A), post-breakfast glucose (PBG) returned to levels below fasting plasma glucose (FPG) at 30 min; in 15 and 11 women, PBG returned to levels below FPG at 60 and 120 min (groups B and C, respectively). In the remaining seven women (group D), PBG never fell below FPG.
Results: Despite no difference in fasting insulin and AUCi, fasting FFA, AUCg and AUCffa were the lowest in group A, increased linearly from group B to C and plateaued in group D, whereas MIR might be the highest in group A, decreased from group B to C and plateaued in group D.
Conclusion: Young women whose PBG returned to FPG more slowly had higher muscle insulin resistance and lower MIR associated with higher fasting and postprandial FFA levels compared with young women whose PBG returned to baseline more quickly.
Keywords: Free fatty acids; Insulin resistance; Insulin secretion; Young non-obese women
| Introduction | ▴Top |
Subjects with impaired glucose tolerance (IGT) or impaired fasting glucose (IFG) have an increased risk for type 2 diabetes [1-3]. Although more than half of the subjects who develop type 2 diabetes have IGT or IFG at baseline [4], prospective epidemiological studies have demonstrated that 30-40% of subjects have normal glucose tolerance (NGT) at baseline [1, 3, 5]. Studies in the general population have demonstrated that people with NGT whose postload plasma glucose returned to fasting plasma glucose (FPG) more slowly had greater insulin resistance, a lower early-phase insulin secretion and a higher risk of developing type 2 diabetes compared with people whose postload glucose concentration returned to baseline more quickly [6, 7]. We recently reported that young Japanese women whose post-breakfast glucose (PBG) never fell below FPG had lower meal-induced insulin responses (MIR) as compared to women whose PBG returned to levels below FPG [8].
Many of the metabolic abnormalities in subjects with IFG and/or IGT are thought to be secondary to obesity and increased insulin resistance [9]. Free fatty acids (FFAs) appear to link obesity not only to insulin resistance [10] but also to the deterioration in β-cell function [11]. Most obese subjects had elevated circulating FFA levels, which will inhibit insulin’s antilipolytic action that will further increase FFA release into the circulation [12]. However, there are limited data in humans, in non-obese subjects in particular, on the association between circulating FFA levels and pancreatic β-cell function. Almost all experimental studies in humans used lipid infusions to raise circulating FFA levels [13-16]. In the present study, we sought to assess in young non-obese Japanese women 1) the relationship of the shape of glucose concentration curve during a standardized meal test to insulin resistance and insulin secretion and 2) whether variations in fasting and postprandial FFA are associated with changes, if any, in insulin resistance and insulin secretion. The relationship to birth weight was also studied because it has an inverse relationship with disorders of glucose regulation in adults [17].
| Patients and Methods | ▴Top |
We studied 35 Japanese women aged 21 - 24 years (17 female collegiate athletes and 18 untrained female students) as previously reported [8, 18]. Of 35 women, 32 provided weight at birth, and height and weight at 12 and 15 years old either through maternal and child health notebook records (issued by each municipal office). Thirty-one women provided data on family history of diabetes, which considered positive if they reported that one of siblings, parents or grandparents were on anti-diabetic drugs. Subjects who reported that they were in treatment for acute or chronic inflammatory diseases, endocrine, cardiovascular, hepatic, renal diseases, hormonal contraception and unusual dietary habits were excluded. Nobody reported to receive any medications or have regular supplements. The study was approved by the Ethics Committees of the University (No. 07-28) to be in accordance with the Helsinki declaration. All subjects gave written consent after the experimental procedure had been explained.
Athletes were students from the Department of Health and Sports Sciences and non-athletes from the Department of Food Sciences and Nutrition of the Mukogawa Women’s University. They had been training regularly for 2 years or longer prior to the study, 5 h a day and 6 days a week and participated regularly in competitive events in their respective sport specialties. Athletes had regular training on the day before measurements. Although non-athletes were not engaged in any regular sport activity, they had 9,367 ± 1,971 steps/day (mean ± SD of a separate group of 77 non-athletes, who used a pedometer for consecutive 14 days and mean steps a day were calculated in each participant).
At 8:30 a.m. after a 12-h overnight fast, participants completed a standardized meal for breakfast and measurements of anthropometric indices and body composition as described later. Participants were asked to consume the entire meal within 15 min. Venous blood was drawn at baseline (0 min), 30, 60 and 120 min after the start of the meal for the measurement of plasma glucose (PG), serum insulin and FFA concentrations. PG was determined by the hexokinase/glucose-6-phosphate dehydrogenase method (inter-assay coefficient of variation (CV) < 2%). Serum insulin was measured by an ELISA method with a narrow specificity excluding des-31, des-32 and intact proinsulin (interassay CV < 6%). FFA was measured using enzymatic colorimetric method (Wako Chemicals, Tokyo, Japan). In fasted blood samples, the following were measured as previously reported [19]: serum cholesterol, triglycerides, HDL cholesterol, apolipoprotein AI and B-100 (apoAI and apoB, respectively), adiponectin, leptin and high-sensitivity C-reactive protein (hsCRP).
MIR was calculated as the increment in serum insulin (Δinsulin30) divided by the increment in PG (Δglucose30) during the first 30 min of the meal test and expressed in µU/mg. The area under the concentration curve (AUC) of PG, serum insulin and FFA was calculated with the trapezoidal method (AUCg, AUCi and AUCffa, respectively). Homeostasis model assessment of insulin resistance (HOMA-IR) was calculated as a more reflective surrogate of hepatic insulin resistance [20]. The adipose insulin resistance (Adipo-IR) was calculated as a product of fasting insulin and FFA concentrations [21].
The standardized test meal was developed by the Japanese Diabetes Society to assess both postprandial hyperglycemia and hyperlipidemia [22]. This meal was composed as a breakfast meal (total energy 450 kcal) and provided 33.3% of calories from fat (16.7 g), 51.4% from carbohydrates (57.8 g) and 15.3% from protein (17.2 g). The test meal contained more fat than a typical Japanese breakfast (20-25%) but comparable energy content (median: 423 kcal).
Lean mass, fat mass, and bone mineral mass for arms, legs, trunk and the total body were quantified by whole-body DXA (Hologic QDR-2000, software version 7.20D, Waltham, MA) as previously reported [19]. The leg region included the entire hip, thigh and leg. General adiposity was assessed using height-adjusted and weight-adjusted body fat. The former, fat mass index (FMI), was calculated as body fat mass in kg divided by height in meter squared and the latter, percent body fat, was calculated as body fat mass in kg divided by body weight in kg × 100. Abdominal fat accumulation was assessed by the ratio of trunk to leg fat [23].
Statistical analysis
Data were presented as mean ± SD unless otherwise stated. Due to deviation from normal distribution, HOMA-IR and hsCRP were logarithmically transformed for analyses. Young women were divided into four groups based on the relationship between PBG and FPG. Group A included two women whose PBG returned to levels below FPG at 30 min. Groups B (n = 15) and C (n = 11) included women whose PBG returned to levels below FPG at 60 and 120 min, respectively and group D included seven women whose PBG never fell below FPG. The association of continuous variables with groups A through D and P values for trend were derived using Jonckheeree-Terpstra test. In categorical data analysis, Cochran-Armitage trend analysis was used. ANOVA and then Bonferroni’s multiple comparison procedures were used when appropriate. A two-tailed P < 0.05 was considered statistically significant. All calculations were performed with SPSS system 15.0 (SPSS Inc., Chicago, IL, USA).
| Results | ▴Top |
As previously reported [8, 18], participants were normal weight, normoglycemic, normolipidemic and insulin-sensitive as demonstrated by mean HOMA-IR < 1.0 (Table 1). Birth weight < 2,500 g and positive family history of diabetes were reported in 6.3% (2/32) and 32.3% (10/32), respectively.
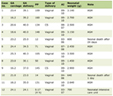 Click to view | Table 1. Anthropometric, Laboratory and Clinical Characteristics of the Four Study Groups Based on the Time (30, 60 and 120 Min or Never) That the Plasma Glucose (PG) Concentration During the OGTT Declined Below the Fasting PG Concentration |
There was no difference in BMI, waist circumference, FMI, percentage body fat, trunk/leg fat ratio, serum adiponectin, leptin and hsCRP among the four groups (Table 1). Although FPG, fasting insulin and hence HOMA-IR did not differ, fasting FFA was lower in groups A and B versus C and D (Figs. 1, 2 and Table 2). However, the difference in Adipo-IR, which showed a pattern similar to fasting FFA, was not significant (Table 2). There was also no difference in birth weight, the percentage of athletes and that of women with positive family history of diabetes (Table 1).
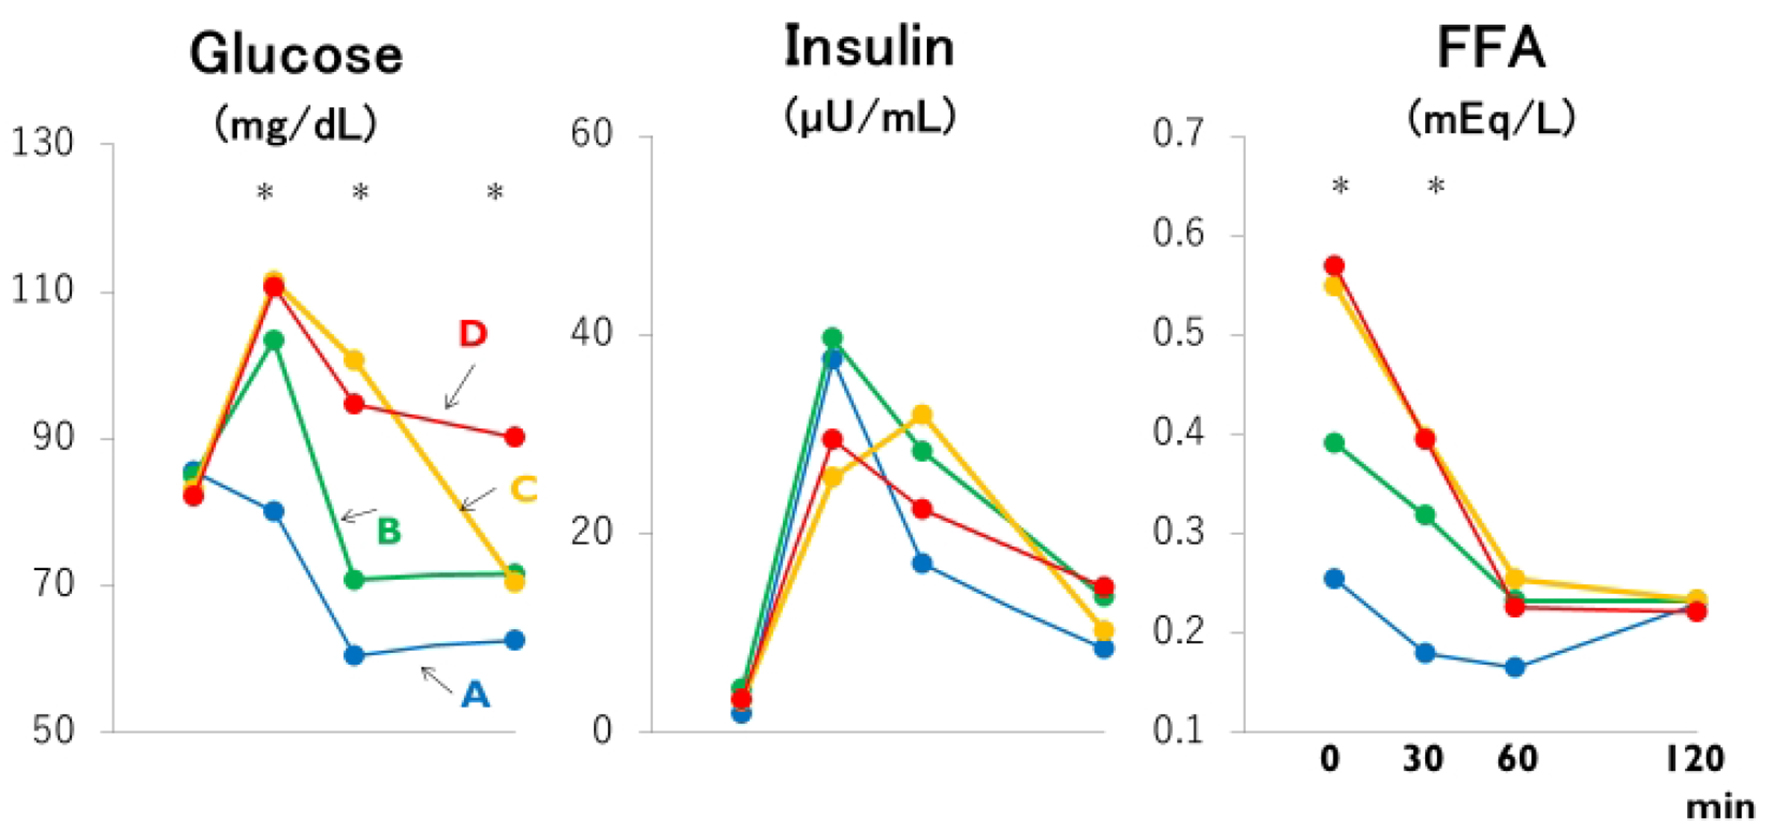 Click for large image | Figure 1. Mean plasma glucose, insulin and free fatty acid (FFA) concentrations based on the time (30, 60 and 120 min or never: groups A through D) that the plasma glucose concentration during the meal test declined below the fasting plasma glucose concentration. *: the difference is significant at P < 0.05 or less by ANOVA and Bonferroni’s multiple comparison procedure: 30-min glucose, A versus C and D; 60-min glucose and fasting FFA, A and B versus C and D; 120-min glucose, A, B and C versus D; 30-min FFA, A versus C. Group A: blue lines; B: green lines; C: yellow lines; D: red lines. |
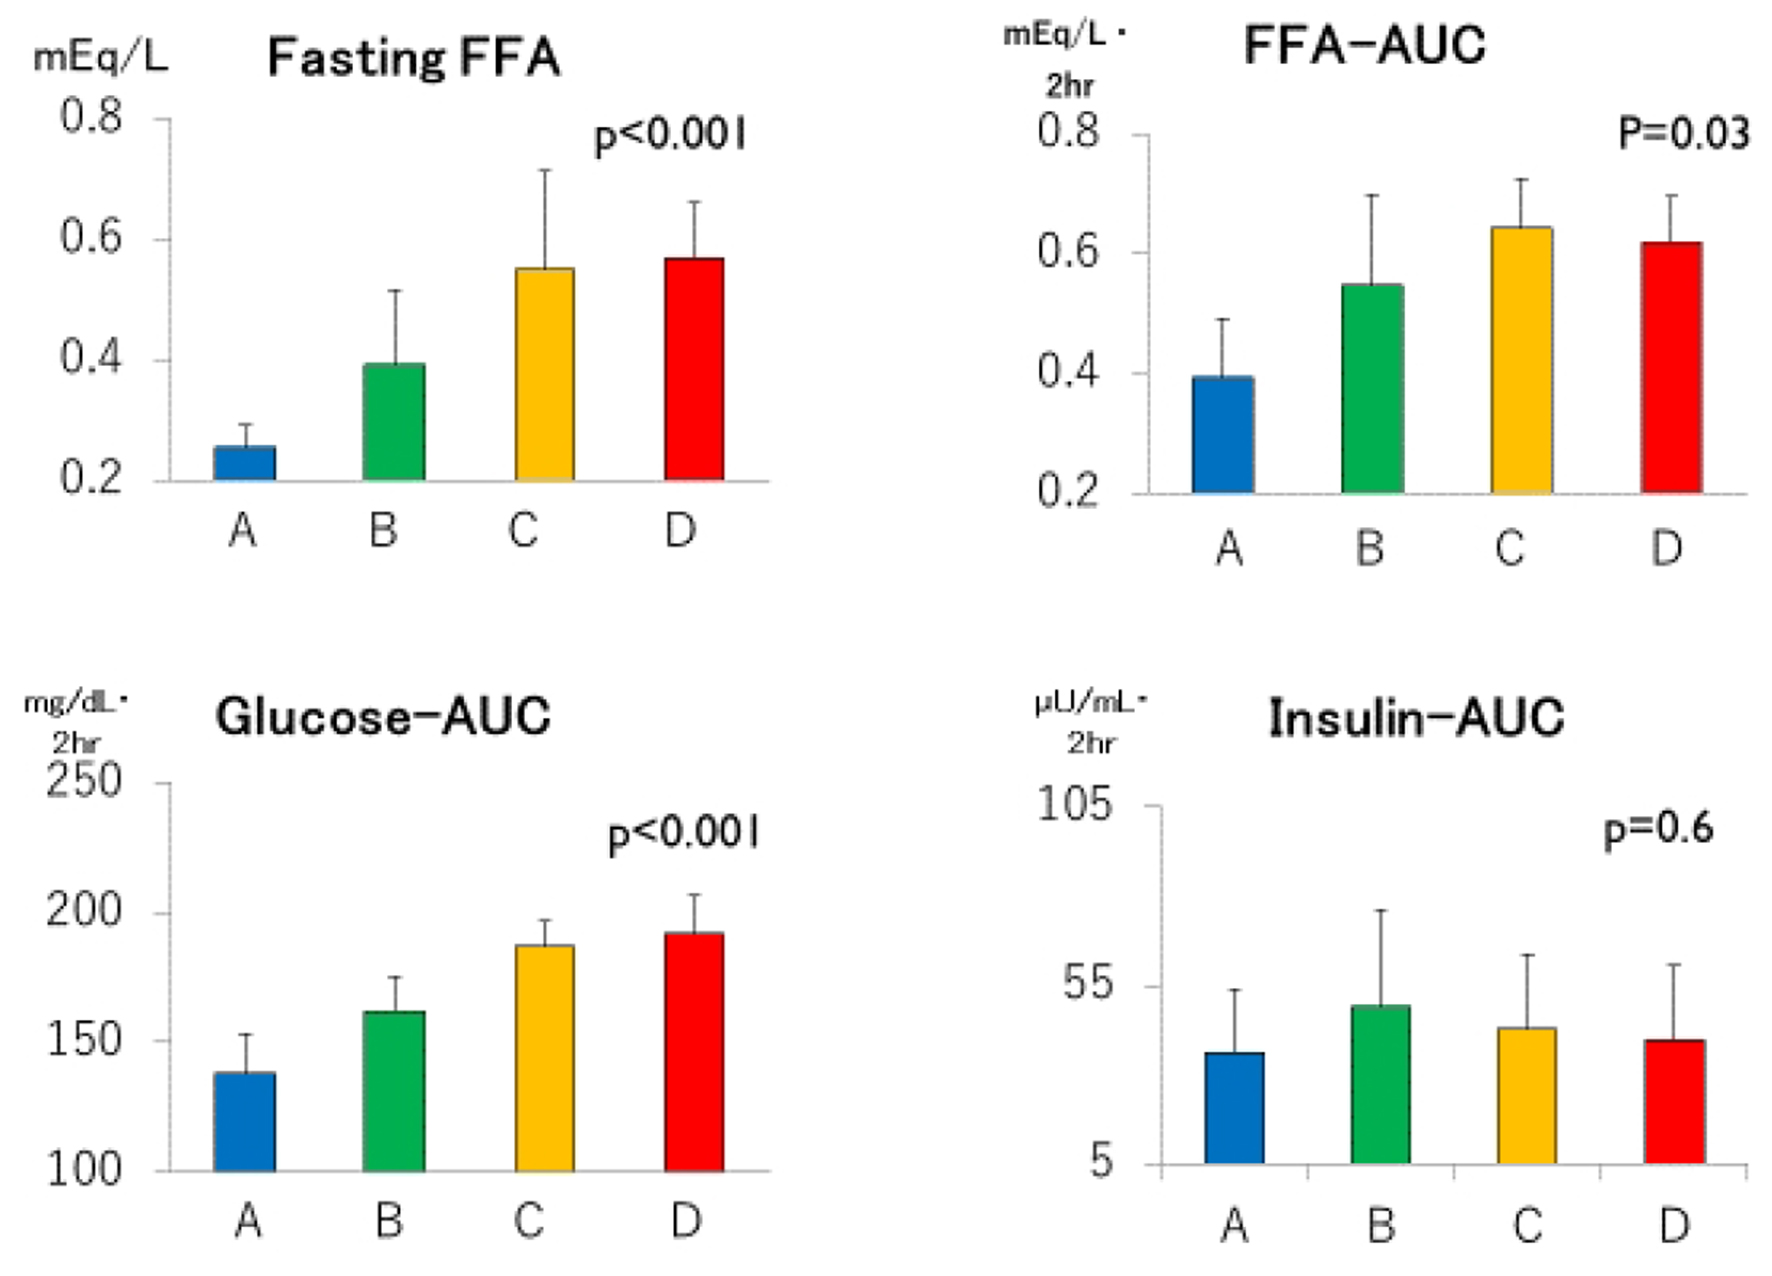 Click for large image | Figure 2. Fasting free fatty acids (FFAs), areas under the concentration curves of glucose, insulin and FFA (Glucose-AUC, Insulin-AUC and FFA-AUC, respectively) in groups A through D. Group A: blue columns; B: green columns; C: yellow columns; D: red columns. Data are expressed as mean ± SD. P values for trend derived using Jonckheeree-Terpstra test were shown. |
Click to view | Table 2. Responses of Glucose, Insulin and Free Fatty Acids to a Standardized Test Meal of the Four Study Groups Based on the Time (30, 60 and 120 Min or Never) That the Plasma Glucose (PG) Concentration During the OGTT Declined Below the Fasting PG Concentration |
Despite clearly separated glucose and FFA concentration curves after meal ingestion (Fig. 1 and Table 2), post-breakfast insulinemia among the four groups were similar. As summarized in Figure 2, not only fasting FFA and AUCffa but also AUCg were the lowest in group A, increased linearly from group B to C, and plateaued in group D whereas AUCi did not differ. Incremental changes in Δglucose30 (Fig. 3) from groups A through D were quite similar to those in fasting FFA and AUCffa, whereas Δinsulin30 did not differ among four groups. Although not depicted in Figure 3 because of negative values, MIR might be the highest in group A, and decreased from group B to C and D.
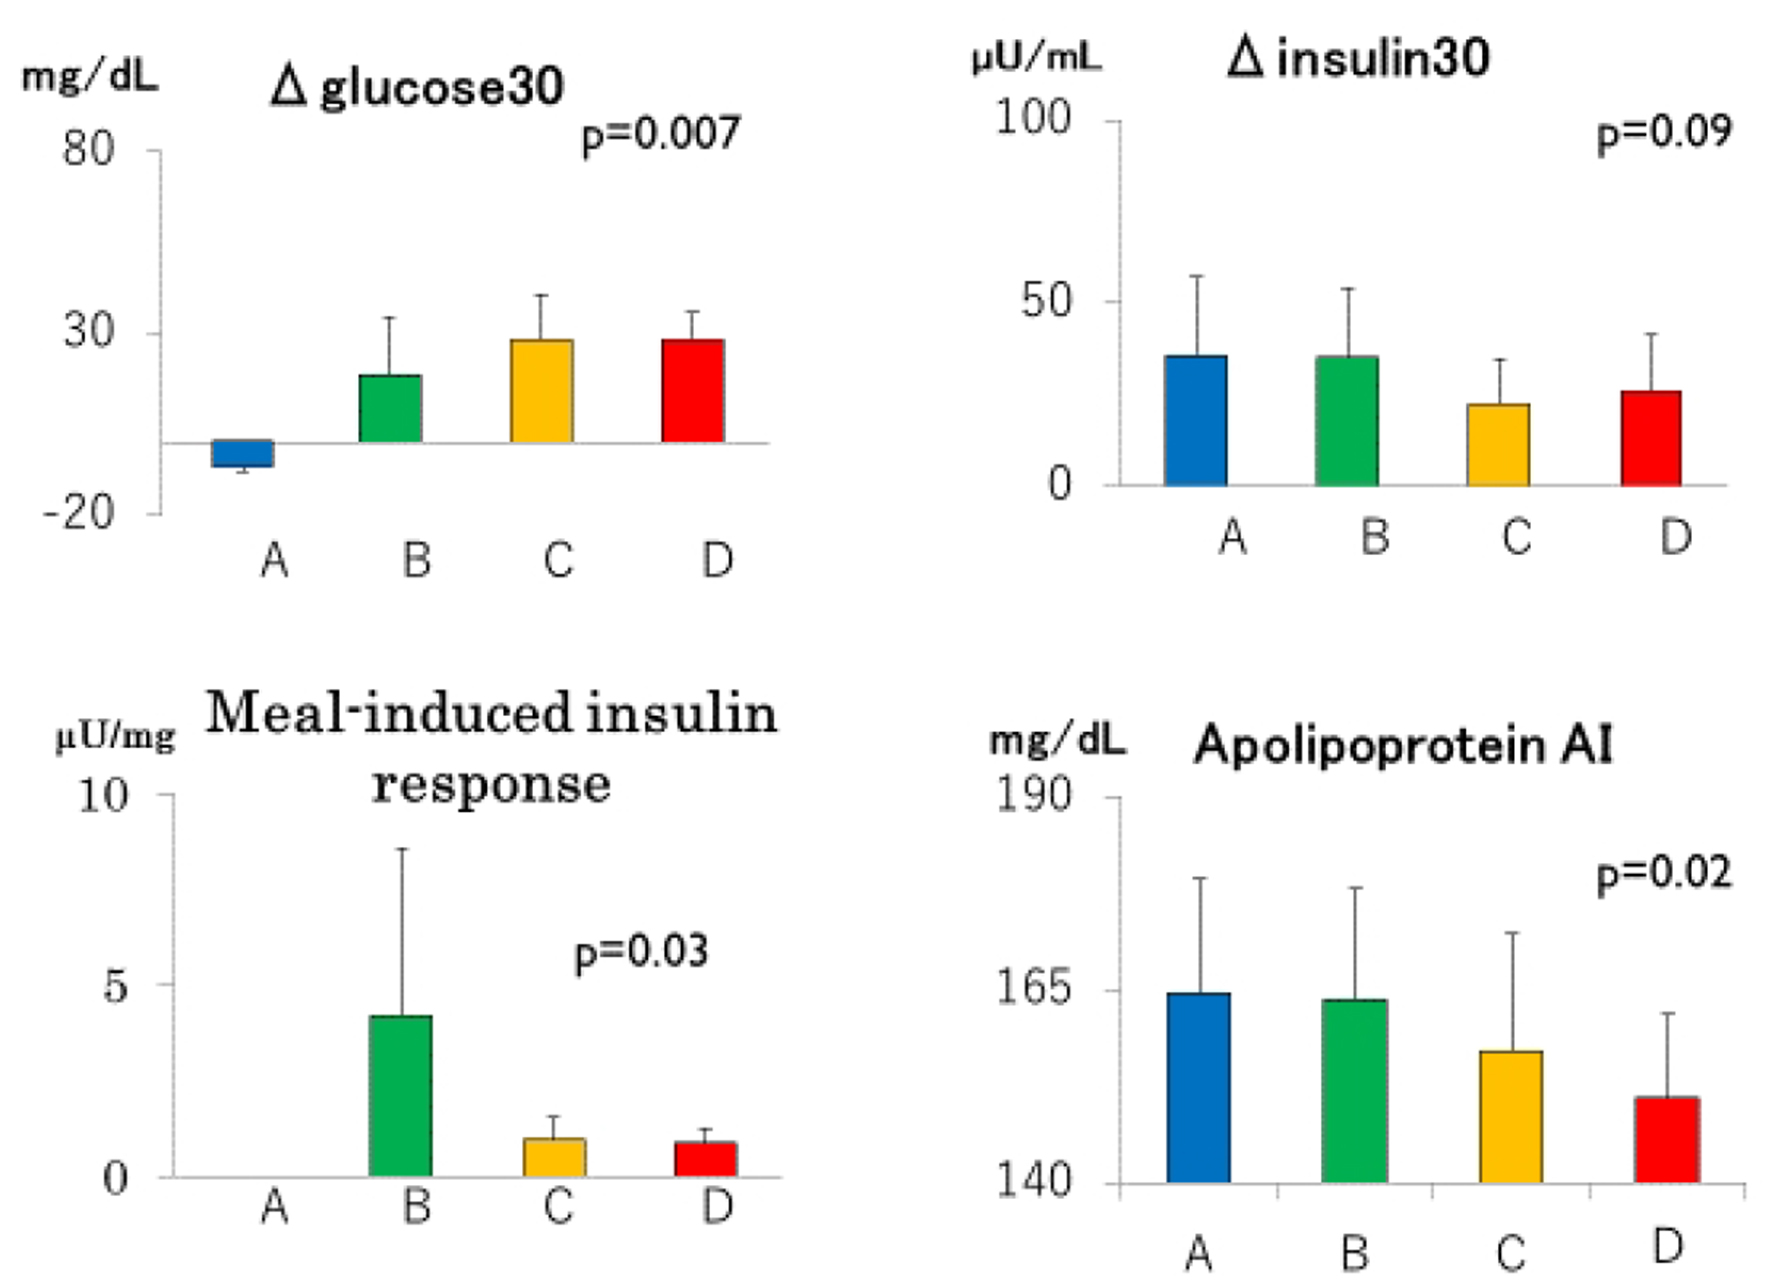 Click for large image | Figure 3. Incremental glucose (Δglucose30) and insulin (Δinsulin30) concentrations during the first 30 min of meal tests, meal-induced responses and serum apolipoprotein AI in groups A through D. Group A: blue columns; B: green columns; C: yellow columns; D: red columns. Data are expressed as mean ± SD. P values for trend derived using Jonckheeree-Terpstra test were shown. |
There was a trend towards a decrease in apoAI from group A through group D (Fig. 3 and Table 1), although serum concentrations of HDL cholesterol, triglyceride and apoB did not differ (Table 1).
| Discussion | ▴Top |
The main finding of the present study is that even in healthy, normal weight Japanese women in early adult life, progressive increases in fasting FFA and AUCffa were associated not only with progressive increases in muscle insulin resistance but also with progressives decreases in MIR. These associations were not related to general and central adiposity (FMI and trunk/leg fat ratio, respectively), birth weight, serum concentrations of adiponectin and hsCRP, family history of diabetes and the presence of endurance training. It is noteworthy that these findings were observed in a young, normal weight population in which confounding factors are so scarce [8, 18, 19].
Although FFA is well known to be a key factor in the development of insulin resistance in obese subjects [10], there are limited data in non-obese humans on the association between normal variations in FFA levels and pancreatic β-cell function. Elevated fasting FFA was associated with deterioration of acute insulin response determined using intravenous GTT in Pima Indians with IGT but not NGT [24]. In the San Antonio Metabolism study, the progressive decline in insulin secretion in individuals with NGT is associated with a progressive increase in fasting FFA and Adipo-IR [25]. Because fasting FFA represents only a short period of time during each day, other time points, such as postprandial FFA, may be more relevant. In the present study, normal variations in postprandial FFA assessed by AUCffa as well as fasting FFA levels were associated with differences in insulin secretion and insulin resistance in young healthy non-obese women with normal glucose tolerance. The current results may be consistent with prospective studies that showed a significant association between the fasting plasma FFA concentration or Adipo-IR and incidence of type 2 diabetes [25, 26]. Failure to detect statistical significance in Adipo-IR may be due to small sample size in the present study.
An increase in AUCg from groups A through D in the presence of comparable AUCi may suggest increased muscle insulin resistance from groups A through D. This may be in line with the previous observations in the general population [6, 7] that those whose post-load PG returned to FPG more slowly had a lower glucose-induced insulin secretion and increased muscle insulin resistance as compared with those whose postload PG returned to FPG more quickly.
People with NGT whose postload PG returned to FPG more slowly had greater BMI, waist circumference, serum triglycerides, FPG and serum insulin, and lower HDL cholesterol compared with people whose postload PG returned to baseline more quickly [6]. Although young normal weight Japanese women did not have anthropometric and metabolic characteristics of insulin resistance, they had decreased apoAI, a major apolipoprotein of HDL, which has been shown to increase glucose-stimulated insulin secretion and insulin-independent peripheral tissue glucose uptake, leading to increased heart and skeletal muscle glucose disposal [27].
An increase in AUCg during a standardized meal test was not related to serum concentrations of adiponectin, leptin and hsCRP, birth weight, the percentage of athletes and that of women with positive family history of diabetes.
This study has several strengths, including a homogeneous study population with scarce confounding factors, and accurate and reliable measures of body composition by dual energy X-ray absorptiometry (DXA). The main limitation of our study is small sample size. DXA does not allow separate quantification of visceral fat and subcutaneous fat in the trunk. However, the association of trunk fat with HOMA-insulin resistance was comparable to that of visceral adipose tissue accumulation by computed tomography [28]. The cross-sectional design of the present study complicates the drawing of causal inferences, and a single measurement of biochemical variables may be susceptible to short-term variation, which would bias the results toward the null. We used several surrogates in the present study, which may be less accurate.
Conclusions
Young women whose PBG returned to FPG more slowly had higher fasting and post-breakfast FFA, greater muscle insulin resistance and lower MIR compared with young women whose PBG returned to baseline more quickly. These associations were not related to general and abdominal adiposity, adiponectin and inflammation.
Acknowledgments
We are indebted to all the participants for their dedicated and conscientious collaboration.
Conflict of Interest
We declare that we have no competing interests.
Author contributions
MK, SM, KK, AT and MK have made substantial contributions to acquisition, analysis and interpretation of data. KF has been involved in drafting the manuscript. TK has been involved in revising it critically for important intellectual content; have given final approval of the version to be published; and agree to be accountable for all aspects of the work in ensuring that questions related to the accuracy or integrity of any part of the work are appropriately investigated and resolved.
Data Availability
The Ethics Committees of the University does not allow us to open data except for a manuscript.
Abbreviations
Adipo-IR: adipose insulin resistance; apoAI and apoB: apolipoprotein AI and B-100, respectively; AUC: area under the concentration curve; CV: coefficient of variation; Δglucose30 and Δinsulin30: the increment in glucose and insulin during the first 30 min of the meal test, respectively; FFA: free fatty acid; FMI: fat mass index; FPG: fasting plasma glucose; hsCRP: high-sensitivity C-reactive protein; HOMA-IR: homeostasis model assessment of insulin resistance; IGT: impaired glucose tolerance; IFG: impaired fasting glucose; MIR: meal-induced insulin response; NGT: normal glucose tolerance; PBG: post-breakfast glucose; PG: plasma glucose
| References | ▴Top |
- Gerstein HC, Santaguida P, Raina P, Morrison KM, Balion C, Hunt D, Yazdi H, et al. Annual incidence and relative risk of diabetes in people with various categories of dysglycemia: a systematic overview and meta-analysis of prospective studies. Diabetes Res Clin Pract. 2007;78(3):305-312.
doi pubmed - Shaw JE, Zimmet PZ, de Courten M, Dowse GK, Chitson P, Gareeboo H, Hemraj F, et al. Impaired fasting glucose or impaired glucose tolerance. What best predicts future diabetes in Mauritius? Diabetes Care. 1999;22(3):399-402.
doi pubmed - Gabir MM, Hanson RL, Dabelea D, Imperatore G, Roumain J, Bennett PH, Knowler WC. The 1997 American Diabetes Association and 1999 World Health Organization criteria for hyperglycemia in the diagnosis and prediction of diabetes. Diabetes Care. 2000;23(8):1108-1112.
doi pubmed - Unwin N, Shaw J, Zimmet P, Alberti KG. Impaired glucose tolerance and impaired fasting glycaemia: the current status on definition and intervention. Diabet Med. 2002;19(9):708-723.
doi pubmed - Eschwege E, Charles MA, Simon D, Thibult N, Balkau B, Paris Prospective S. Reproducibility of the diagnosis of diabetes over a 30-month follow-up: the Paris Prospective Study. Diabetes Care. 2001;24(11):1941-1944.
doi pubmed - Abdul-Ghani MA, Williams K, DeFronzo R, Stern M. Risk of progression to type 2 diabetes based on relationship between postload plasma glucose and fasting plasma glucose. Diabetes Care. 2006;29(7):1613-1618.
doi pubmed - Abdul-Ghani MA, Lyssenko V, Tuomi T, Defronzo RA, Groop L. The shape of plasma glucose concentration curve during OGTT predicts future risk of type 2 diabetes. Diabetes Metab Res Rev. 2010;26(4):280-286.
doi pubmed - Tsuboi A, Takeuchi M, Kitaoka K, Minato S, Kurata M, Kazumi T, Fukuo K. Post-prandial plasma glucose less than or equal to 70 mg/dl is not uncommon in young Japanese women. J Clin Med Res. 2017;9(8):680-686.
doi pubmed - Abdul-Ghani MA, DeFronzo RA. Pathophysiology of prediabetes. Curr Diab Rep. 2009;9(3):193-199.
doi pubmed - Boden G. Obesity, insulin resistance and free fatty acids. Curr Opin Endocrinol Diabetes Obes. 2011;18(2):139-143.
doi pubmed - Nolan CJ, Prentki M. The islet beta-cell: fuel responsive and vulnerable. Trends Endocrinol Metab. 2008;19(8):285-291.
doi pubmed - Jensen MD, Haymond MW, Rizza RA, Cryer PE, Miles JM. Influence of body fat distribution on free fatty acid metabolism in obesity. J Clin Invest. 1989;83(4):1168-1173.
doi pubmed - Boden G, Chen X, Rosner J, Barton M. Effects of a 48-h fat infusion on insulin secretion and glucose utilization. Diabetes. 1995;44(10):1239-1242.
doi pubmed - Carpentier A, Mittelman SD, Lamarche B, Bergman RN, Giacca A, Lewis GF. Acute enhancement of insulin secretion by FFA in humans is lost with prolonged FFA elevation. Am J Physiol. 1999;276(6 Pt 1):E1055-1066.
pubmed - Jensen CB, Storgaard H, Holst JJ, Dela F, Madsbad S, Vaag AA. Insulin secretion and cellular glucose metabolism after prolonged low-grade intralipid infusion in young men. J Clin Endocrinol Metab. 2003;88(6):2775-2783.
doi pubmed - Storgaard H, Jensen CB, Vaag AA, Volund A, Madsbad S. Insulin secretion after short- and long-term low-grade free fatty acid infusion in men with increased risk of developing type 2 diabetes. Metabolism. 2003;52(7):885-894.
doi - Al Salmi I, Hoy WE, Kondalsamy-Chennakesavan S, Wang Z, Gobe GC, Barr EL, Shaw JE. Disorders of glucose regulation in adults and birth weight: results from the Australian Diabetes, Obesity and Lifestyle (AUSDIAB) Study. Diabetes Care. 2008;31(1):159-164.
doi pubmed - Kitaoka K, Takeuchi M, Tsuboi A, Minato S, Kurata M, Tanaka S, Kazumi T, et al. Increased adipose and muscle insulin sensitivity without changes in serum adiponectin in young female collegiate athletes. Metab Syndr Relat Disord. 2017;15(5):246-251.
doi pubmed - Tanaka S, Wu B, Honda M, Suzuki K, Yoshino G, Fukuo K, Kazumi T. Associations of lower-body fat mass with favorable profile of lipoproteins and adipokines in healthy, slim women in early adulthood. J Atheroscler Thromb. 2011;18(5):365-372.
doi pubmed - Matthews DR, Hosker JP, Rudenski AS, Naylor BA, Treacher DF, Turner RC. Homeostasis model assessment: insulin resistance and beta-cell function from fasting plasma glucose and insulin concentrations in man. Diabetologia. 1985;28(7):412-419.
doi pubmed - Gastaldelli A, Gaggini M, DeFronzo RA. Role of adipose tissue insulin resistance in the natural history of type 2 diabetes: results from the San Antonio metabolism study. Diabetes. 2017;66(4):815-822.
doi pubmed - Yoshino G, Tominaga M, Hirano T, Shiba T, Kashiwagi A, Tanaka A, Tada N. The test meal A: a pilot model for the international standard of test meal for an assessment of both postprandial hyperglycemia and hyperlipidemia. J Japan Diab Soc. 2006;49:361-371 (in Japanese).
- Lim U, Turner SD, Franke AA, Cooney RV, Wilkens LR, Ernst T, Albright CL, et al. Predicting total, abdominal, visceral and hepatic adiposity with circulating biomarkers in Caucasian and Japanese American women. PLoS One. 2012;7(8):e43502.
doi pubmed - Stefan N, Stumvoll M, Bogardus C, Tataranni PA. Elevated plasma nonesterified fatty acids are associated with deterioration of acute insulin response in IGT but not NGT. Am J Physiol Endocrinol Metab. 2003;284(6):E1156-1161.
doi pubmed - Salgin B, Ong KK, Thankamony A, Emmett P, Wareham NJ, Dunger DB. Higher fasting plasma free fatty acid levels are associated with lower insulin secretion in children and adults and a higher incidence of type 2 diabetes. J Clin Endocrinol Metab. 2012;97(9):3302-3309.
doi pubmed - Mahendran Y, Cederberg H, Vangipurapu J, Kangas AJ, Soininen P, Kuusisto J, Uusitupa M, et al. Glycerol and fatty acids in serum predict the development of hyperglycemia and type 2 diabetes in Finnish men. Diabetes Care. 2013;36(11):3732-3738.
doi pubmed - Domingo-Espin J, Lindahl M, Nilsson-Wolanin O, Cushman SW, Stenkula KG, Lagerstedt JO. Dual actions of apolipoprotein A-I on glucose-stimulated insulin secretion and insulin-independent peripheral tissue glucose uptake lead to increased heart and skeletal muscle glucose disposal. Diabetes. 2016;65(7):1838-1848.
doi pubmed - Muller MJ, Lagerpusch M, Enderle J, Schautz B, Heller M, Bosy-Westphal A. Beyond the body mass index: tracking body composition in the pathogenesis of obesity and the metabolic syndrome. Obes Rev. 2012;13(Suppl 2):6-13.
doi pubmed
This article is distributed under the terms of the Creative Commons Attribution Non-Commercial 4.0 International License, which permits unrestricted non-commercial use, distribution, and reproduction in any medium, provided the original work is properly cited.
Journal of Clinical Medicine Research is published by Elmer Press Inc.