

| Journal of Clinical Medicine Research, ISSN 1918-3003 print, 1918-3011 online, Open Access |
| Article copyright, the authors; Journal compilation copyright, J Clin Med Res and Elmer Press Inc |
| Journal website http://www.jocmr.org |
Original Article
Volume 10, Number 7, July 2018, pages 582-587
Critical Event Intervals in Determining Candidacy for Intravenous Thrombolysis in Acute Stroke
John S. Garretta, d, Steven Sonnamakera, Yahya Daoudb, Hao Wanga, Dion Graybealc
aDepartment of Emergency Medicine, Baylor University Medical Center, Dallas, TX, USA
bDepartment of Quantitative Science and Biostatistics, Baylor Scott and White Healthcare System, Dallas, TX, USA
cDepartment of Neurology, Baylor University Medical Center, Dallas, TX, USA
dCorresponding Author: John S. Garrett, Department of Emergency Medicine, Baylor University Medical Center, 3500 Gaston Avenue, Dallas, TX 75230, USA
Manuscript submitted March 30, 2018, accepted April 10, 2018
Short title: Critical Event Intervals for IV Thrombolytics
doi: https://doi.org/10.14740/jocmr3425w
| Abstract | ▴Top |
Background: The aim of the study was to determine the optimal set point for the critical event benchmarks described in stroke guidelines and validate the ability of these goals to predict successful administration of intravenous thrombolysis within 60 min of hospital arrival.
Methods: This was a retrospective cohort analysis of patients with acute ischemic stroke who received intravenous thrombolysis following presentation to the emergency department. The national benchmarks for time intervals associated with the completion of critical events required to determine candidacy for thrombolysis were evaluated for the ability to predict successful administration of thrombolysis within 60 min of hospital arrival. Optimal time interval cut points were then estimated using regression and receiver-operator characteristic curve analysis and compared to guidelines.
Results: Of the 523 patients included in the analysis, 229 (43.8%) received intravenous thrombolysis within 60 min of hospital arrival. Of the patients who met the critical event interval goals described in guidelines, only 51.6% received thrombolysis within 60 min. The optimized cut points suggested by the regression analysis aligned with the guideline benchmarks with the only substantial difference being a shortened goal of arrival to neuroimaging start time of 19 min. This difference did not impact the overall predictive value.
Conclusion: The critical event benchmarks proposed in this study by logistic regression closely correlate with the critical event benchmarks described in the AHA/ASA acute stroke guidelines.
Keywords: Ischemic stroke; tPA; Thrombolytic(s); Time interval; Turn-around time
| Introduction | ▴Top |
Current guidelines from the American Heart Association and American Stroke Association (AHA/ASA) recommend that the interval from arrival to hospital to initiation of thrombolytic therapy be ≤ 60 min among individuals experiencing acute ischemic stroke [1]. Eligibility for intravenous thrombolysis (tPA) is based upon rapid physician evaluation, completion and interpretation of cross-sectional imaging, receipt and processing of laboratory testing, risk benefit discussions with patients and their surrogates, and drug preparation. As each of these critical events must occur before intravenous tPA can be safely administered, national guidelines suggest goal time intervals in which each critical event must occur [1, 2]. These goal time intervals are based upon consensus expert opinion alone [3, 4].
The primary aim of this study was to validate the critical event benchmarks described in the AHA/ASA stroke guidelines and determine the ability of these goals to predict successful administration of intravenous tPA within 60 min of hospital arrival. The secondary aim was to determine optimum critical event benchmarks to predict successful administration of intravenous tPA within 60 min of hospital arrival.
| Materials and Methods | ▴Top |
This was a retrospective analysis of patients presenting to the emergency department (ED) of a comprehensive stroke center with acute ischemic stroke who received intravenous tPA over a 5-year period from 2010 to 2015. The ED provided care for a total of 549,945 patients during the duration of the study. During this time, 5,193 patients were admitted to the hospital with an acute ischemic stroke of whom 546 received tPA. Patients presenting to the ED who received intravenous tPA while in the ED for the treatment of acute ischemic stroke were eligible for enrollment. Patients must have been ≥ 18 years of age and met the current protocol guidelines for receiving intravenous tPA. All data were abstracted from the medical record and maintained in an ongoing registry.
The outcome variable in this analysis is hospital arrival to intravenous tPA administration. Hospital arrival is defined as the first time stamp available in the medical record; intravenous tPA administration time was defined as the time when intravenous tPA bolus was started. Arrival to tPA was analyzed as a dichotomous variable and defined as acceptable in patients with arrival to tPA ≤ 60 min. The critical event intervals analyzed were based upon the workflow described in Figure 1: arrival to physician evaluation, arrival to CT acquisition, arrival to CT completion (scan complete with available images with formal radiologist interpretation pending), arrival to radiologist CT interpretation, arrival to complete blood count lab result, arrival to neurology consult time, arrival to tPA ordered, and tPA preparation time. All variables were initially collected as continuous and reported in minutes. Patient demographics and mortality were also available for analysis.
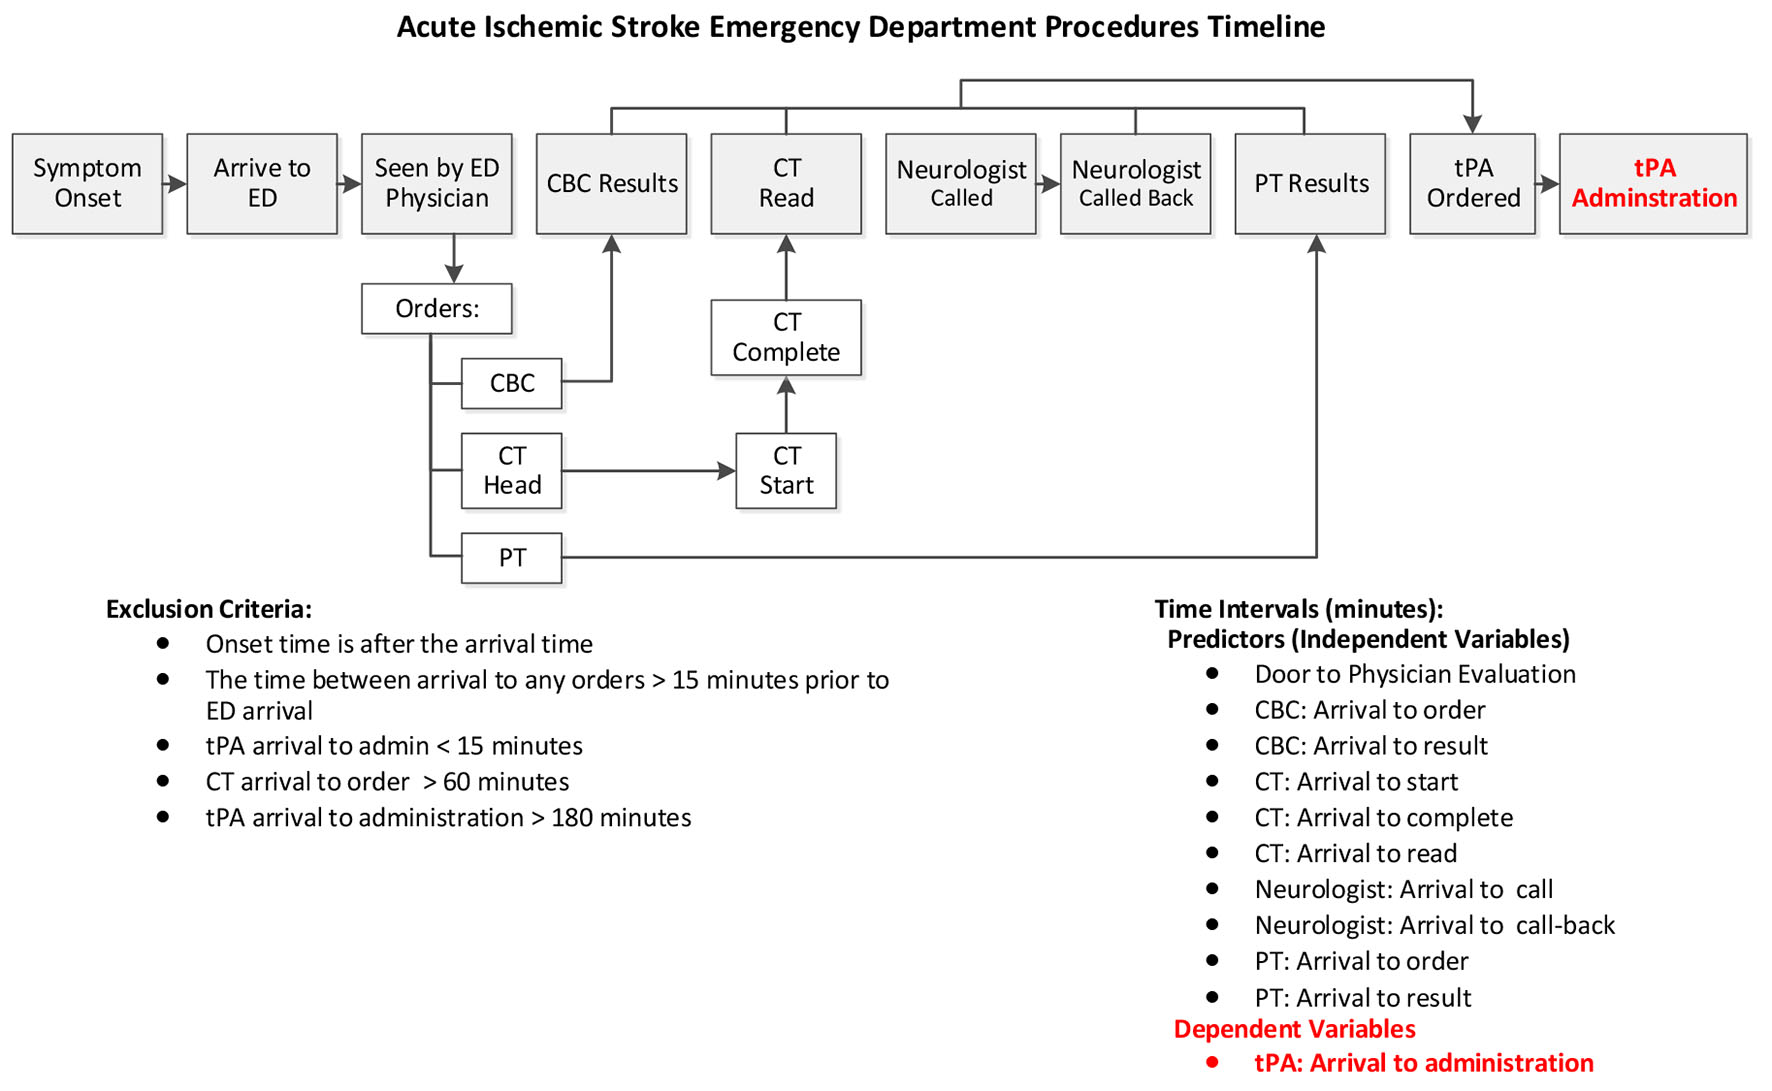 Click for large image | Figure 1. Description of critical event/time frames in the evaluation of candidacy for intravenous thrombolysis. |
Patients were excluded from analysis if the stroke onset time was after arrival to the ED, if tPA was administered within 15 min of arrival, and CT arrival to order was greater than 60 min as these represented scenarios where the stroke occurred while the patient was in the ED or the patient arrived to the ED with the evaluation for tPA already partially complete.
During the course of data collection, the time stamp data used to determine CT start time transitioned from CT start time to CT completion time. Complete head CT’s time interval data were available for 359 patients which allowed us to determine the time required to complete the CT of head and link these two variables. We then imputed the missing values for the three CT scan times: arrival to start, arrival to completion and arrival to interpretation by radiologist with the predicative values of the following three models, respectively: 1) Predicting arrival to start using: ED arrival time, arrival month, arrival day of the week and arrival to ED physician seen. 2) Predicting arrival to read using: ED arrival time, arrival month, arrival day of the week, arrival to ED physician seen and imputed arrival to start. 3) Predicting arrival to interpretation by radiologist using: ED arrival time, arrival month, arrival day of the week, arrival to ED physician seen and imputed arrival to completion.
The analytic dataset included the imputed data of 523 patients.
Statistical analysis
System time intervals were initially analyzed with descriptive statistics such as means, medians, and standard deviations (SDs). To assess associations between time intervals and the outcome variable, logistic regression, Fisher exact test and Chi-square tests were used when appropriate [5]. To derive estimated timing benchmarks, outcome variable, arrival to tPA (≤ 60 or > 60 min) were assessed against the independent variables using logistic regression, then utilize the receiver-operating characteristic curve to estimate the optimal cut point which optimized the sensitivity and specificity [5]. All data in this analysis were abstracted from patient records and entered into Microsoft Excel (Redmond, WA). All statistical analyses were conducted with JMP version 13 (SAS® Institute Inc).
The study was approved by the institutional review board for ethical standards on human experimentation with a waiver for informed consent. The data that support the findings of this study are available from the corresponding author upon reasonable request.
| Results | ▴Top |
There were 546 patients who arrived to the ED and received intravenous tPA of whom 23 were excluded. Of these 23 patients excluded from analysis, 16 patients were excluded as symptoms of acute stroke occurred after arrival in the ED, four patients had CT done prior to arrival in the ED, and three patient had lab work completed prior to arrival in the ED.
Of the 523 patients included in the analysis, 229 (43.8%) received IV tPA within 60 min of arrival to the ED. The mean arrival to IV tPA was 71 min, though this decreased each year in response to ongoing process improvement efforts. Patient demographics are summarized in Table 1. There were no significant associations between the tPA administration within 60 min and patient’s age, gender, ethnicity and death. Across all critical time intervals, there was a significant increase in time associated each step in the process when comparing the cohort who successfully received tPA within 60 min to those that did not (Table 2).
 Click to view | Table 1. Demographics |
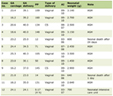
Click to view | Table 2. System Events Time Intervals Descriptive Statistics |
The critical event intervals most predictive of successfully administering tPA within 60 min of arrival were tPA order within 45 min with 92.4% of patients within this group meeting goal. Also predictive of successful administration of tPA within 60 min was neurology consult within 15 min with 71.8% of patients meeting goal. Table 3 describes the logistic regression results for each of the critical time intervals.
Click to view | Table 3. Regression Analysis to Identify Ideal Benchmarks for Critical Event |
Critical event intervals were dichotomized by receiving tPA within 60 min of arrival and are presented in Figure 2. Included in the figure are the guideline benchmarks for the critical event intervals as well as those estimated by logistic regression analysis. Of the patients who met the critical event interval goals described in the national guidelines only 51.6% received intravenous tPA within 60 min. The optimized cut points suggested by the regression analysis aligned with the guideline benchmarks with the only substantial difference being a shortened goal of arrival to neuroimaging start time of 19 min versus the 25 min suggested by guidelines. The predictive performance of the optimized cut points was then compared to those described by guidelines. These optimized benchmarks aligned with consensus opinion national guidelines bench mark and did not impact the predictive value of meeting the goal of door to tPA administration within 60 min.
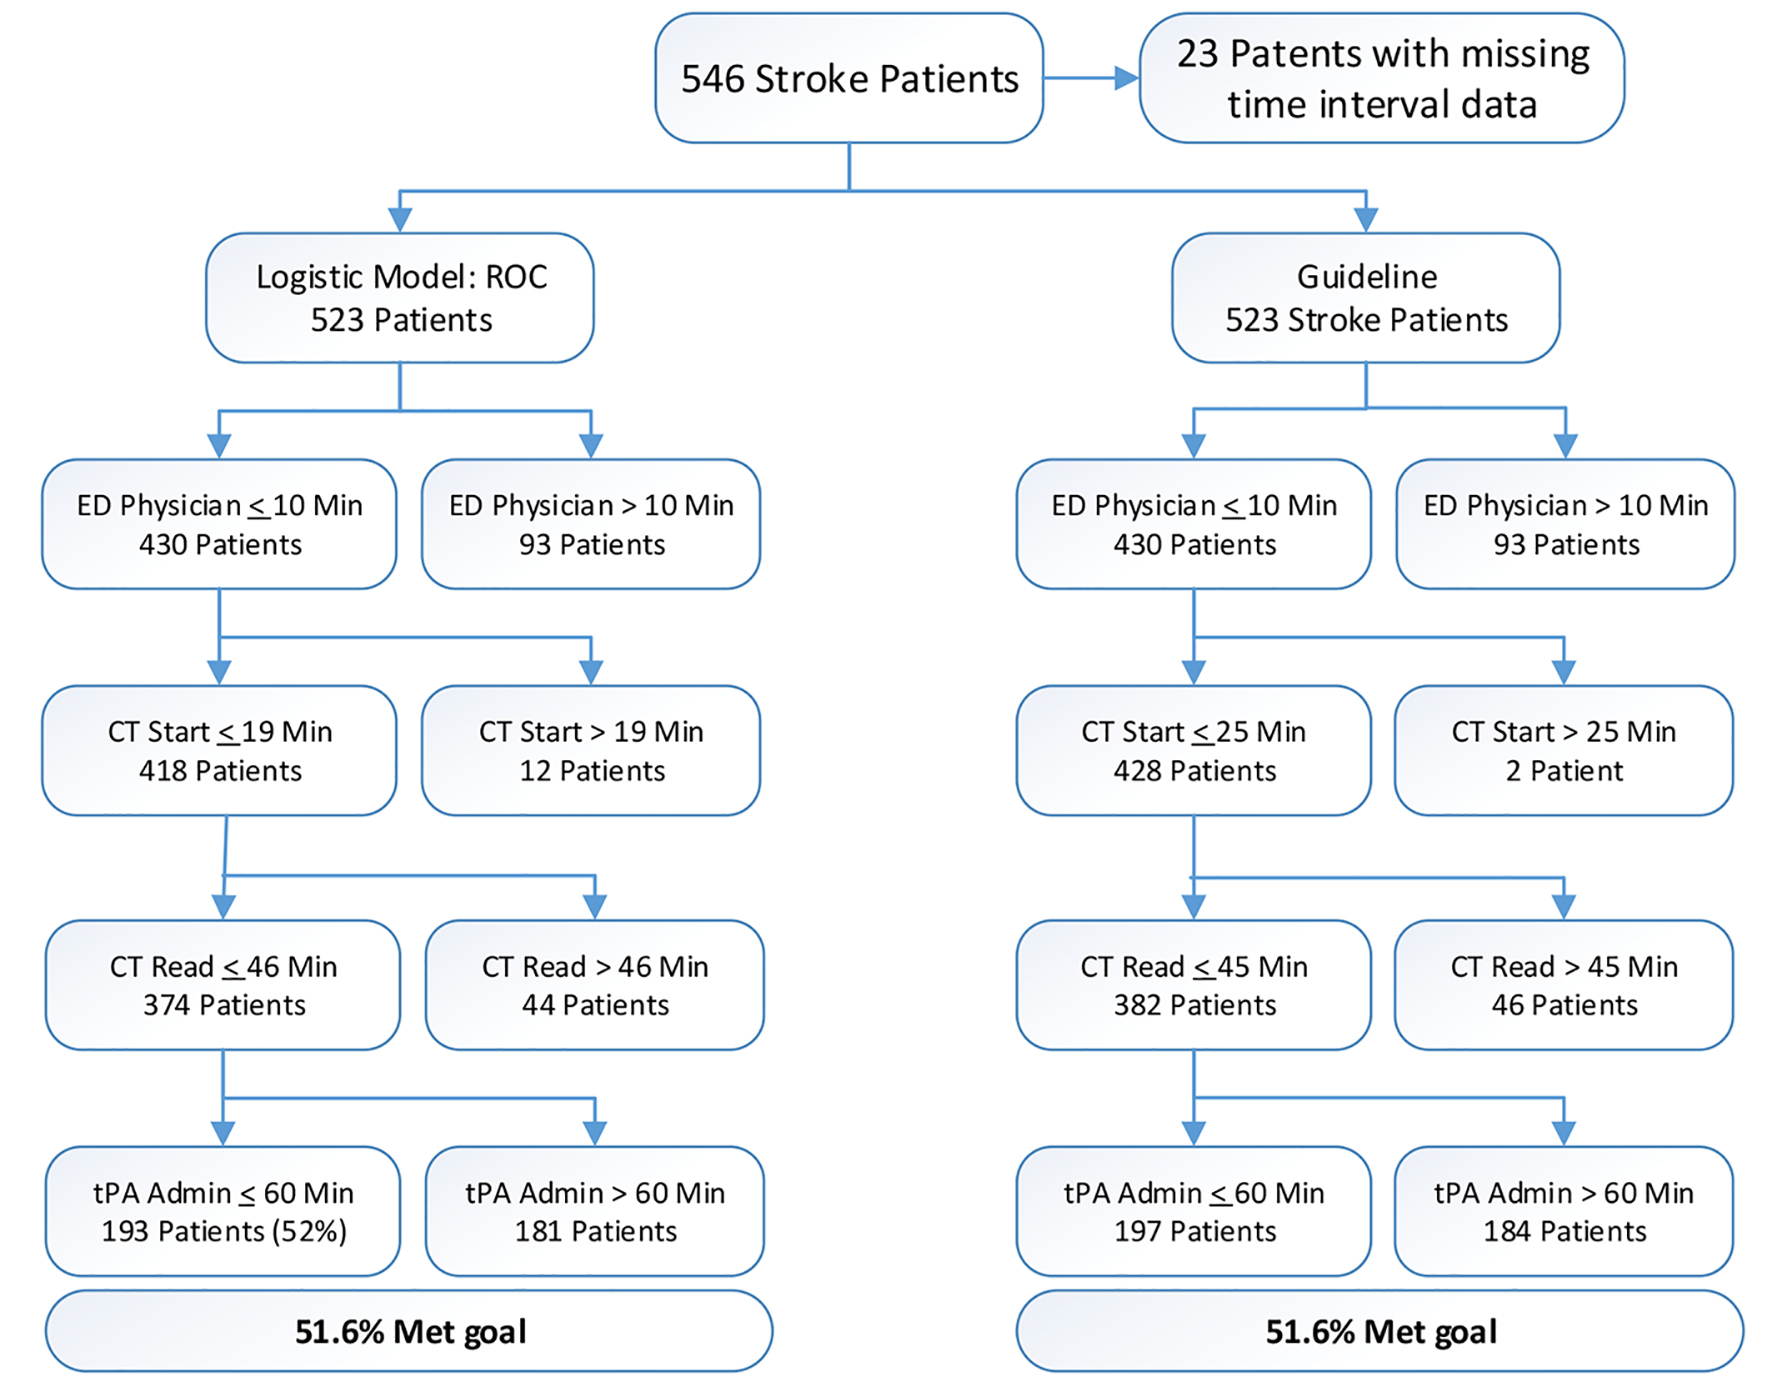 Click for large image | Figure 2. Performance of guideline suggested critical event intervals versus logistic regression model and idealized time intervals. |
| Discussion | ▴Top |
The American Heart Association recommends that the interval from arrival to hospital to initiation to thrombolytic therapy be ≤ 60 min among individuals experiencing acute ischemic stroke [1]. Several critical events must occur before intravenous tPA can be safely administered; however this is a lack of evidence to guide institution for developing goals for these time intervals [1-4]. For example, it is recommended “access to stoke expertise” (general evaluation and stabilization) within 15 min of arrival to the ED, and imaging with interpretation within 45 min of arrival [3, 4]. As a hospital attempts to improve their rapid recognition, evaluation, and treatment of acute stroke patients, these time interval goals often used a benchmarks upon which process improvement may focus.
Based on our data, we were able to establish optimal cut points for several time intervals between ED arrival and administration of intravenous tPA. These cut points represent critical time benchmarks for successful delivery of intravenous tPA in eligible patients. The benchmark time intervals in which meeting goal was most strongly correlated with tPA administration were arrival to CT interpretation, arrival to CT order, arrival to tPA order, arrival to CBC result, and arrival to physician evaluation. Other time intervals were weakly correlated with tPA administration within 60 min.
The results of this study validate the current guideline recommendations for goal time intervals concerning door to doctor evaluation and door to CT interpretation. The multivariate regression analysis demonstrated that these two benchmarks were optimally set at 10 min for arrival to physician evaluation and arrival to CT interpretation within 44 min.
This analysis found a goal benchmark of arrival to CT initiation of 25 min was not an ideal cut point to predict tPA administration within 60 min with only 45% of patients achieving this benchmark meeting the goal of rapid TPA administrations. Rather, a tighter goal of 19 min was more predictive of success, though this had a minimal overall impacting improving prediction of tPA administration within 60 min of arrival. Of note, only 51.6% of patients who met the current AHA/ASA guideline goal time intervals received tPA within 60 min.
Furthermore, it does not appear these critical event benchmarks alone are sufficient to predict successful rapid tPA administration. There is an intermediary process between successful completion of all testing required to determine candidacy for intravenous tPA and the decision to administer tPA. In this timeframe, further historical criteria are gathered, patients and families are informed of risk and benefits of intravenous tPA, and the decision is made to proceed with administration. The data demonstrate that this process may be very rapid (2 min) or prolonged (74 min) based upon individual factors. The variability in this aspect of determining candidacy for tPA limits the predictive nature of any benchmarking.
Limitations
This analysis has several limitations. This is a single center study which utilized aggressive workflows to prioritize physician evaluation, neuroimaging, and tPA administration. It is possible that a similar time interval study would not be applicable when applied to other workflows, though in general most EDs evaluate stroke in this manner. In addition, the overall impact of this limitation is minimal as each critical elements must all be completed prior to safe administration of intravenous tPA regardless of the institutional workflow.
The major limitation of this study is not all patients had each timestamp available as the database was maintained to focus quality improvement initiatives. As such, specific critical event timestamps were retired during the course of 5 years and replaced with related timestamps. In other cases some timestamps were unavailable. In these cases the multivariate analysis was undertaken using the available data. As such, it is unlikely that the missing data impacted the multivariate analysis model.
An additional limitation was that patients were enrolled into this cohort over a 5-year period during which time continual process improvement aimed to reduce the time from arrival to intravenous tPA administration. As such, overall performance in the goal metric improved over the course of the study. This served to weight the successful administration of tPA to newer workflows which sped arrival to CT start and tPA order to drug administration.
A final limitation is that we were unable to abstract a benchmark reflecting the cognitive process of determining tPA candidacy and consenting patients and families. The timestamp associated with the tPA order represents the completion of this process. As such, the order for tPA within 45 min was the most predictive benchmark time interval for successful administration of TPA within 60 min. A slightly earlier benchmark, arrival to neurology consult, was also found to be quite predictive of successful administration of tPA within 60 min. This is likely due to a similar phenomenon: the ED physician tended to reach out for neurologist expertise once the initial evaluation to determine candidacy was complete. In cases where there were delays in obtaining this information, neurology was not consulted until the information was available.
Conclusion
The critical event benchmarks proposed in this study by logistic regression closely correlate with the critical event benchmarks described in the AHA/ASA acute stroke guidelines. Individuals who meet these critical event benchmarks are more likely to received TPA within 60 min of hospital arrival. These event benchmarks may be used to guide hospital process improvement efforts.
Author Contributions
Dr. Garrett: study concept, design, manuscript preparation and review. Dr. Sonnamaker: acquisition of data, manuscript preparation and review. Mr. Daoud: statistical analysis, acquisition of data, manuscript review and preparation. Dr. Wang: manuscript review, review of statistical methods and analysis. Dr. Graybeal: critical review and revision of manuscript.
Funding
The study was funded through internal departmental funds and was not industry sponsored.
Conflict of Interest
All authors report no disclosures or conflict of interest.
| References | ▴Top |
- Jauch EC, Saver JL, Adams HP, Jr., Bruno A, Connors JJ, Demaerschalk BM, Khatri P, et al. Guidelines for the early management of patients with acute ischemic stroke: a guideline for healthcare professionals from the American Heart Association/American Stroke Association. Stroke. 2013;44(3):870-947.
doi pubmed - Asimos AW, Norton HJ, Price MF, Cheek WM. Therapeutic yield and outcomes of a community teaching hospital code stroke protocol. Acad Emerg Med. 2004;11(4):361-370.
doi pubmed - National Institute of Neurological Disorders and Stroke Symposium. Improving the chain of recovery for acute stroke in your community: task force reports. Bethesda, MD: National Institutes of Health, Department of Health and Human Services; 2003.
- Marler JR, Jones PW, Emr M. Setting new directions for stroke care: proceedings of a national symposium on rapid identification and treatment of acute stroke. Bethesda, MD: National Institute of Neurological Disorders and Stroke; 1997.
- Hosmer D, Lemeshow S. Applied logistic regression. 2nd ed. New York, NY: John Wiley & Sons; 2000.
doi pubmed
This article is distributed under the terms of the Creative Commons Attribution Non-Commercial 4.0 International License, which permits unrestricted non-commercial use, distribution, and reproduction in any medium, provided the original work is properly cited.
Journal of Clinical Medicine Research is published by Elmer Press Inc.