

| Journal of Clinical Medicine Research, ISSN 1918-3003 print, 1918-3011 online, Open Access |
| Article copyright, the authors; Journal compilation copyright, J Clin Med Res and Elmer Press Inc |
| Journal website http://www.jocmr.org |
Original Article
Volume 10, Number 5, May 2018, pages 376-383
The Impact of the Underlying Risk in Control Group and Effect Measures in Non-Inferiority Trials With Time-to-Event Data: A Simulation Study
Xuanqian Xiea, b, Chenglin Yec, Nicholas Mitsakakisd, e, f
aHealth Quality Ontario, Toronto, ON, Canada
bTechnology Assessment Unit of the McGill University Health Centre, Montreal, QC, Canada
cOncology Biostatistics, Genentech, South San Francisco, CA, USA
dInstitute of Health Policy, Management and Evaluation, and Division of Biostatistics, Dalla Lana School of Public Health, University of Toronto, Canada
eBiostatistics Research Unit, University Health Network, Toronto, ON, Canada
fCorresponding Author: Nicholas Mitsakakis, Institute of Health Policy, Management and Evaluation, and Division of Biostatistics, Dalla Lana School of Public Health, University of Toronto, Canada
Manuscript submitted January 2, 2018, accepted February 19, 2018
Short title: Underlying Risk in Non-Inferiority Trials
doi: https://doi.org/10.14740/jocmr3349e
| Abstract | ▴Top |
Background: We designed a simulation study to assess how the conclusions of a non-inferiority trial (NIT) will change if the observed risk is different from the expected risk.
Methods: We simulated Weibull distribution time-to-event data with a true hazard ratio (HR) being equal or close to 1. The empirical margins and sample size of a hypothetical trial were chosen based on a systematic review. Setting the significance level at 5% for the two-sided confidence interval (CI), we examined the statistical power (i.e., the probabilities of the upper limit of the 95% CI falling within the margin) of using two measures at various underlying risk in the control group.
Results: Using the empirical margins, HRs of 1.2, 1.35 or 1.5, the statistical power is lower than 0.22 when the underlying risk in the control group is less than 10%, but the power increases along with the higher underlying risk. The predicted upper limit of the 95% CI of the difference in two Kaplan-Meier estimators (DTKME) is low when risk is low (< 20%) or high (> 80%), but reaches the highest value when risk is around 50%. When the underlying risk in the control group is lower than 10%, measures of DTKME resulted in much higher power than HR.
Conclusions: When HR is the effect measure, the probability of concluding non-inferiority will increase as the underlying risk in the control group increases. When DTKME is the effect measure, the probability of concluding non-inferiority will decrease as the underlying risk in the control increases. In this case, the probability of concluding non-inferiority is at a minimum when the control risk reaches about 50%. When the risk in the control arm is less than 10%, the conclusion of an NIT is sensitive to the choice of effect measure.
Keywords: Non-inferiority trial; Time-to-event data; Underlying risk; Hazard ratio; Simulation study
| Introduction | ▴Top |
A non-inferiority trial (NIT) is used to examine whether an experimental treatment is no worse than an active control, usually the standard treatment used in practice [1, 2]. An NIT is usually conducted when investigators expect an experimental intervention has potential advantages over the standard treatment (e.g., less invasive, easier to administer, safer or more economical) but they do not anticipate that the experimental treatment will be superior to the standard treatment in the primary outcome. Statistically, the null hypothesis in an NIT is that the difference in effect between the experimental group and the active control group is greater than or equal to a pre-specified non-inferiority margin, and the alternative hypothesis is that the difference is less than the margin [3]. When the sample size of a trial is not very large and the non-inferiority margin has been pre-specified, the upper (or lower) limit of the 95% confidence interval (CI) of the estimated treatment difference will determine the conclusion of the NIT. The underlying risk will largely affect the upper (or lower) limit of 95% CI in an NIT. Then, an interesting question arises: how would the conclusion of an NIT change if the observed risk is different from the risk assumed in the trial’s design?
It is not uncommon to see a large difference between expected risk (i.e. the estimated underlying risk when designing the trial) and observed risk (i.e. the risk observed in a trial) in the control arm of an NIT [4, 5]. One of the key reasons is that continuous improvement in patient management leads to better prognostics, while assumptions about expected risk in the active control arm are often based on historical data, which can be quite different from a concurrent comparison. For example, when selecting non-inferiority margin in TARGIT-A — a trial that compared the single dose Intrabeam® radiotherapy (experimental treatment) with the conventional whole breast external beam radiotherapy (active control) for early stage breast cancers — the authors assumed that the 5-year local recurrence rate in the active control arm was 6% [4]. However, the actual risk observed in the control arm over the 4 years of this trial was only 0.95%. A similar situation has occurred in some cardiovascular NITs, where the observed risk was much lower than the assumed risk when the trial was designed [5]. Although ideally the timing of analysis should be driven by a target number of events, it is not always feasible for trials to extend their follow-up time until the desired number of events occur. In practice, authors often interpret their results with the available data, regardless of a lower-than-expected underlying risk.
Before conducting an NIT to systematically examine an experimental treatment, researchers will examine the existing evidence (e.g., observational studies), which has often shown that the efficacy of the experimental treatment is similar to that of the active control. If the evidence shows otherwise, researchers may instead design a superiority trial. Thus, we designed a simulation study to examine how underlying risk in the control group, different effect measures, and the size of non-inferiority margins impact the conclusion of an NIT, when the true difference between the experimental intervention and the active control is small (i.e., a hazard ratio close to 1 for time-to-event data).
| Methods | ▴Top |
Overview
Here we give an overview of our simulation study. The detailed methods are presented in subsequent sections.
Let T and C represent the values of an effect measure for the efficacy of an experimental treatment and an active control treatment, respectively. M is the pre-defined non-inferiority margin. The standard null hypothesis and alternative hypotheses for non-inferiority test can be expressed as [3]
If the one-sided limit of the CI of C − T at a given significance level α is smaller than M, the null hypothesis will be rejected. Alternatively, a two-sided 100 × (1 − α)% CI can be used, in which case the upper limit will be equivalent to that of the one-sided case with significance α/2. The expression above assumes that higher values of T and C indicate better efficacy outcomes. Different effect measures (e.g. absolute difference or ratio) and outcomes (favorable or unfavorable) may be expressed differently in null and alternative hypotheses [6].
We simulated time-to-event data with true hazard ratios (HRs) of 1 (the base case), 0.95 and 1.05 (sensitivity analyses) for experimental treatment versus the active control treatment. The HR measures an undesired outcome; a higher hazard represents lower efficacy. We selected two effect measures: HR and the difference in two Kaplan-Meier estimators (DTKME) at a given follow-up time (i.e., 5 years).
Although both P value and CI can be used to conclude statistically significant results in a superiority trial, NITs commonly use the CI of the effect estimate and compare it with the non-inferiority margin to test for non-inferiority [1]. Let us set the significance level at 5% for the two-sided CI, and then the 95% upper limit of the measure was estimated. Since the true HR is 1 or close to 1 (0.95 and 1.05), the correct decision is to reject the null hypothesis (i.e., if the upper limit of the measure was within the non-inferiority margin). If the null hypothesis is not rejected, it would be a type II error. For our simulation, empirical non-inferiority margins were chosen from a systematic review of NITs [7]. Statistical power (or 1 − type II error rate) was estimated for different effect measures at various categories of underlying risk in a hypothetical control arm.
Simulation of the survival data
We assumed that the time to the event of interest (Te) followed the Weibull distribution with shape parameter (γ) and scale (λ). This distribution has probability density function [8]
The survival function is given as
The risk of having an event before or at time t is 1 − S(t), which depends on given parameters γ and λ. Also, the value of λ can be calculated at given parameters t, γ and S(t).
The hazard function is
We also made a proportional hazard assumption for hazard in experimental group (h1(t)) versus active control group (h0(t)), and the HR, denoted as φ
Then,
We see that formula (6) is in the form of Weibull hazard for the experimental group (h1(t)) with Lambda of φλ (i.e. the scale parameter) and the same shape parameter γ as that in control group (h0(t)) [8].
Using the median sample size of oncology NITs, 600 patients were generated for each hypothetical trial [9]. The patients were randomly assigned into experimental group or control group with a 1:1 ratio. Although time t does not correspond to any specific meaning of the time scale, we interpret one unit as one year in this study to help interpretation. We illustrated the simulated survival data in Figure 1. We simulated 10,000 hypothetical trials to cover the underlying risk from 0.03 to 0.95 in 5 years in active control group. We selected γ = 2 for both groups, setting hazard to increase over time. For each trial, we generated a uniform distributed underlying risk from 0.03 to 0.95 for the active control group with fixed t = 5 and γ = 2. Using the formula (3), we calculated the corresponding λCtl at given simulated underlying risk, t and γ for Weibull distribution. The plot of underlying risk versus λ can be found in Figure A1 in Appendix 1 (Supplementary 1, www.jocmr.org). For the experimental group, the λExp is equal to = φλCtl where φ is the HR of experimental group versus control group.
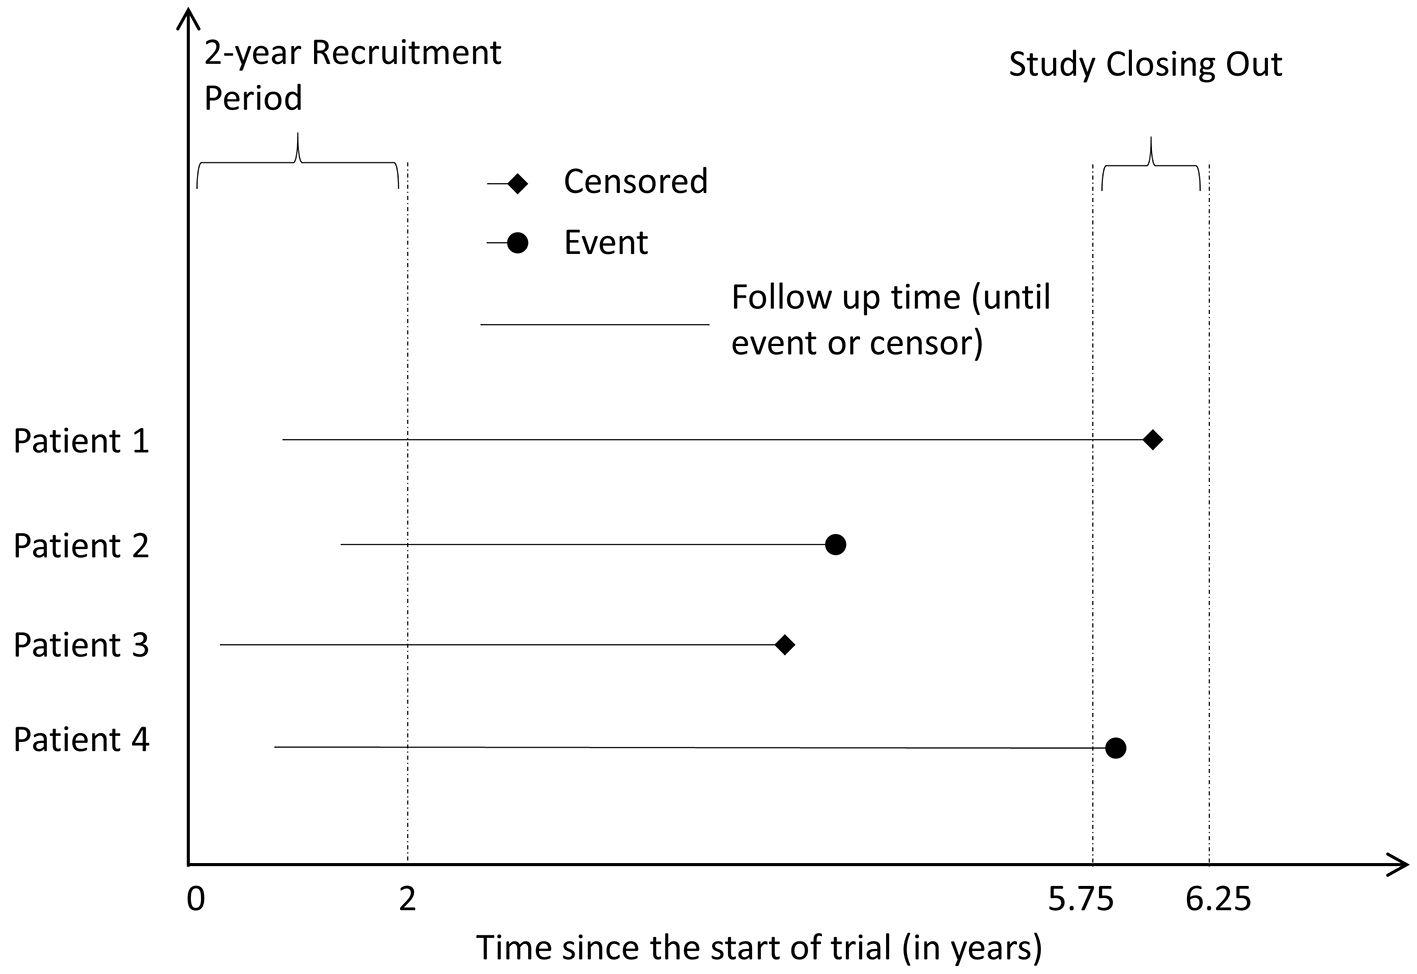 Click for large image | Figure 1. Illustrative example of the simulation. |
We assumed that there is a small constant hazard of censoring for random reasons (e.g. loss follow-up). The time to random censoring (Trc) follows exponential distribution with λ of 0.02107 for both groups, which indicated about 10% patients censored in 5 years. We also included a patient recruitment period, which follows uniform distribution (Trp), and the duration is up to 2 years. Finally we set a short period to close out the trial (Tac, the hypothetical administrative censoring time) following uniform distribution from 5.75 to 6.25 years from the start of the trial. The time to censoring (Tc) was the minimum of Trc and (Tac − Trp). The minimum of Tc and Te was used to define the follow-up time of each individual in each dataset. If Te was less than Tc, the hypothetical patient had the event of interest, i.e. event = 1 at the end of follow-up. Otherwise, the patient was censored, i.e. event = 0. Note: Except the value of λCtl and λExp, the other parameters (γ, t, and parameters for recruitment period, time to censoring, time to close the trial, etc.) were same in all 10,000 trials. The SAS code used for simulating time-to-event data can be found in Appendix 2 (Supplementary 1, www.jocmr.org).
The upper limit of 95% CI for different effect measurements
If the 95% upper limit of an effect measure (measuring an unfavorable outcome for the experimental intervention) or the 95% lower limit of the effect measure (measuring a favorable outcome) fell within the pre-defined non-inferiority margin, we concluded non-inferiority. Two effect measures were investigated: 1) HR estimate using the Cox proportional hazard model, and 2) DTKME, since this effect measurement has also been used in NIT for time-to-event data in practice [4]. The following methods were used to calculate a two-sided 95% CI for each measure for each trial.
HR
Under the formulation of the Cox model
DTKME
Assuming an ordered sequence of the observation times 0 < t1 < t2 < … < tr, the Kaplan-Meier estimator of the survival function S(t) is given by
Using these estimators, and assuming that the survival functions Sexp(t), Sctl(t), of the experimental and control group respectively, are independent, the 95% CI of DTKME at time t is given by
The likelihood to conclude non-inferiority
We calculated the probability of concluding non-inferiority, defined as the probability that the 95% upper limit fell within non-inferiority margin (i.e. the statistical power) for each effect measure in those four underlying risk group, < 10%, 10-25%, 25-75% and > 75%. We also illustrated the trend of predicted upper limits of 95% CI with measures of HR and DTKME.
It is challenging to select a proper non-inferiority margin [12], and the majority of NITs, 63% (45 out of 72), did not specify the methods used for selecting their non-inferiority margin [9]. The fixed margin approach is recommended by the United States Food and Drug Administration (FDA) and widely adopted [13]. The fixed non-inferiority margin is calculated based on the effect of the active comparator in the historical data and the required fraction of the effect of the control preserved by the experimental group [13]. The margin should be pre-specified when designing a trial, and not be changed retrospectively. The systematic review of non-inferiority trials by Soonawala et al [7] showed that the median (Q1, Q3) non-inferiority margin was 1.2 (1.2, 1.5) for measures of ratio and 10% (5%, 15%) for measures of risk differences. We selected the empirical non-inferiority margins of 1.20, 1.35, and 1.50 for HR, and 5%, 10%, and 15% for DTKME. In addition, we employed a non-inferiority margin of 2.5% for DTKME, which was used in the TARGIT-A trial [4], in our simulations. It should be noted that the margin used for one measure does not necessarily correspond to another margin used for another measure. For example, non-inferiority margin for HR of 1.2 is not equivalent to non-inferiority margins of 5% for DTKME.
Sensitivity analysis
To examine the robustness of our results, we conducted a series of sensitivity analyses by simulating data under different scenarios: 1) using a larger sample size for each hypothetical trial (n = 2,000 and 10,000); 2) using different values of shape parameter (γ = 0.5 (i.e. hazard decrease over time) and γ = 1 (i.e. constant hazard)) of the Weibull distribution for time-to-event data; and 3) keeping the administrative censoring time same as that in main analysis, and using different hazard for time to the random censoring of the exponential distribution (λ = 0 (no random censoring), λ = 0.0446 (i.e. 20% censoring at year 5), and λ = 0.1386 (i.e. 50% censoring at year 5)).
We simulated 1,000 trials with true HR of 1 in each sensitivity analysis. SAS 9.4 (SAS, Cary, USA) was used to simulate all data and conducted the analyses.
| Results | ▴Top |
Effect measurement using HR
Figure 2 shows the plot of upper limits of 95% CI of HR against follow-up time for a true HR of 1. Each dot represents one simulation and the line is the predicted line fitted by a non-parametric regression model [14]. In summary, the upper limit of 95% CI decreased sharply when the underlying risk was between 0.03 and 0.25, and then gradually decreased until the underlying risk reached 0.95. When we used the empirical non-inferiority margins, the probability of concluding non-inferiority would increase as the underlying risk in the control increased. The same pattern was observed in the plots of true HRs of 0.95 and 1.05. Using the empirical non-inferiority margins chosen (HRs of 1.2, 1.35, and 1.5), the probability of rejecting the null hypothesis when the underlying control risk was less than 10% was small: 0.067, 0.131, and 0.224, respectively. Such probability increased as the underlying risk increased. The probability of rejecting the null hypothesis for true HR of 1, 0.95 and 1.05 is summarized in Table 1.
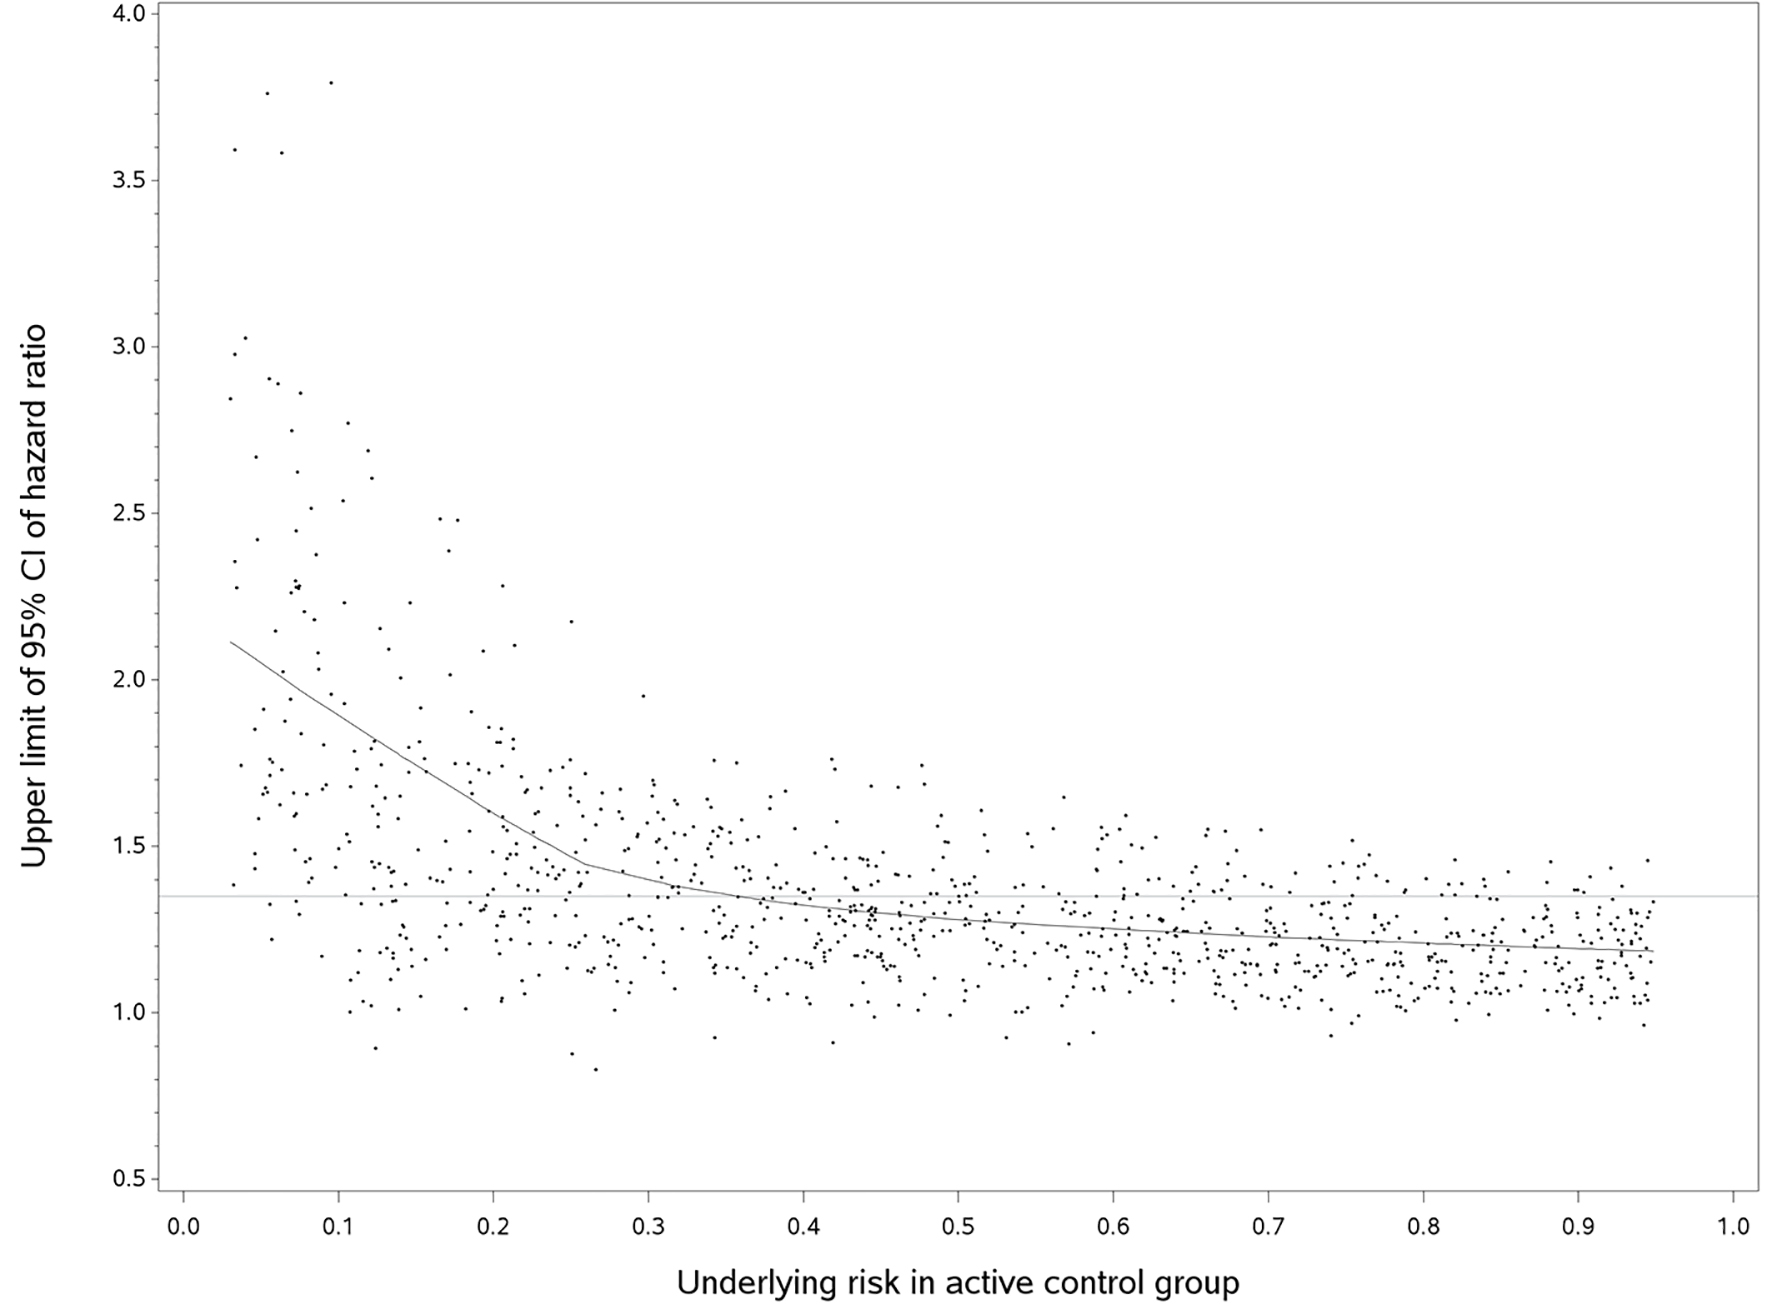 Click for large image | Figure 2. Upper limit of 95%CI of hazard ratio versus the underlying risk in active control group (true hazard ratio = 1). We randomly selected 1,000 out of 10,000 simulated trials, but the fitted line used the entire data. The horizontal line was an empirical non-inferiority margin, hazard ratio of 1.35. |
 Click to view | Table 1. The Probability of Rejecting the Null Hypothesis Using Hazard Ratio |
Effect measurement using DTKME
Compared with HR, the 95% upper limit of DTKME showed greater variability (Fig. 3). Shown in the fitted curve, the predicted 95% upper limits of DTKME gradually increased as the underlying risk increased and reached a maximum at an approximate control risk of 50%, and then decreased afterward. When we used the empirical non-inferiority margins, the probability of concluding non-inferiority would decrease as the underlying risk in the control increased. In such case, the probability of concluding non-inferiority was at a minimum when the control risk reached about 50%, and then increased as the control risk increased. The probability of rejecting the null hypothesis (HR = 1, 0.95 and 1.05) was reported in Table 2. When the non-inferiority margin was 2.5%, the probability of rejecting the null hypothesis was low in all simulated scenarios. When the non-inferiority margin was 15%, DTKME in almost all simulated scenarios fell within in the margin.
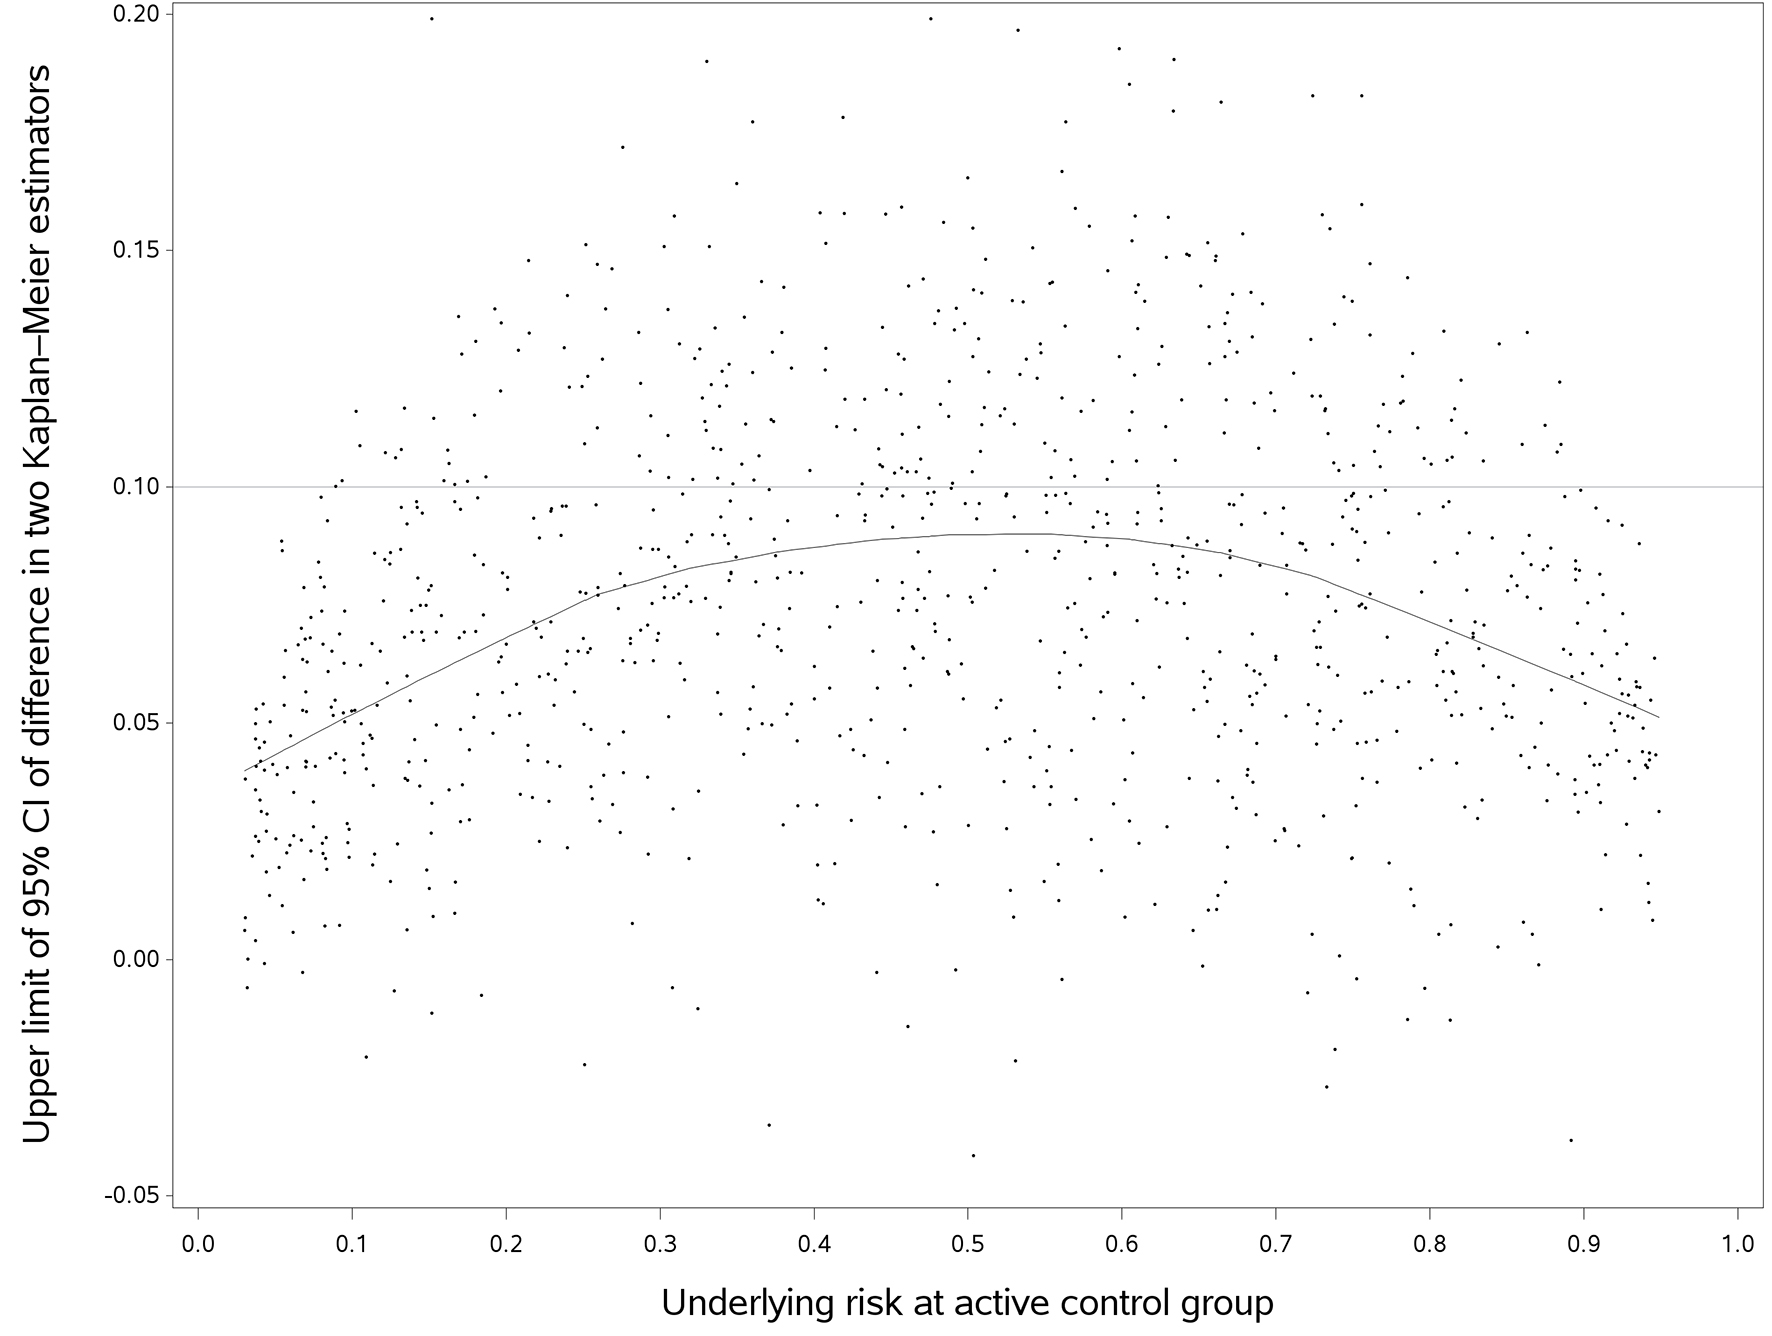 Click for large image | Figure 3. The upper limit of difference in two Kaplan-Meier estimators versus follow up time (true hazard ratio = 1). We randomly selected 1,000 out of 10,000 simulated trials in this plot, but the fitted line used the entire data. The horizontal line was an empirical non-inferiority margin, representing the difference in two Kaplan-Meier estimators of 10%. |
Click to view | Table 2. The Probability of Rejecting The Null Hypothesis Using the Difference in Two Kaplan-Meier Estimators |
Sensitivity analysis
For a larger sample size survival data (n = 2,000 and 10,000), the probability of rejecting the null hypothesis increased substantially for both effect measures. When we used shape parameter of 0.5 and 1 for the Weibull distribution, the trend of predicted HR and DTKME was similar to the base case analysis where shape parameter was 2. Also, the probability of rejecting the null hypothesis decreased for both effect measures with an increasing hazard of censoring (i.e. the number of events decreased accordingly). The results of the sensitivity analysis are summarized in Tables A1, A2 and A3 of Appendix 3 (Supplementary 1, www.jocmr.org).
| Discussion | ▴Top |
The simulation and analyses
We aimed to simulate realistic time-to-event data, including the recruitment period, time-to-censoring and period of closing out the trial. We chose Weibull distribution in the simulations because it is the most commonly used distribution for time-to-event data. Yet, our findings can be generalized to general condition and other distributions of time-to-event data. We used two-sided 95% CI, which has been most commonly used in NITs, as shown by empirical data. Thus, two-sided 95% CI in one NIT can also be used to assess superiority for exploratory purpose [15]. In addition, although the non-inferiority margin could be constructed using the synthesis method [13] and two-stage active control testing method [16], most trials used the fixed margin method, which often yield conservative estimate [13].
The trend of the probability of falling in the non-inferiority margin
Our study has shown that, besides the non-inferiority margin, the underlying risk in control arm and effect measures affected the probability of rejecting or not rejecting null hypothesis in an NIT. In particular, when the risk in control arm is low (e.g. < 10%), there is a noticeable discrepancy in concluding non-inferiority between using an absolute measure (i.e. DTKME) and using a relative measure (i.e. HR). In those cases, the probability of rejecting the null hypothesis is rather low if HR was used, but it becomes much higher when DTKME was used. Furthermore, using the same effect measures, different underlying control risk can lead to different conclusions of NITs.
Now, we may come back to the motivating example, the TARGIT-A trial [4]. Using measure of DTKME, when the HR of two treatments was constant, the probability of rejecting the null hypothesis at underlying risk of 0.95% would be much greater than that of 6%, as shown in Figure 3. A longer follow-up with a greater number of events could have changed the conclusion of this NIT [17].
Although it is difficult to recommend a particular effect measure for NITs for analyzing time-to-event data, the variability of measure by HR is smaller than that of KM, and the upper limit of 95% CI of HR will decrease as underlying control risk increases. However, when control risk is low (e.g. 5%) and sample size is not very large, 95% CI of the upper limit of HR is likely to exceed a typical non-inferiority margin. Under this condition, DTKME would be a reasonable alternative.
The present study did not intend to capture the situation with very low underlying risk, and the methods used to calculate 95% CI may be not appropriate for rare events (e.g. < 5). Thus, we chose underlying risk of 3% and the expect number of event was 9 per group. McEvoy and Frimpong discussed the implications of rare events in the NIT setting [18].
Conclusions
When HR is the effect measure, the probability of concluding non-inferiority will increase as the underlying risk in the control group increases. When DTKME is the effect measure, the probability of concluding non-inferiority will decrease as the underlying risk in the control increases. In this case, the probability of concluding non-inferiority is at a minimum when the control risk reaches about 50%. When the risk in the control arm is less than 10%, the conclusion of a non-inferiority trial is sensitive to the choice of effect measure.
Acknowledgments
We would like to thank Amy Zierler from Health Quality Ontario, Toronto, Canada, for her help in editing portions of the manuscript.
Disclaimer
The views expressed in this publication do not necessarily represent the views of Health Quality Ontario and should not be construed as representing an official position.
Sponsor
None.
| References | ▴Top |
- Piaggio G, Elbourne DR, Pocock SJ, Evans SJ, Altman DG, CONSORT Group. Reporting of noninferiority and equivalence randomized trials: extension of the CONSORT 2010 statement. JAMA. 2012;308(24):2594-2604.
doi pubmed - Kaul S, Diamond GA. Good enough: a primer on the analysis and interpretation of noninferiority trials. Ann Intern Med. 2006;145(1):62-69.
doi pubmed - D’Agostino RB, Sr., Massaro JM, Sullivan LM. Non-inferiority trials: design concepts and issues - the encounters of academic consultants in statistics. Stat Med. 2003;22(2):169-186.
doi pubmed - Vaidya JS, Joseph DJ, Tobias JS, Bulsara M, Wenz F, Saunders C, Alvarado M, et al. Targeted intraoperative radiotherapy versus whole breast radiotherapy for breast cancer (TARGIT-A trial): an international, prospective, randomised, non-inferiority phase 3 trial. Lancet. 2010;376(9735):91-102.
doi - Head SJ, Kaul S, Bogers AJ, Kappetein AP. Non-inferiority study design: lessons to be learned from cardiovascular trials. Eur Heart J. 2012;33(11):1318-1324.
doi pubmed - Rothmann M, Li N, Chen G, Chi GY, Temple R, Tsou HH. Design and analysis of non-inferiority mortality trials in oncology. Stat Med. 2003;22(2):239-264.
doi pubmed - Soonawala D, Middelburg RA, Egger M, Vandenbroucke JP, Dekkers OM. Efficacy of experimental treatments compared with standard treatments in non-inferiority trials: a meta-analysis of randomized controlled trials. Int J Epidemiol. 2010;39(6):1567-1581.
doi pubmed - Woodward M. Epidemiology: study design and data analysis. 2nd ed. Boca Raton: Chapman & Hall/CRC; 2005.
- Tanaka S, Kinjo Y, Kataoka Y, Yoshimura K, Teramukai S. Statistical issues and recommendations for noninferiority trials in oncology: a systematic review. Clin Cancer Res. 2012;18(7):1837-1847.
doi pubmed - Lin DY, Dai L, Cheng G, Sailer MO. On confidence intervals for the hazard ratio in randomized clinical trials. Biometrics. 2016;72(4):1098-1102.
doi pubmed - Hosmer DW, Lemeshow S, May S. Applied survival analysis: regression modeling of time to event data. 2nd ed. Hoboken: Wiley Blackwell; 2011.
- Wangge G, Roes KC, de Boer A, Hoes AW, Knol MJ. The challenges of determining noninferiority margins: a case study of noninferiority randomized controlled trials of novel oral anticoagulants. CMAJ. 2013;185(3):222-227.
doi pubmed - The food and drug administration of the United States. 2016. Non-inferiority clinical trials to establish effectiveness: guidance for industry. [Available from: https://www.fda.gov/downloads/Drugs/Guidances/UCM202140.pdf].
- Cleveland WS, Devlin SJ, Grosse E. Regression by local fitting: Methods, properties, and computational algorithms. J Econometrics. 1988;37(1):87-114.
doi - Snapinn SM. Noninferiority trials. Curr Control Trials Cardiovasc Med. 2000;1(1):19-21.
doi pubmed - Wang SJ, Hung HM. TACT method for non-inferiority testing in active controlled trials. Stat Med. 2003;22(2):227-238.
doi pubmed - Vaidya JS, Wenz F, Bulsara M, Tobias JS, Joseph DJ, Keshtgar M, Flyger HL, et al. Risk-adapted targeted intraoperative radiotherapy versus whole-breast radiotherapy for breast cancer: 5-year results for local control and overall survival from the TARGIT-A randomised trial. Lancet. 2014;383(9917):603-613.
doi - McEvoy BW, Frimpong EY. Testing a noninferiority hypothesis: what to anticipate when the adverse event is rare. J Biopharm Stat. 2013;23(1):122-128.
doi pubmed
This article is distributed under the terms of the Creative Commons Attribution Non-Commercial 4.0 International License, which permits unrestricted non-commercial use, distribution, and reproduction in any medium, provided the original work is properly cited.
Journal of Clinical Medicine Research is published by Elmer Press Inc.