

| Journal of Clinical Medicine Research, ISSN 1918-3003 print, 1918-3011 online, Open Access |
| Article copyright, the authors; Journal compilation copyright, J Clin Med Res and Elmer Press Inc |
| Journal website http://www.jocmr.org |
Original Article
Volume 9, Number 11, November 2017, pages 917-925
Body Composition Is Altered in Pre-Diabetic Patients With Impaired Fasting Glucose Tolerance: Results From the NHANES Survey
Valerie Juliana, b, f, Romain Blondela, Bruno Pereirac, David Thiveld, Yves Boirieb, e, Martine Duclosa, b
aService Medecine du Sport et Explorations Fonctionnelles, CHU Clermont-Ferrand, INRA, Universite Clermont Auvergne, Clermont-Ferrand, France
bUnite de Nutrition Humaine, CHU Clermont-Ferrand, INRA, Universite Clermont Auvergne, Clermont-Ferrand, France
cService de Biostatistique, CHU Clermont-Ferrand, Universite Clermont Auvergne, Clermont-Ferrand, France
dLaboratoire AME2P, Universite Clermont Auvergne, Aubiere, France
eService de Nutrition Clinique CHU Clermont-Ferrand, INRA, Universite Clermont Auvergne, Clermont-Ferrand, France
fCorresponding Author: Valerie Julian, Service Medecine du Sport et Explorations Fonctionnelles, CHU Clermont-Ferrand, Clermont-Ferrand, France
Manuscript submitted July 29, 2017, accepted August 21, 2017
Short title: Impaired FBG Alters Body Composition
doi: https://doi.org/10.14740/jocmr3142w
| Abstract | ▴Top |
Background: Previous studies suggest that type 2 diabetes mellitus (T2DM) is associated with a loss of muscle mass but the impact of fasting blood glucose (FBG) on body composition remains underappreciated in pre-diabetic subjects. The aim of this study was to determine the influence of FBG on lean mass (LM), fat mass (FM) and their distribution (trunk vs. appendicular), separately in middle-aged men and women.
Methods: One thousand nine hundred and eleven (1,911) men (63.9 ± 11.7 years) and 1,977 women (63.7 ± 12.1 years) from the National Health and Nutrition Examination Survey (1999 - 2004) were divided into four groups: normal glucose tolerance (NGT), low impaired fasting glucose (IFG), high IFG and T2DM. Body composition was obtained from dual X-ray absorptiometry (DXA).
Results: Of the patients, 68.7% had NGT, 16.1% low IFG, 9.4% high IFG and 5.8% T2DM. After adjustment for age, body mass index, ethnicity, smoking, alcohol and physical activity (PA), no change in appendicular LM was observed between groups, but significant increases in trunk FM (in both gender) and trunk LM (in women) were found with increased glucose intolerance (T2DM > IFG > NGT), as well as significant decreases in trunk and total LM/FM ratios (T2DM < IFG < NGT) and a significant increase in trunk/appendicular FM ratio (T2DM > IFG > NGT).
Conclusions: Elevated FBG within the normal range is not associated with a significant loss of appendicular LM, but modifications in LM and FM trunk and total distribution with IFG suggest that nutritional and physical lifestyle strategies should be implemented in the pre-diabetic state.
Keywords: Type 2 diabetes mellitus; Body composition; Gender; Insulin resistance; Mobility
| Introduction | ▴Top |
Recent studies have questioned about the impact of type 2 diabetes mellitus (T2DM) on muscle mass, but the results remain unclear and the hypothesis that T2DM is responsible for a loss of muscle mass is uncertain [1]. According to some experimental studies, insulin resistance (IR) can alter muscle protein turnover due to a disruption of intracellular insulin signaling pathways [2, 3]. This reduced metabolic response to insulin affects different key components of muscle, including mitochondria, which play a crucial role in energy production and ensure integrity of muscle [4]. Thus, in T2DM patients, IR but also the lack of insulin secretion could contribute to an altered muscle protein synthesis [5], and a progressive reduction of the muscle mass and function, favoring potential subsequent disabilities [6-9].
As part of the clinical routine, fasting blood glucose (FBG) concentrations provide through its large variability among populations a remarkable range of data spanning from normal glycemia to impaired fasting glucose (IFG) to T2DM. It has been demonstrated that higher FBG levels within the normoglycemic range constitute an independent risk factor for T2DM (i.e., subjects with IFG or impaired glucose tolerance (IGT)) [10]. Given that functional disabilities occur twice as often in T2DM patients compared with patients without T2DM [11] and that patients with pre-diabetes have a 10% annual conversion rate to T2DM [12], it seems of clinical interest to question the relationship between blood glucose homeostasis and muscle mass and function. This is particularly interesting since muscle mass and fat mass (FM) are known to act as a diabetogenic duo favoring IR and related cardiometabolic risks [13]. The impact of the glycemic status on body composition and muscle function, however, remains poorly questioned in pre-diabetic patients.
The Third National Health and Nutrition Examination Survey (NHANES III), representative of the North American population between 1988 and 1994, revealed an inversed relationship between skeletal muscle mass index and IR, glycated hemoglobin and prevalence of pre-diabetes [14]. The NHANES III survey however used bioelectrical impedance analyzers to assess body composition, which remains an indirect method and limits the interpretation of their results. Moreover, although they adjusted their analysis for gender, males and females were pooled. Nevertheless, the sexual dimorphism in lean and fat tissue amount and distribution should be considered. While it appears necessary to conduct deeper and more precise analysis regarding this association between body composition and glucose profile, the 1999 - 2004 NHANES survey provides us with data based on dual X-ray absorptiometry (DXA) scans (as one of the gold standards for the measure of body composition). The aim of the present study was then to question the impact of FBG on total and segmental muscle mass and FM in women and men. We hypothesis that impaired FBG (pre-diabetic stages) leads to altered body composition in adults and that body composition is affected by gender. Thus, we examined the associations between FBG (across a wide spectrum of FBG from normal glucose tolerance (NGT)) to T2DM) and lean and fat tissues (both appendicular and trunk distribution), separately in men and women.
| Materials and Methods | ▴Top |
Study population
Based on a complex sampling process using the latest census techniques, 31,126 participants representative of the North American population were selected in cross-sectional studies between 1999 and 2004 [15]. Participants provided their written informed consent and the study protocol was approved by the institutional review board of the Centers for Disease Control and Prevention (CDC). The data collected were released for free access by the NHANES researchers and were downloaded from the CDC website.
Sample analysis
We restricted our analysis to NHANES participants (men and women over 45 years of age), whose records had available DXA, FBG measurement, anthropometric data (i.e., gender, age, height, weight and ethnicity), documentation of tobacco and alcohol consumption, and physical activity (PA).
Glycemic status
Based on FBG, our population was divided into four groups following the American Diabetes Association criteria as follows: 1) NGT (FBG < 5.6 mmol/L) (n = 2,677); 2) low IFG (5.6 ≤ FBG < 6.1 mmol/L) (n = 627); 3) high IFG (6.1 ≤ FBG < 7 mmol/L) (n = 367); and 4) T2DM (FBG ≥ 7 mmol/L) (n = 224) [16]. Because of the heterogeneity of antidiabetic treatments in the NHANES’ population, only untreated T2DM were included. IR was expressed by homeostasis model assessment of insulin resistance (HOMA-IR) calculated by the formula HOMA-IR = glycemia (mmol/L) × insulinemia (mUI/L)/22.5 (HOMA-IR > 2.55) [17].
Anthropometric measurement and body composition
Height was measured by experienced technicians according to a standardized protocol. Weight and total body composition were measured by DXA using a Hologic QDR 400A dual photon densitometer (Hologic, Bedford, MA, USA). The DXA results were analyzed using Hologic Discovery software version 12.1 (Hologic), with a validity and reproducibility protocol previously reported [9, 18]. The body was segmented into two regions: trunk and limbs. For each region, FM and fat-free mass (FFM) were measured, with the sum of the two representing the total weight of the region. Then, bone mineral content was subtracted from FFM to define non-bone lean mass (LM). Trunk LM was calculated as the sum of trunk muscle mass and trunk visceral mass. Appendicular LM was calculated as the sum of lean soft tissue mass (fat-free, non-bone) in the arms and legs, which represents skeletal muscle mass of the limbs.
Covariate adjustments
The other characteristics analyzed included age (years) and ethnicity (Caucasian, African American, Hispanic or multiethnic). Smoking status (daily smoker, occasional or non-smoking), alcohol consumption (g/day) and PA (h/day) were also considered as potential confounders. PA was assessed using standardized questionnaires that catalogue daily household and sporting activities, which were then classified into three groups according to their intensity (low: < 3 metabolic equivalent of the task (MET); moderate: 3 - 6 METs; and vigorous: > 6 METs) to obtain the number of hours per day at each level of intensity [19].
Muscle function
The impact of FBG on muscle function was assessed by the time to complete a 20-foot walk. The walking time as a function of leg LM was also calculated [20].
Statistical analyses
Statistical analysis was performed using Stata software, version 13 (StataCorp, College Station, TX, USA). The tests were two-sided, with a type I error set at α = 0.05. Patient’s characteristics were presented as the mean ± standard deviation according to statistical distribution (assumption of normality assessed by using the Shapiro-Wilk test) and as the number of patients and associated percentages for categorical parameters. Comparisons between groups (NGT, low IFG, high IFG, and T2DM) were performed using the Chi-squared or Fisher’s exact test for categorical variables, and ANOVA or Kruskal-Wallis test when assumptions of ANOVA were not met (normality and homoscedasticity studied by Bartlett test) for quantitative parameters. When appropriate (omnibus P-value < 0.05), a post hoc test for multiple comparisons was applied to take into account inflate of type I error: Tukey-Kramer test post ANOVA and Dunn after Kruskal-Wallis. The study of relationships between quantitative parameters was analyzed using correlation coefficients (Pearson or Spearman according to statistical distribution). Finally, multivariate analyses were performed by linear models using covariates determined according to univariate results and clinical relevance: age, BMI, ethnicity, alcohol and tobacco consumption, and PA. When appropriate (normality of residuals was not verified), a logarithmic transformation was proposed to achieve normality of dependent variables.
| Results | ▴Top |
Population characteristics
The characteristics of the whole population are presented in Table 1 for men (n = 1,911), and Table 2 for women (n = 1,977). Mean BMI was 28.8 ± 5.8 kg/m2 for women and 27.9 ± 4.7 kg/m2 for men. Of the samples, 68.7% had NGT and 31.3% had abnormality of glucose regulation: 16.1% had low IFG, 9.4% had high IFG, and 5.8% had T2DM. Both in men and women, patients with T2DM and IFG had significantly higher BMI than those with NGT (P < 0.05). HOMA-IR significantly increases (from NGT to T2DM group) in both men and women (P < 0.05). Alcohol consumption did not differ between groups among women, while in men, T2DM group consumed less alcohol (P < 0.05). In women, low-intensity PA increases with FBG (P < 0.05), while moderate and vigorous PA decreases with FBG (P < 0.05). In men, there is no significant variation in PA between groups.
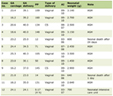 Click to view | Table 1. Characteristics of All Participants in Men |
Click to view | Table 2. Characteristics of All Participants in Women |
FM and LM distribution
Univariate analysis of body composition parameters is presented in Table 3 for men and women.
Click to view | Table 3. Fat Mass and Lean Mass Distribution for Each Group, Non-Adjusted for Covariates |
Multivariate analyses are presented in Figure 1 for men and Figure 2 for women. For men, appendicular LM and FM did not differ between groups. For women, appendicular LM did not differ but appendicular FM is higher in IFG groups compared to NGT and T2DM groups (P < 0.05), and higher in T2DM group compared to NGT group (P < 0.05). Concerning trunk, trunk FM is higher in high IFG and T2DM groups compared to NGT group (P < 0.05), in both men and women. In women, trunk LM is higher in IFG and T2DM groups compared to NGT group (P < 0.05). As a consequence of these results, in men, LM/FM ratios are significantly lower in high IFG and T2DM groups compared to NGT group for both trunk (P < 0.05) and total ratios (P < 0.05). In women, the trunk and total LM/FM ratios are not significant between groups. Although the results show lower appendicular LM/FM ratios in IFG groups compared with NGT in women, this remains non-significant. In both genders, trunk/appendicular FM ratios are higher in high IFG and T2DM groups compared to NGT group (appendicular FM increases more slowly with FBG than trunk FM).
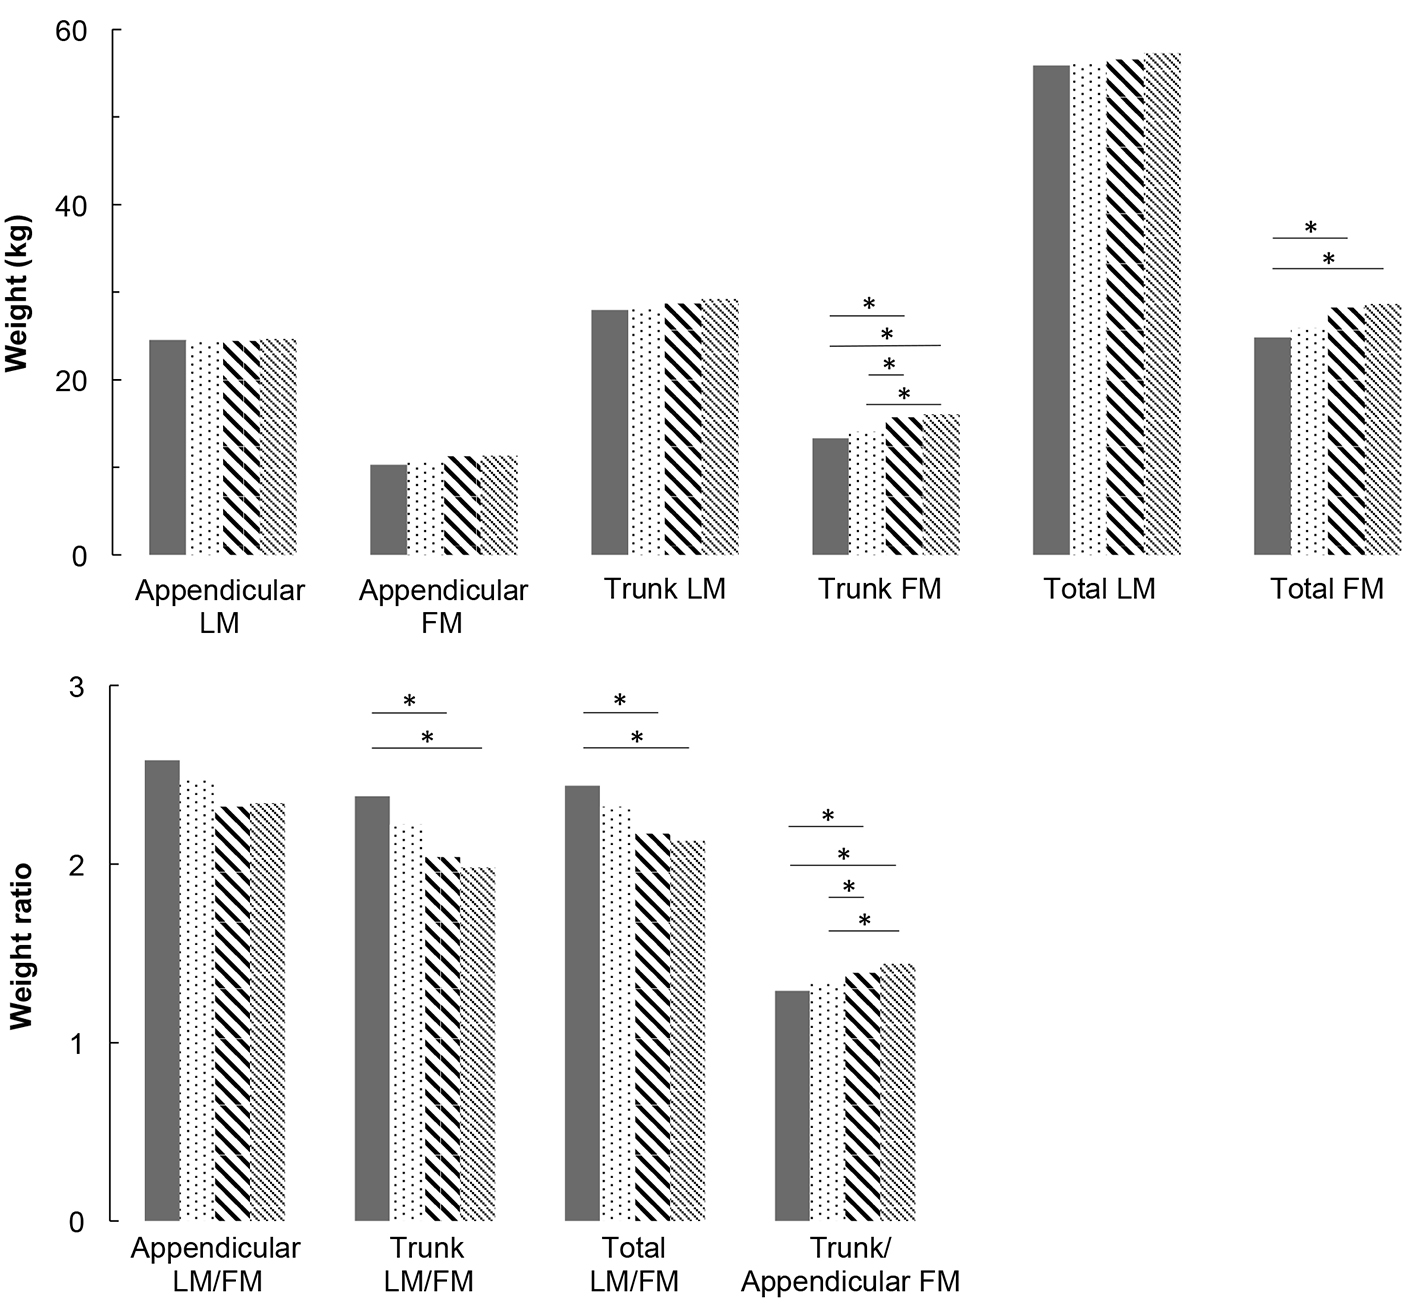 Click for large image | Figure 1. Lean mass and fat mass distribution adjusted for covariates (age, height, weight, ethnicity, physical activity, smoking and alcohol consumption) for men. * means that groups are significantly different from each other by a Tukey-Kramer pairwise comparison (P < 0.05). |
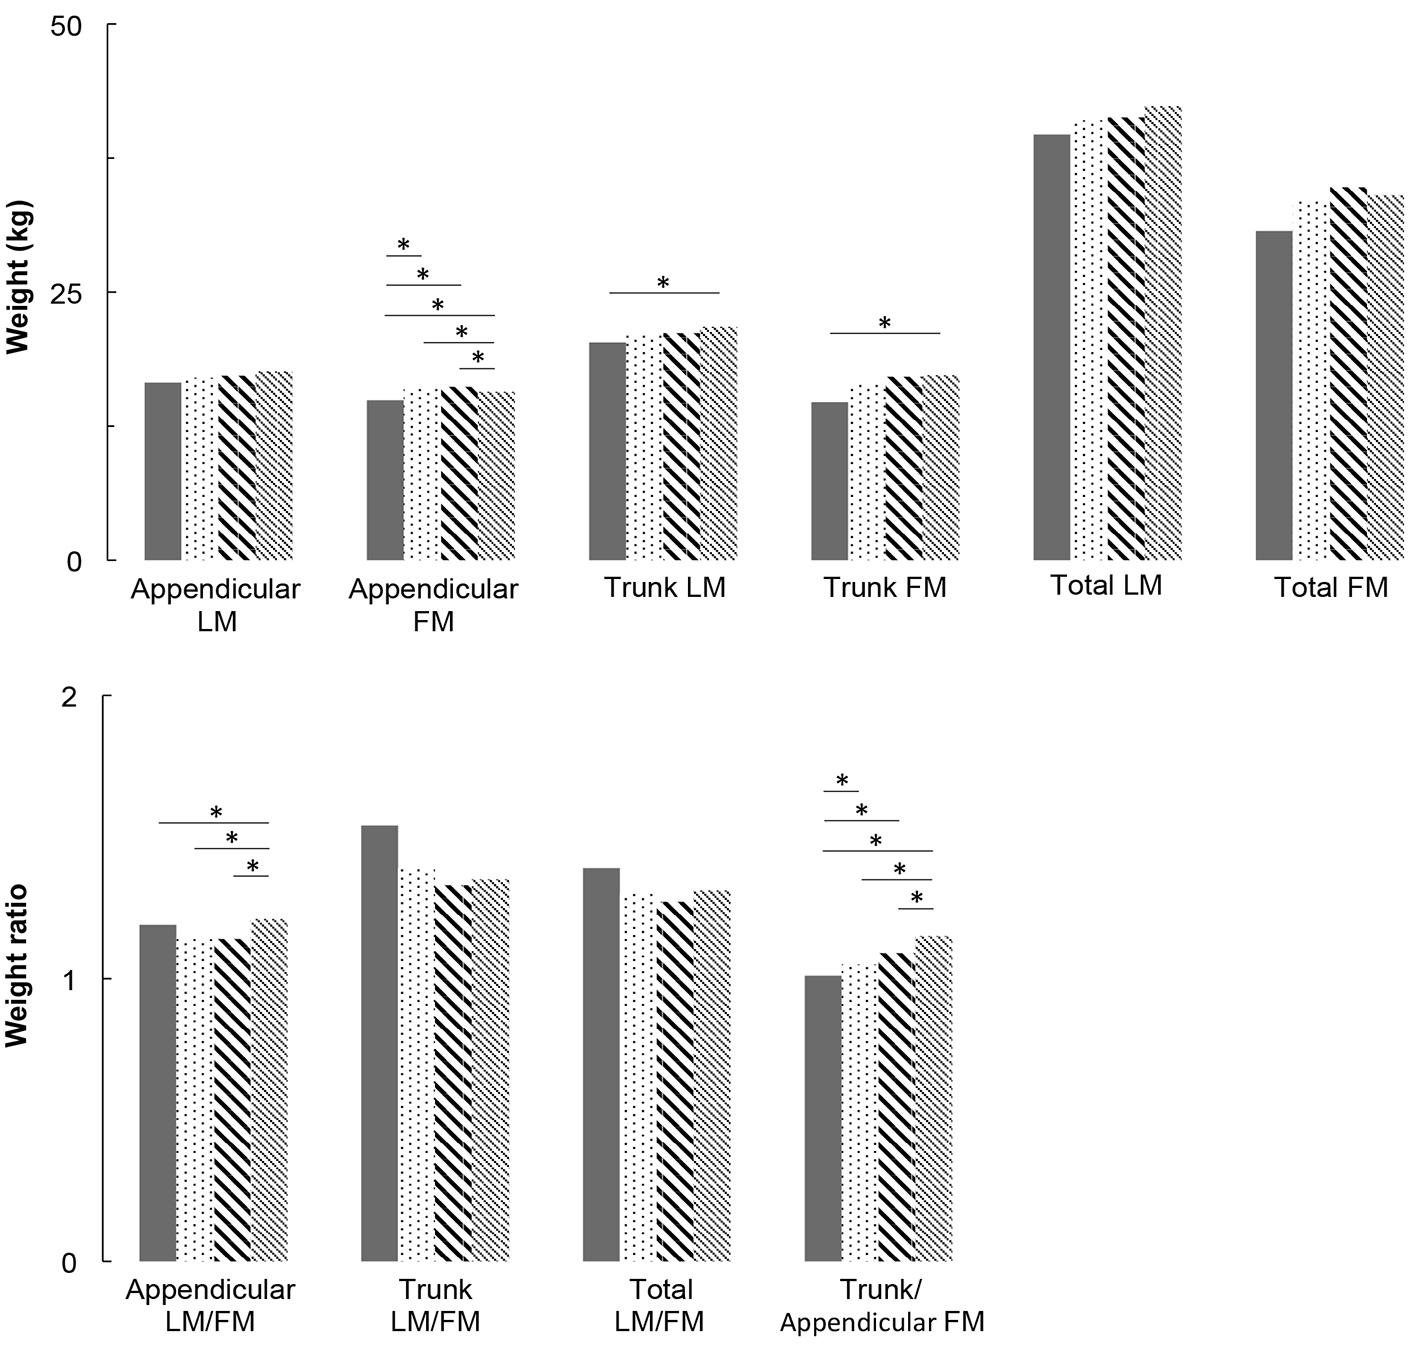 Click for large image | Figure 2. Lean mass and fat mass distribution adjusted for covariates (age, height, weight, ethnicity, physical activity, smoking and alcohol consumption) for women. * means that groups are significantly different from each other by a Tukey-Kramer pairwise comparison (P < 0.05). |
Muscle function
There is no significant difference in the absolute walking time to complete 20 feet between groups in men (6.7 ± 2.9 s for NGT, 6.7 ± 2.2 s for low IFG, 6.9 ± 2.4 s for high IFG and 6.9 ± 2.3 s for T2DM; P = 0.87), nor women (7.1 ± 3.6 s for NGT, 7.5 ± 3.9 s for low IFG, 7.7 ± 3.1 s for high IFG and 7.9 ± 3.6 s for T2DM; P = 0.31), neither using multivariate analysis. The walking time relative to leg LM was also not significant between groups in both men and women.
| Discussion | ▴Top |
The present study assessed the association between appendicular and trunk body composition and FBG levels, across a wide spectrum from NGT to T2DM in North American middle-aged men and women studied separately. After adjustment for age, BMI, ethnicity, smoking, alcohol and PA, our results show: 1) no change in appendicular LM and muscle function with the degree of glucose impairment, in both genders; 2) a significant increase in trunk FM with FBG in both genders, associated with a significant increase in trunk LM in women; 3) reduced total and trunk LM/FM ratios with FBG (significant in men but not significant in women); and 4) a significant increase in trunk/appendicular FM ratio with FBG in both genders (higher trunk FM increase compared with appendicular FM).
Overall, the present data suggest that hyperglycemia is not responsible for significant appendicular muscle modifications (neither mass nor function) in patients with pre-diabetes or T2DM. This result is consistent with a recent prospective 11-year follow-up study conducted in older adults (between 70 and 79 years old), which also missed to find association between the incidence of T2DM and muscle mass and strength, with adjusted models [21]. In the same study, unadjusted models indicate that total LM, thigh muscle areas and strength measures were associated with higher risk of T2DM, which was explained by the fact that LM is often associated with more body FM [21]. Furthermore, another recent study demonstrated that HbA1c, a marker of chronic hyperglycemia, is not related to the decreased skeletal LM and that the decrease in muscle strength may be due to other factors distinct from hyperglycemia [22]. These results are however not in line with some other previous ones suggesting that T2DM is associated with decreased muscle mass and muscle performances [6-9, 23, 24]. One of the strengths of the present study relies in the median age of 65 years, which is 10 years younger on average than subjects considered in many of these studies [6, 8, 9, 24]. Consequently, although we acknowledge that there is a physiological evidence that IR can alter muscle protein synthesis, there is a discrepancy concerning the link between glycemic status and clinical loss of muscle mass and function.
Another important result of the present study is the increase in trunk LM with FBG, which has previously been reported [7]. Trunk LM primarily represents visceral mass (i.e., kidneys, liver, pancreas and intestine). Early pancreatic (islet cells) and renal adaptive hypertrophy (proximal tubular and glomerular cells) are now well established in T2DM (based on both animal and human experiments) [25-28]. Chronic hyperglycemia is also associated with increased small intestinal enterocyte mass, supporting an important role of the small intestine in gluconeogenesis and the physiopathology of T2DM, as kidney and liver [29-31]. Further human studies using tomodensitometry measures are today necessary to identify the origin and the role of this increased trunk LM, which seems to occur particularly early in women.
As the trunk LM/FM ratio decreases in IFG compared to NGT groups, the present study demonstrates that the increase in trunk FM is more important than the increase in trunk LM. This modification in trunk composition begins in a pre-diabetes stage and may occur through IR, as visceral adiposity is positively associated with IFG and newly diagnosed T2DM [32]. Indeed, in the present study, IR was observed in both men and women of the IFG groups, with a significant increase in HOMA-IR from NBG subjects to subjects with T2DM. Aging and low-grade systemic inflammation (CRPus) that increase with FBG, are well-known factors associated with decreased muscle protein anabolism [33, 34]. In the present study, trunk/appendicular FM ratio significantly increases with FBG, in other words, trunk FM increases more than appendicular FM. These results are consistent with previously published ones showing an independent association between glucose levels [35] and cardiovascular risks [36] with both higher trunk FM and lower appendicular FM.
The observed decreased total LM/FM ratio may advertise for ulterior functional consequences of T2DM, particularly given the stagnation of appendicular LM during the deterioration of glucose homeostasis [8, 9]. Moreover, although this was not significant in the present study, we observed an increasing time to complete the 20 feet walk with FBG. Indeed, it is well established that velocity is an important predictor of disability and mortality [20]. It has also previously been well demonstrated that skeletal muscle strength is an independent predictor of morbi-mortality [37], regardless of whether this loss is rapid or occurs over several years [38-40]. Given that trunk and total FM increase with FBG without increased appendicular LM, potential later functional impairments and cardiovascular diseases justify the introduction of preventive strategies [41], including nutrition counseling and exercise training, to maintain total muscle mass and decrease fat mass, prior to the onset of T2DM.
We acknowledge that this study has several limitations. First, as with any cross-sectional study, our data demonstrate associations but cannot prove direct effect and causal relationships. Second, the effects of other modifiers of body composition, such as hormonal status in women (premenopausal vs. postmenopausal), other chronic diseases associated with T2DM and nutritional status were not considered and may explain part of the observed results and the difference between men and women. However, in view of the mean age of our women sample, the majority were likely post-menopausal women. Further studies should investigate the role of gender on body composition because gender-related metabolic changes have previously been described between men and women [42]. Finally, as DXA measures are not able to discriminate all tissue compartments, in particular intra-abdominal versus subcutaneous tissue, coming studies may use computed tomography and magnetic resonance spectroscopy to understand the real metabolic impact of such body composition changes.
Using a large sample size (3,888 middle-aged participants) and based on objective measurements for body composition (DXA scans), the present study demonstrates that appendicular LM is maintained while trunk and total FM increase in subjects with pre-diabetes compared with NGT. Further studies are needed to question the effects of PA on the evolution of trunk LM and on trunk LM/FM ratio, in particular as soon as the pre-diabetic state begins, in order to counteract the development of progressive metabolic disorders and functional impairments, by combining nutritional and physical interventions.
Competing Interests
The authors declare that they have no competing interests.
Grant Support
None.
| References | ▴Top |
- Peterson MD, Zhang P, Choksi P, Markides KS, Al Snih S. Muscle Weakness Thresholds for Prediction of Diabetes in Adults. Sports Med. 2016;46(5):619-628.
doi pubmed - Guillet C, Prod'homme M, Balage M, Gachon P, Giraudet C, Morin L, Grizard J, et al. Impaired anabolic response of muscle protein synthesis is associated with S6K1 dysregulation in elderly humans. FASEB J. 2004;18(13):1586-1587.
doi - Rasmussen BB, Fujita S, Wolfe RR, Mittendorfer B, Roy M, Rowe VL, Volpi E. Insulin resistance of muscle protein metabolism in aging. FASEB J. 2006;20(6):768-769.
doi - Guillet C, Delcourt I, Rance M, Giraudet C, Walrand S, Bedu M, Duche P, et al. Changes in basal and insulin and amino acid response of whole body and skeletal muscle proteins in obese men. J Clin Endocrinol Metab. 2009;94(8):3044-3050.
doi pubmed - Tanaka K, Kanazawa I, Sugimoto T. Reduction in Endogenous Insulin Secretion is a Risk Factor of Sarcopenia in Men with Type 2 Diabetes Mellitus. Calcif Tissue Int. 2015;97(4):385-390.
doi pubmed - Barzilay JI, Cotsonis GA, Walston J, Schwartz AV, Satterfield S, Miljkovic I, Harris TB, et al. Insulin resistance is associated with decreased quadriceps muscle strength in nondiabetic adults aged >or=70 years. Diabetes Care. 2009;32(4):736-738.
doi pubmed - Heshka S, Ruggiero A, Bray GA, Foreyt J, Kahn SE, Lewis CE, Saad M, et al. Altered body composition in type 2 diabetes mellitus. Int J Obes (Lond). 2008;32(5):780-787.
doi pubmed - Park SW, Goodpaster BH, Strotmeyer ES, Kuller LH, Broudeau R, Kammerer C, de Rekeneire N, et al. Accelerated loss of skeletal muscle strength in older adults with type 2 diabetes: the health, aging, and body composition study. Diabetes Care. 2007;30(6):1507-1512.
doi - Park SW, Goodpaster BH, Lee JS, Kuller LH, Boudreau R, de Rekeneire N, Harris TB, et al. Excessive loss of skeletal muscle mass in older adults with type 2 diabetes. Diabetes Care. 2009;32(11):1993-1997.
doi pubmed - Tirosh A, Shai I, Tekes-Manova D, Israeli E, Pereg D, Shochat T, Kochba I, et al. Normal fasting plasma glucose levels and type 2 diabetes in young men. N Engl J Med. 2005;353(14):1454-1462.
doi pubmed - Rejeski WJ, Ip EH, Bertoni AG, Bray GA, Evans G, Gregg EW, Zhang Q, et al. Lifestyle change and mobility in obese adults with type 2 diabetes. N Engl J Med. 2012;366(13):1209-1217.
doi pubmed - Knowler WC, Barrett-Connor E, Fowler SE, Hamman RF, Lachin JM, Walker EA, Nathan DM, et al. Reduction in the incidence of type 2 diabetes with lifestyle intervention or metformin. N Engl J Med. 2002;346(6):393-403.
doi pubmed - Despres JP. Body fat distribution and risk of cardiovascular disease: an update. Circulation. 2012;126(10):1301-1313.
doi pubmed - Srikanthan P, Karlamangla AS. Relative muscle mass is inversely associated with insulin resistance and prediabetes. Findings from the third National Health and Nutrition Examination Survey. J Clin Endocrinol Metab. 2011;96(9):2898-2903.
doi pubmed - Flegal KM, Shepherd JA, Looker AC, Graubard BI, Borrud LG, Ogden CL, Harris TB, et al. Comparisons of percentage body fat, body mass index, waist circumference, and waist-stature ratio in adults. Am J Clin Nutr. 2009;89(2):500-508.
doi pubmed - American Diabetes A. 2. Classification and diagnosis of diabetes. Diabetes Care. 2016;39(Suppl 1):S13-22.
doi pubmed - Wallace TM, Levy JC, Matthews DR. Use and abuse of HOMA modeling. Diabetes Care. 2004;27(6):1487-1495.
doi - Visser M, Fuerst T, Lang T, Salamone L, Harris TB. Validity of fan-beam dual-energy X-ray absorptiometry for measuring fat-free mass and leg muscle mass. Health, Aging, and Body Composition Study - Dual-Energy X-ray Absorptiometry and Body Composition Working Group. J Appl Physiol (1985). 1999;87(4):1513-1520.
- US Department of Health and Human Services 2008 physical activity guidelines for Americans-Appendix 1. 2008.
- Studenski S, Perera S, Patel K, Rosano C, Faulkner K, Inzitari M, Brach J, et al. Gait speed and survival in older adults. JAMA. 2011;305(1):50-58.
doi pubmed - Larsen BA, Wassel CL, Kritchevsky SB, Strotmeyer ES, Criqui MH, Kanaya AM, Fried LF, et al. Association of muscle mass, area, and strength with incident diabetes in older adults: the health ABC study. J Clin Endocrinol Metab. 2016;101(4):1847-1855.
doi pubmed - Kalyani RR, Metter EJ, Egan J, Golden SH, Ferrucci L. Hyperglycemia predicts persistently lower muscle strength with aging. Diabetes Care. 2015;38(1):82-90.
doi pubmed - Kalyani RR, Metter EJ, Ramachandran R, Chia CW, Saudek CD, Ferrucci L. Glucose and insulin measurements from the oral glucose tolerance test and relationship to muscle mass. J Gerontol A Biol Sci Med Sci. 2012;67(1):74-81.
doi pubmed - Perera S, Patel KV, Rosano C, Rubin SM, Satterfield S, Harris T, Ensrud K, et al. Gait Speed Predicts Incident Disability: A Pooled Analysis. J Gerontol A Biol Sci Med Sci. 2016;71(1):63-71.
doi pubmed - Habib SL. Tuberin in renal cell hypertrophy. Cell Cycle. 2014;13(6):869-870.
doi pubmed - Mohapatra S, Majumder S, Smyrk TC, Zhang L, Matveyenko A, Kudva YC, Chari ST. Diabetes Mellitus Is Associated With an Exocrine Pancreatopathy: Conclusions From a Review of Literature. Pancreas. 2016;45(8):1104-1110.
doi pubmed - Moroki T, Yoshikawa Y, Yoshizawa K, Tsubura A, Yasui H. Morphological characterization of systemic changes in KK-Ay mice as an animal model of type 2 diabetes. In Vivo. 2013;27(4):465-472.
pubmed - Wolf G, Ziyadeh FN. Molecular mechanisms of diabetic renal hypertrophy. Kidney Int. 1999;56(2):393-405.
doi pubmed - Mithieux G, Rajas F, Gautier-Stein A. A novel role for glucose 6-phosphatase in the small intestine in the control of glucose homeostasis. J Biol Chem. 2004;279(43):44231-44234.
doi pubmed - Schedl HP, Wilson HD. Effects of diabetes on intestinal growth in the rat. J Exp Zool. 1971;176(4):487-495.
doi - Verdam FJ, Greve JW, Roosta S, van Eijk H, Bouvy N, Buurman WA, Rensen SS. Small intestinal alterations in severely obese hyperglycemic subjects. J Clin Endocrinol Metab. 2011;96(2):E379-383.
doi pubmed - Borel AL, Nazare JA, Smith J, Aschner P, Barter P, Van Gaal L, Eng Tan C, et al. Visceral, subcutaneous abdominal adiposity and liver fat content distribution in normal glucose tolerance, impaired fasting glucose and/or impaired glucose tolerance. Int J Obes (Lond). 2015;39(3):495-501.
doi pubmed - Ding Y, Li S, Ma RL, Guo H, Zhang J, Zhang M, Liu J, et al. Association of homeostasis model assessment of insulin resistance, adiponectin, and low-grade inflammation with the course of the metabolic syndrome. Clin Biochem. 2015;48(7-8):503-507.
doi pubmed - Fujita S, Glynn EL, Timmerman KL, Rasmussen BB, Volpi E. Supraphysiological hyperinsulinaemia is necessary to stimulate skeletal muscle protein anabolism in older adults: evidence of a true age-related insulin resistance of muscle protein metabolism. Diabetologia. 2009;52(9):1889-1898.
doi pubmed - Snijder MB, Dekker JM, Visser M, Bouter LM, Stehouwer CD, Yudkin JS, Heine RJ, et al. Trunk fat and leg fat have independent and opposite associations with fasting and postload glucose levels: the Hoorn study. Diabetes Care. 2004;27(2):372-377.
doi pubmed - Despres JP, Lemieux S, Lamarche B, Prud'homme D, Moorjani S, Brun LD, Gagne C, et al. The insulin resistance-dyslipidemic syndrome: contribution of visceral obesity and therapeutic implications. Int J Obes Relat Metab Disord. 1995;19(Suppl 1):S76-86.
- Metter EJ, Talbot LA, Schrager M, Conwit R. Skeletal muscle strength as a predictor of all-cause mortality in healthy men. J Gerontol A Biol Sci Med Sci. 2002;57(10):B359-365.
doi pubmed - Look ARG, Wing RR. Long-term effects of a lifestyle intervention on weight and cardiovascular risk factors in individuals with type 2 diabetes mellitus: four-year results of the Look AHEAD trial. Arch Intern Med. 2010;170(17):1566-1575.
- Szulc P, Munoz F, Marchand F, Chapurlat R, Delmas PD. Rapid loss of appendicular skeletal muscle mass is associated with higher all-cause mortality in older men: the prospective MINOS study. Am J Clin Nutr. 2010;91(5):1227-1236.
doi pubmed - Wannamethee SG, Shaper AG, Lennon L, Whincup PH. Decreased muscle mass and increased central adiposity are independently related to mortality in older men. Am J Clin Nutr. 2007;86(5):1339-1346.
pubmed - Prado CM, Siervo M, Mire E, Heymsfield SB, Stephan BC, Broyles S, Smith SR, et al. A population-based approach to define body-composition phenotypes. Am J Clin Nutr. 2014;99(6):1369-1377.
doi pubmed - Markofski MM, Volpi E. Protein metabolism in women and men: similarities and disparities. Curr Opin Clin Nutr Metab Care. 2011;14(1):93-97.
doi pubmed
This article is distributed under the terms of the Creative Commons Attribution Non-Commercial 4.0 International License, which permits unrestricted non-commercial use, distribution, and reproduction in any medium, provided the original work is properly cited.
Journal of Clinical Medicine Research is published by Elmer Press Inc.