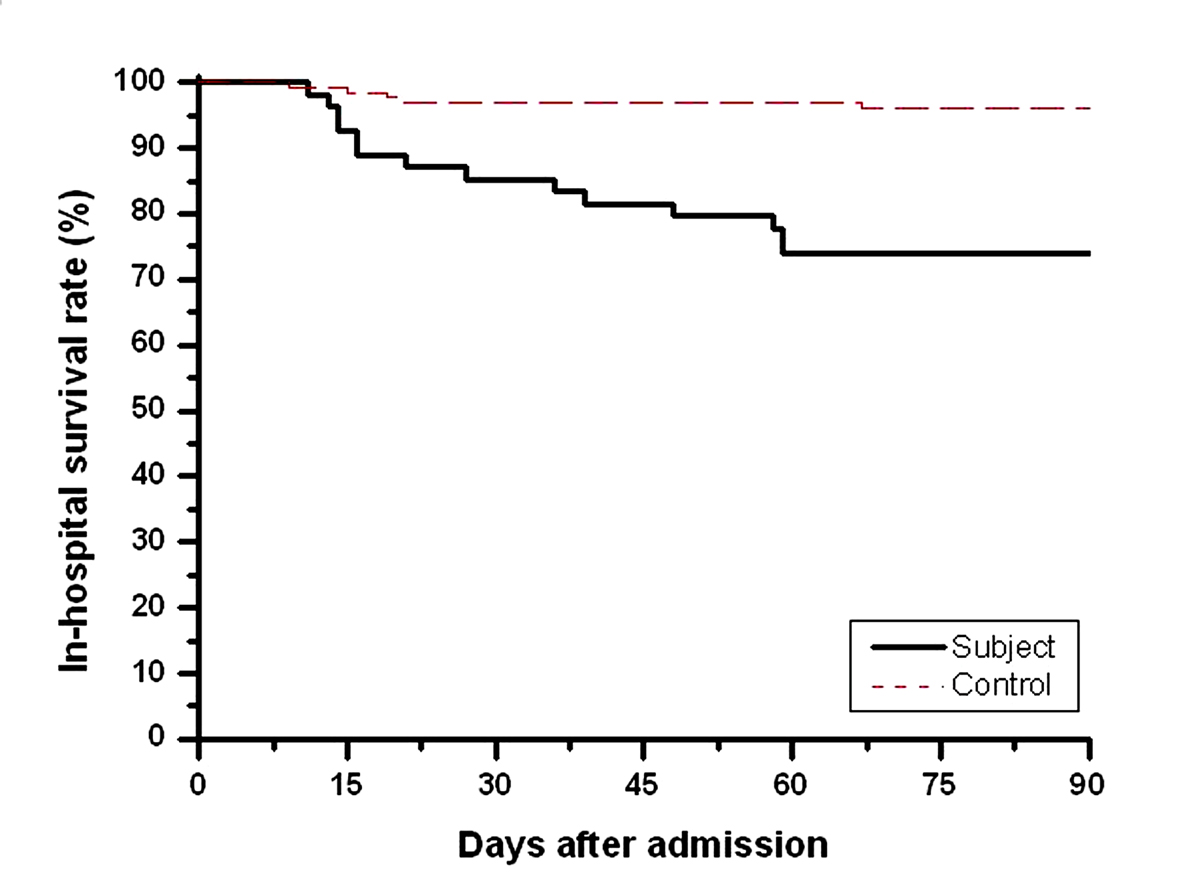
Figure 1. In-hospital survival curves of subjects (black line) and controls (red line) using Kaplan-Meier. P (log rank test) < 0.005.
| Journal of Clinical Medicine Research, ISSN 1918-3003 print, 1918-3011 online, Open Access |
| Article copyright, the authors; Journal compilation copyright, J Clin Med Res and Elmer Press Inc |
| Journal website http://www.jocmr.org |
Original Article
Volume 3, Number 6, December 2011, pages 309-318
Characteristics and Outcome of Patients With Dual Pulmonary Tuberculosis and Non-mycobacterial Respiratory Infections
Figure
Tables
| Control | Subject | Total | P-value | ||||
| N | % | N | % | N | % | ||
| Data are presented as mean ± SD (range) unless otherwise indicated. NS: non-significant; PTB: pulmonary tuberculosis; COPD: chronic obstructive pulmonary disease; HCV: hepatitis C virus; HIV: human immunodeficiency virus. P-value for comparisons between PTB and dual infections. | |||||||
| Subjects | 128 | 70.3 | 54 | 29.7 | 182 | 100 | |
| Age years | 48.4 ± 23.0 (20 - 93) | 64.0 ± 23.0 (16 - 89) | 53.0 ± 24.0 (16 - 93) | < 0.0001 | |||
| < 30 years | 44 | 34.4 | 10 | 18.5 | 54 | 29.7 | |
| 30-60 years | 43 | 33.6 | 5 | 9.3 | 48 | 26.4 | |
| > 60 years | 41 | 32.0 | 39 | 72.2 | 80 | 43.9 | |
| Male sex | 106 | 79.2 | 44 | 77.3 | 150 | 78.7 | NS |
| Indigenes | 80 | 62.5 | 27 | 50.0 | 107 | 58.8 | NS |
| Origin | |||||||
| Geriatric members | 40 | 31.3 | 25 | 46.3 | 65 | 35.7 | NS |
| Military conscripts | 26 | 20.3 | 6 | 11.1 | 32 | 17.6 | NS |
| Civilian | 62 | 48.4 | 23 | 42.6 | 85 | 46.7 | NS |
| Low socioeconomic | 71 | 55.5 | 40 | 74.1 | 111 | 61.0 | 0.0187 |
| Comorbidities | |||||||
| Ever-smoker | 64 | 50.0 | 30 | 55.6 | 94 | 51.6 | NS |
| COPD | 28 | 21.9 | 13 | 24.1 | 41 | 22.5 | NS |
| Recurrent PTB | 27 | 21.1 | 8 | 14.8 | 35 | 19.2 | NS |
| Alcoholism | 44 | 34.4 | 17 | 31.5 | 61 | 33.5 | NS |
| HCV | 5 | 3.9 | 5 | 9.3 | 10 | 5.5 | NS |
| Cirrhosis | 15 | 11.7 | 9 | 16.7 | 24 | 13.2 | NS |
| Renal insufficiency | 13 | 10.2 | 15 | 27.8 | 28 | 15.4 | 0.0041 |
| Diabetes | 13 | 10.2 | 7 | 13.0 | 20 | 11.0 | NS |
| Malignancy | 5 | 3.9 | 6 | 11.1 | 11 | 6.0 | NS |
| HIV | 0 | 0 | 1 | 1.9 | 1 | 0.5 | NS |
| Control | Subject | Total | P-value | ||||
|---|---|---|---|---|---|---|---|
| N | % | N | % | N | % | ||
| Data are presented as mean ± SD and N (%) unless otherwise indicated. NS: non-significant; PTB: pulmonary tuberculosis; WBC: white blood cell counts; Na: sodium; K: potassium; BUN: blood urea nitrogen; AST: aspartate aminotransferase; ALT: alanine aminotransaminase; Gamma-GT: gamma glutamyl transpeptidase. | |||||||
| Clinical symptoms | |||||||
| Fever | 68 | 53.1 | 23 | 42.6 | 91 | 50.0 | NS |
| Cough/sputum | 100 | 78.1 | 49 | 90.7 | 149 | 81.9 | 0.0436 |
| Hemoptysis | 13 | 10.2 | 7 | 13.0 | 20 | 11.0 | NS |
| Chest pain | 18 | 14.1 | 6 | 11.1 | 24 | 13.2 | NS |
| Weight loss | 24 | 18.8 | 7 | 13.0 | 31 | 17.0 | NS |
| Laboratory characteristics | |||||||
| WBC (103/L) | 9.0 ± 4.3 | 11.7 ± 5.2 | 9.8 ± 4.7 | 0.0005 | |||
| Hemoglobin (g/dL) | 12.3 ± 1.8 | 11.8 ± 2.1 | 12.2 ± 1.9 | NS | |||
| Platelet (103/L) | 302.1 ± 134.5 | 259.0 ± 108.5 | 288.7 ± 128.2 | 0.0400 | |||
| Neutrophil (%) | 74.0 ± 11.3 | 78.4 ± 13.7 | 75.4 ± 12.2 | 0.0318 | |||
| Lymphocyte (%) | 16.7 ± 8.8 | 12.6 ± 8.3 | 15.4 ± 8.8 | 0.0059 | |||
| Na (mmol/L) | 134.7 ± 5.2 | 133.2 ± 7.6 | 134.3 ± 6.0 | NS | |||
| K (mmol/L) | 4.0 ± 0.6 | 3.9 ± 0.7 | 4.0 ± 0.6 | NS | |||
| BUN (mg/dL) | 15.0 ± 8.8 | 25.3 ± 21.4 | 18.1 ± 14.6 | 0.0014 | |||
| Creatinine (mg/dL) | 1.0 ± 0.6 | 1.2 ± 0.8 | 1.1 ± 0.6 | NS | |||
| AST (U/L) | 39.0 ± 37.1 | 52.2 ± 61.5 | 42.7 ± 45.5 | NS | |||
| ALT (U/L) | 29.1 ± 28.0 | 50.7 ± 121.0 | 34.9 ± 67.2 | NS | |||
| Total bilirubin (mg/dL) | 1.1 ± 1.3 | 1.1 ± 0.9 | 1.1 ± 1.2 | NS | |||
| G-GT (U/L) | 65.5 ± 103.2 | 91.2 ± 174.1 | 72.3 ± 125.7 | NS | |||
| Alkaline phosphatase (U/L) | 93.7 ± 48.3 | 90.0 ± 47.2 | 92.3 ± 47.7 | NS | |||
| Cholesterol (mg/dL) | 128.1 ± 39.1 | 121.1 ± 53.4 | 126.1 ± 43.5 | NS | |||
| Triglyceride (mg/dL) | 89.6 ± 57.9 | 85.7 ± 59.6 | 88.4 ± 58.2 | NS | |||
| Albumin (mg/dL) | 3.1 ± 0.7 | 2.8 ± 0.8 | 3.0 ± 0.8 | 0.0091 | |||
| Radiographic characteristics | |||||||
| Upper lobe infiltrate | 70 | 54.7 | 18 | 33.3 | 88 | 48.4 | 0.0085 |
| Multi-lobar infiltrates | 11 | 8.6 | 12 | 22.2 | 23 | 12.6 | 0.0115 |
| Alveolar consolidation | 33 | 25.8 | 26 | 48.2 | 59 | 32.4 | 0.0032 |
| Pleural effusion | 24 | 18.8 | 8 | 14.8 | 32 | 17.6 | NS |
| Cavitary lesion | 13 | 10.2 | 3 | 5.6 | 16 | 8.8 | NS |
| Bronchiectasis | 8 | 6.3 | 3 | 5.6 | 11 | 6.0 | NS |
| Emphysema | 20 | 15.6 | 4 | 7.4 | 24 | 13.2 | NS |
| Control | Subject | Total | P-value | ||||
|---|---|---|---|---|---|---|---|
| N | % | N | % | N | % | ||
| Data are presented as N (%) unless otherwise stated. NS: non-significant; AFB: acid-fast stain; PTB: pulmonary tuberculosis. | |||||||
| Positive sputum AFB | 61 | 47.7 | 28 | 51.9 | 92 | 50.5 | NS |
| Delayed diagnosis of PTB | 37 | 28.8 | 25 | 46.3 | 62 | 34.1 | 0.0271 |
| In-hospital outcomes | 0.0436 | ||||||
| Nosocomial pneumonia | 10 | 7.8 | 12 | 22.2 | 22 | 12.1 | 0.0064 |
| Acute respiratory failure | 11 | 8.6 | 17 | 31.5 | 28 | 15.4 | < 0.0001 |
| Septic shock | 4 | 3.1 | 8 | 14.8 | 12 | 6.6 | 0.0069 |
| Mortality | 5 | 3.9 | 14 | 25.9 | 19 | 10.4 | < 0.0001 |
| Bacterial species | Number (N) |
|---|---|
| Atypical pathogens | |
| Mycoplasma pneumonia | 12 |
| Legionella pneumonia | 6 |
| Chlamydia pneumnia | 2 |
| Gram-positive pathogens | |
| Steptococcus pneumonia | 6 |
| Staphylococcus aureus | 6 |
| Enterococcus species | 1 |
| Gram-negative pathogens | |
| Klebsiella pneumoniae | 11 |
| Haemophilus influenzae | 6 |
| Pseudomonas aeruginosa | 4 |
| Escherichia coli | 4 |
| Proteus mirabilis | 3 |
| Stenotrophomonas maltophilia | 3 |
| Enterobacter | 2 |
| Survivors | Deceased | Total | P-value | ||||
|---|---|---|---|---|---|---|---|
| N | % | N | % | N | % | ||
| Data are presented as N (%) unless otherwise stated. NS: non-significant; TB: tuberculosis. | |||||||
| Bacteriological classifications | NS | ||||||
| Atypical bacteria | 14 | 70.0 | 6 | 30.0 | 20 | 30.3 | |
| Gram-positive bacteria | 9 | 69.2 | 4 | 30.8 | 13 | 19.7 | |
| Gram-negative bacteria | 23 | 69.7 | 10 | 30.2 | 33 | 50.0 | |
| Number of non-TB bacterial infections | 0.0147 | ||||||
| Poly-bacterial infection | 13 | 56.5 | 10 | 43.5 | 23 | 42.6 | |
| Mono-bacterial infection | 27 | 87.1 | 4 | 12.9 | 31 | 57.4 | |