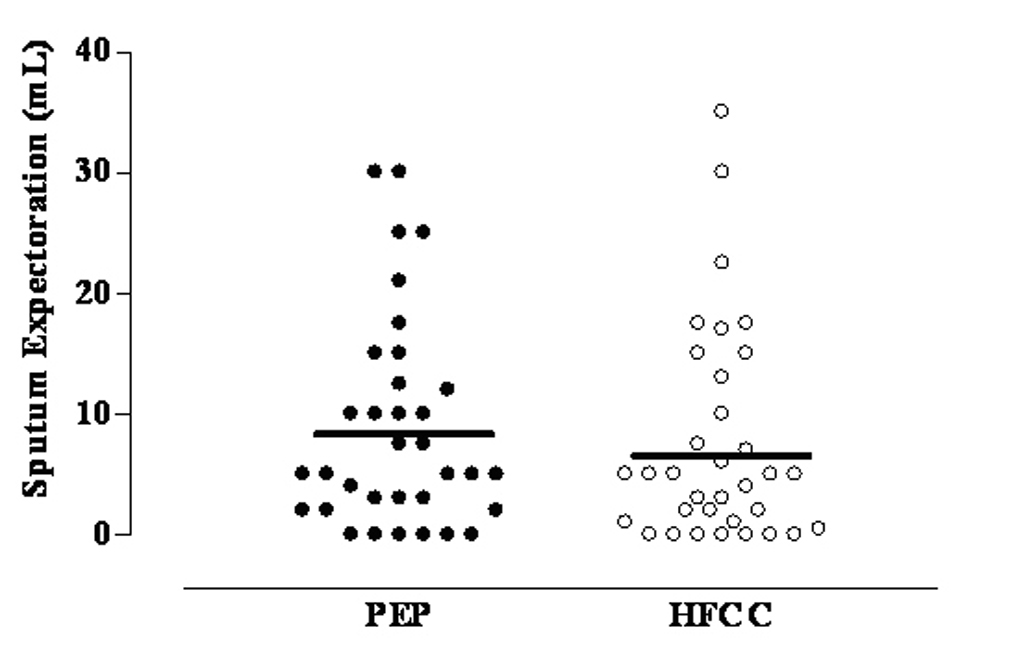
Figure 1. Mean and individual values of sputum expectoration after PEP and HFCC in 34 CF patients.
| Journal of Clinical Medicine Research, ISSN 1918-3003 print, 1918-3011 online, Open Access |
| Article copyright, the authors; Journal compilation copyright, J Clin Med Res and Elmer Press Inc |
| Journal website http://www.jocmr.org |
Original Article
Volume 3, Number 6, December 2011, pages 279-284
Short-Term Effects of High-Frequency Chest Compression and Positive Expiratory Pressure in Patients With Cystic Fibrosis
Figure
Tables
| Demographics and baseline characteristics | value |
| BMI: body mass index; SpO2: transcutaneous pulsed arterial oxygen saturation; FEV1: forced expiratory volume in 1 second. Data are presented as mean ± SD or ratio as appropriate. | |
| Age (year) | 26 ± 6.5 |
| Gender (M / F) | 14 / 20 |
| BMI (kg/m2) | 19.72 ± 6.35 |
| SpO2 (%) | 97.7 ± 1.4 |
| FEV1 (% pred) | 67 ± 17 |
| Device | FEV1 | FEF25-75 (%) | FVC (%) | SpO2 (%) | ||||
| (% predicted) | ||||||||
| pre | post | pre | post | pre | post | pre | post | |
| FEV1: forced expiratory volume in 1 second; FEF25-75: forced expiratory flow 25 - 75%; FVC, forced vital capacity. *P < 0.001. No statistically significant difference was found in spirometric values before and after both treatments. A statistically significant decrease in SpO2 values was found after PEP treatment. | ||||||||
| HFCC | 67 ± 17 | 66 ± 17 | 34 ± 21 | 33 ± 21 | 88 ± 17 | 87 ± 16 | 97 ± 1.6 | 97 ± 1.2 |
| PEP | 67 ± 16 | 67 ± 16 | 34 ± 20 | 34 ± 19 | 88 ± 15 | 87 ± 15 | 98 ± 1.0 | 97 ± 1.2* |
| Pre | Post | P value | |
| Both treatments induced a statistically significant increase in Borg scale for dyspnea, without differences between them. | |||
| HFCC | 0.7 ± 0.9 | 1.5 ± 1.7 | < 0.01 |
| PEP | 0.9 ± 1.2 | 1.6 ± 1.6 | < 0.001 |