Figures
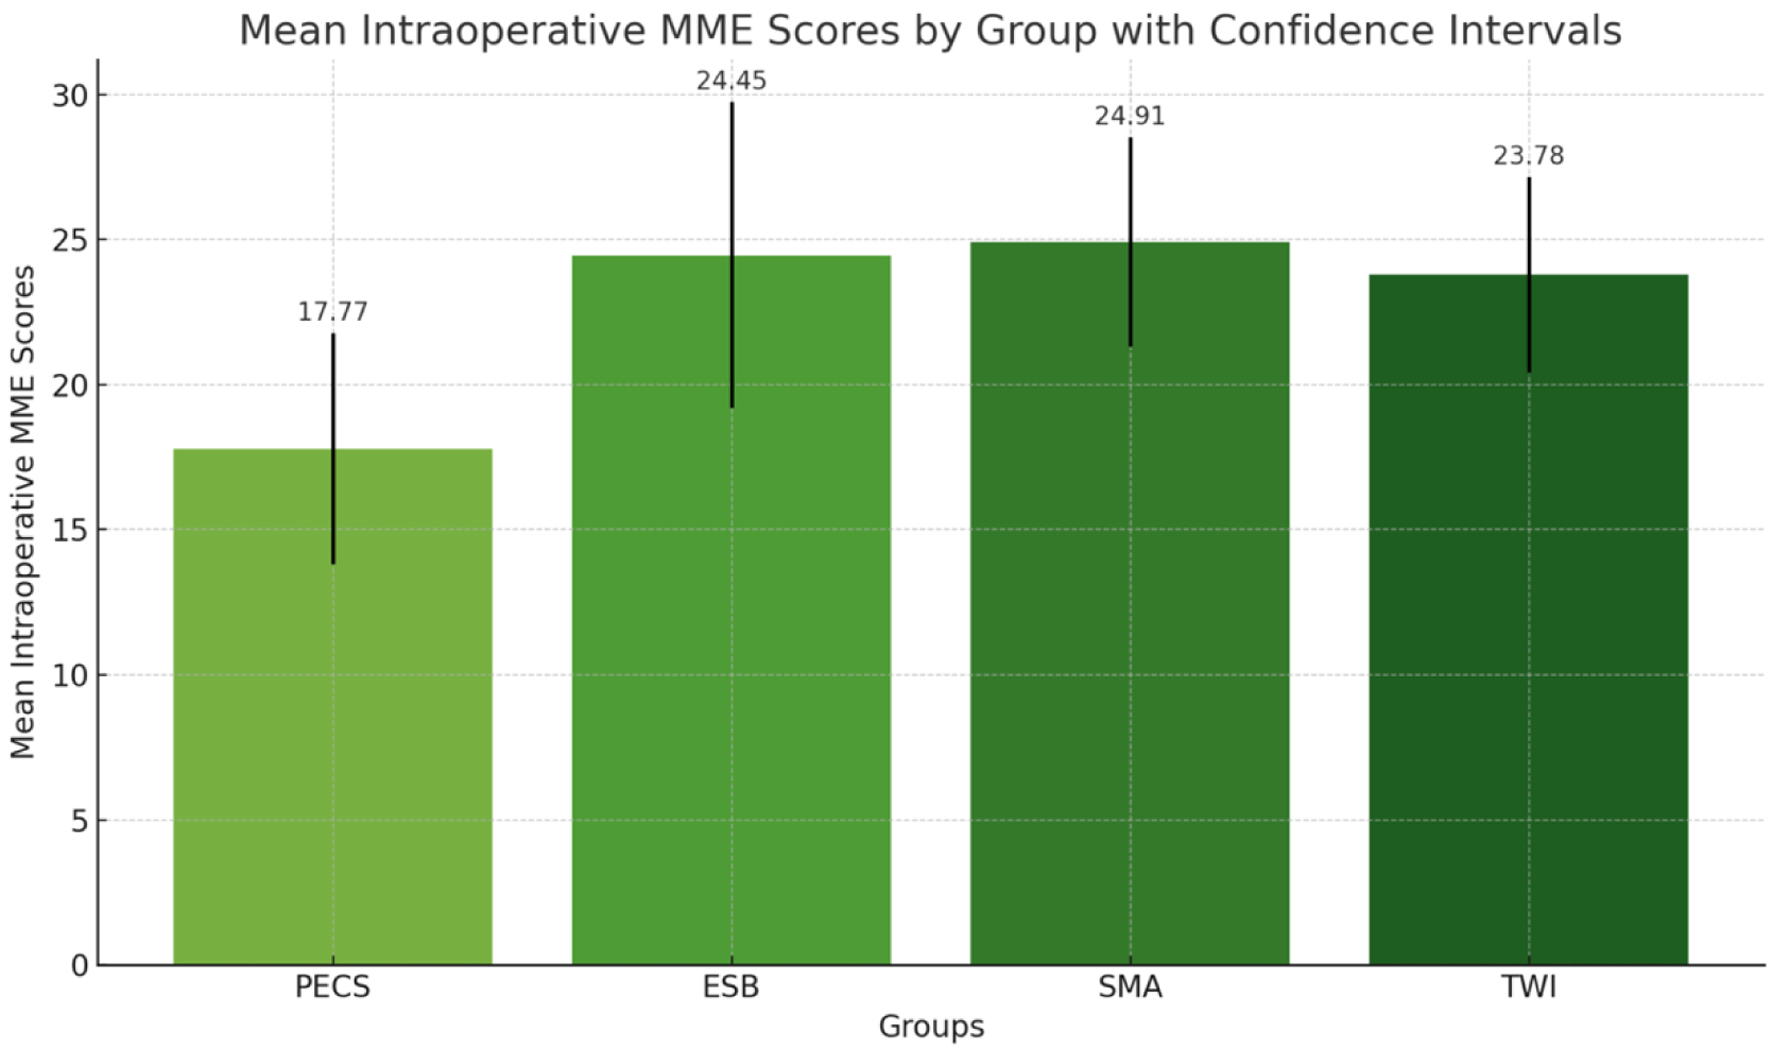
Figure 1. The mean intraoperative morphine milligram equivalent (MME) scores for each group (PECS, ESP, SMA, TWI) with 95% confidence intervals. Each bar represents the average MME score for a group, visually comparing the anesthesia requirements across the different groups. PECS: pectoral nerve; ESP: erector spinae plane; TWI: thoracic wall local anesthesia infiltration; SMA: systemic multimodal analgesia.
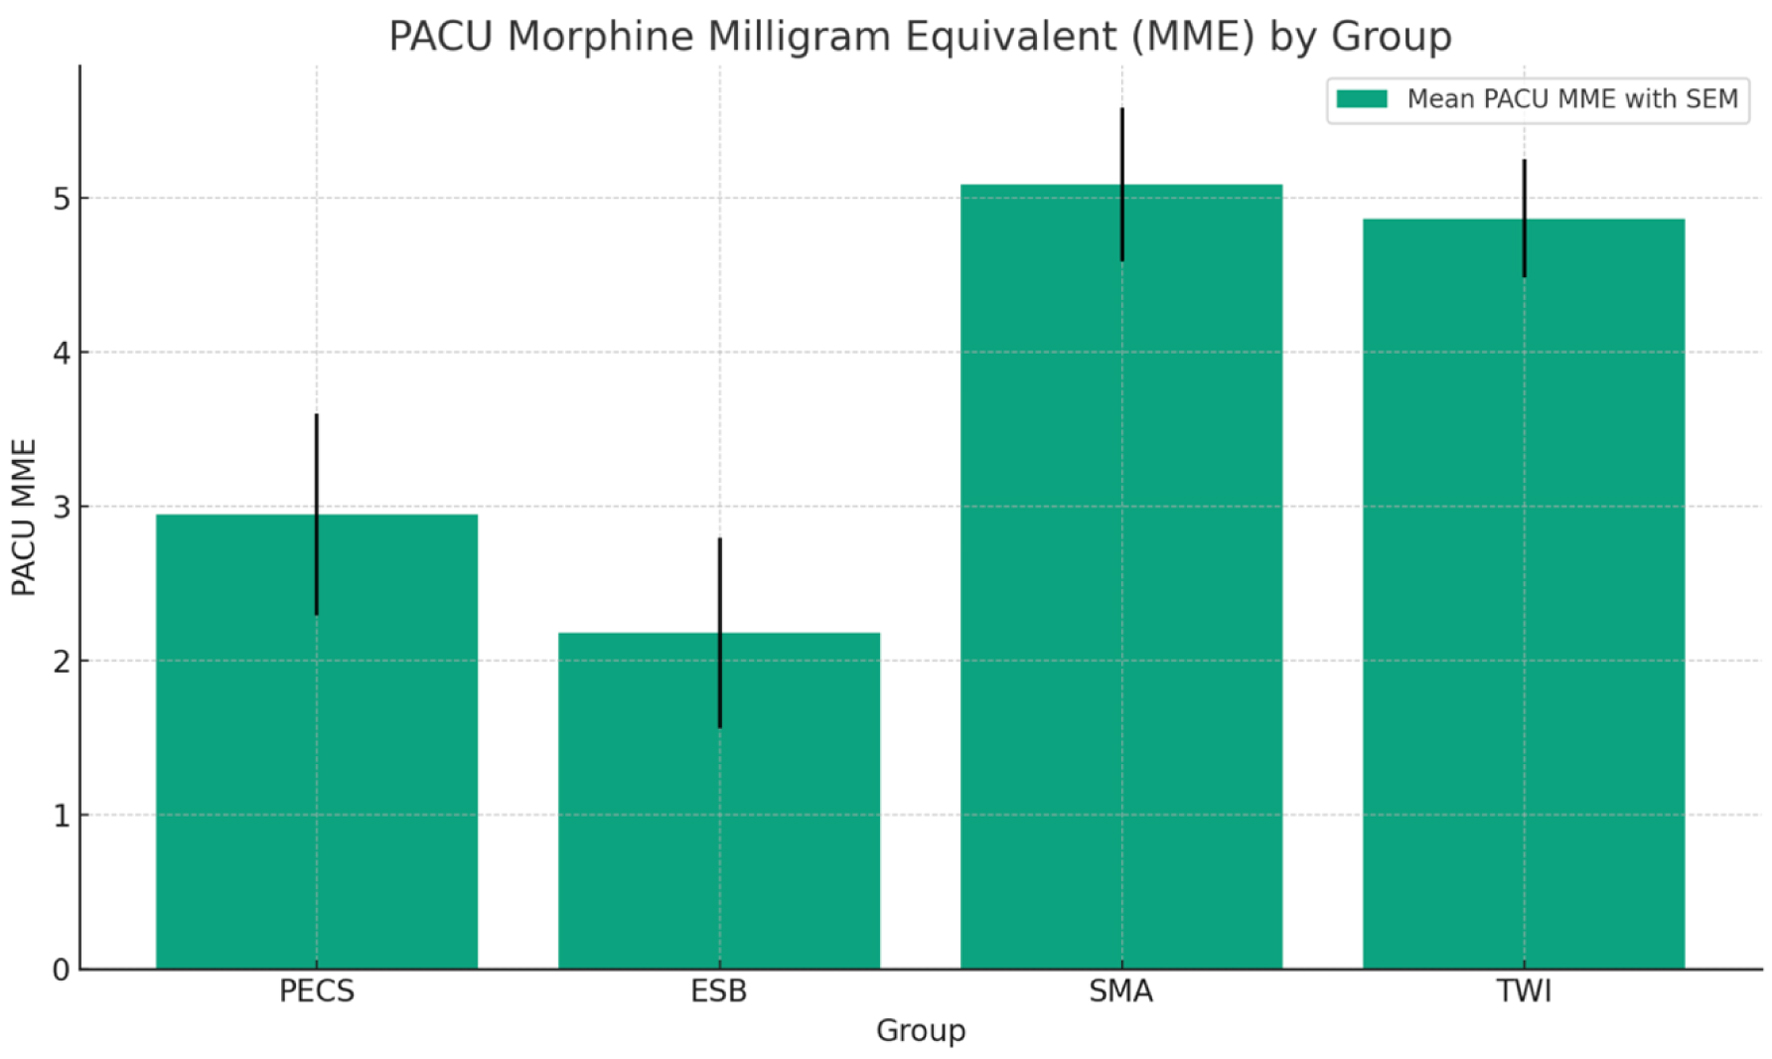
Figure 2. Bar graph representing the post-anesthesia care unit (PACU) morphine milligram equivalent (MME) for each group, complete with a legend indicating the mean PACU MME with standard error of the mean (SEM).
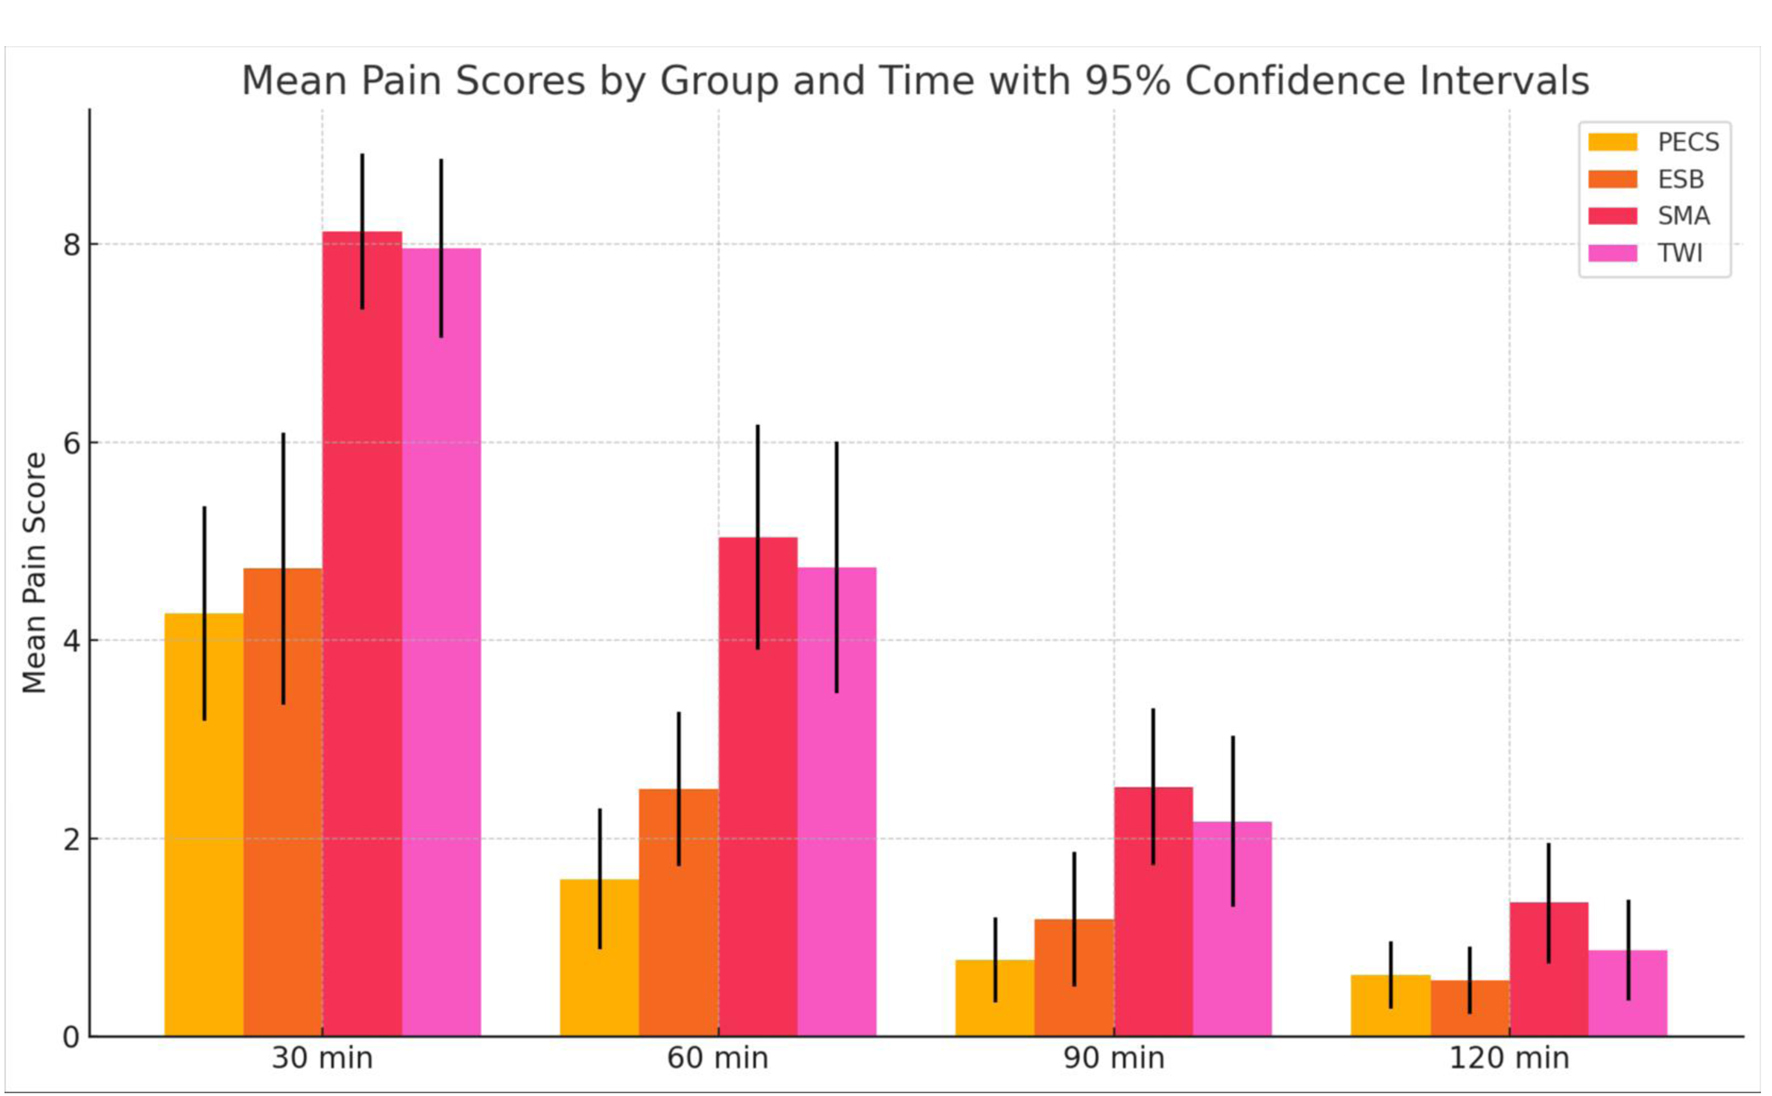
Figure 3. The mean pain scores at different time intervals (30, 60, 90, and 120 min) for each group (PECS, ESP, SMA, TWI) along with their 95% confidence intervals allowing for a direct comparison of how pain scores evolve for each treatment group. PECS: pectoral nerve; ESP: erector spinae plane; TWI: thoracic wall local anesthesia infiltration; SMA: systemic multimodal analgesia.
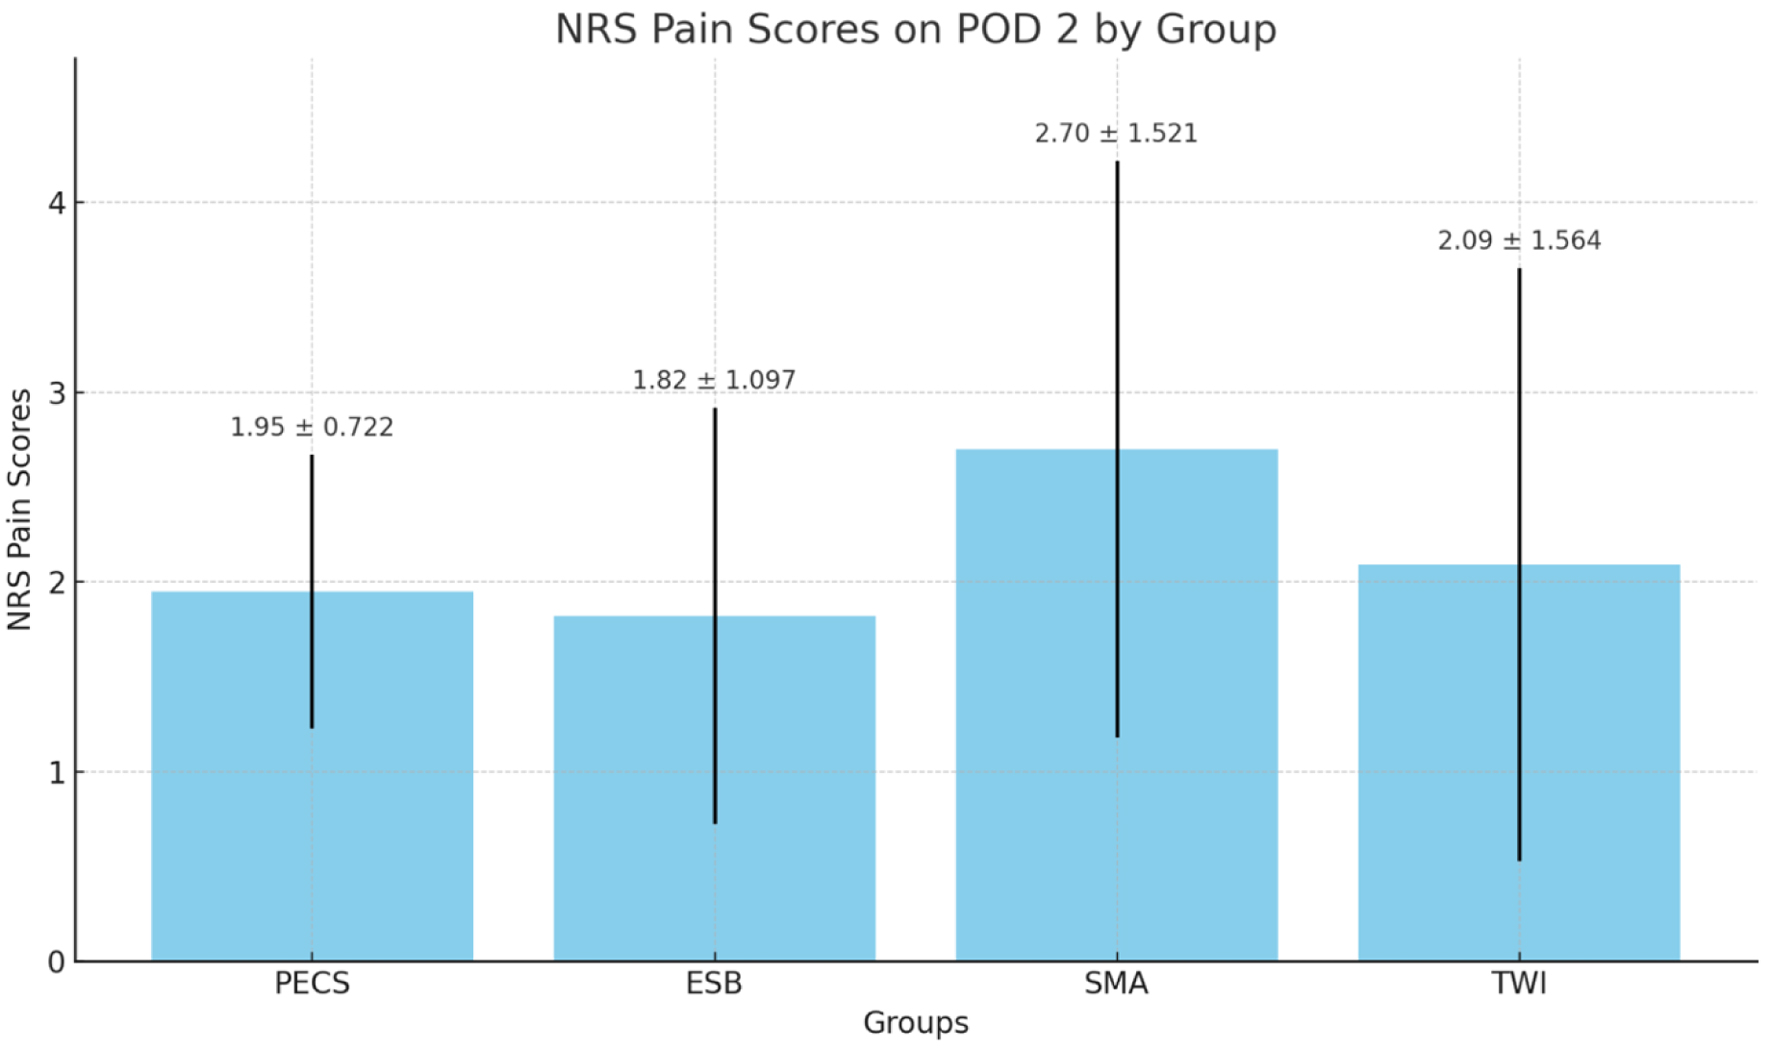
Figure 4. NRS pain scores on postoperative day 2 (POD 2) for the four groups. NRS: numeric rating scale.
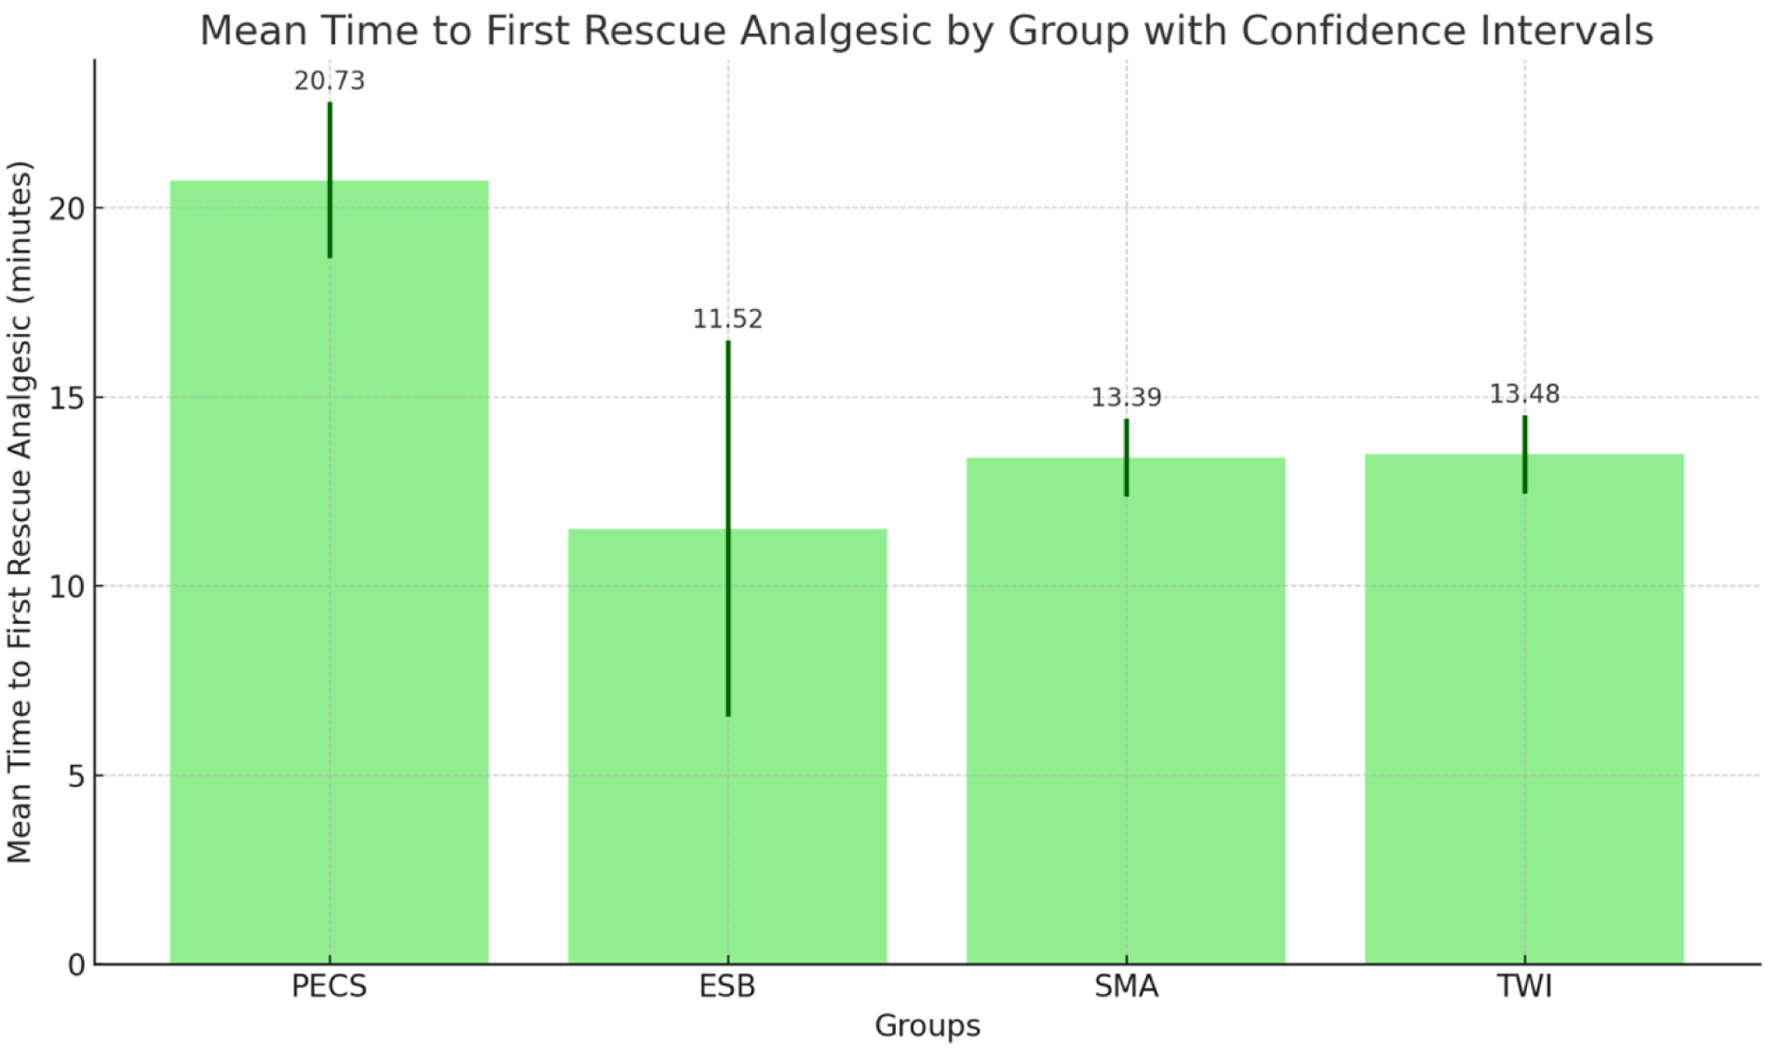
Figure 5. The mean interval between arrival to post-anesthesia care unit (PACU) and administration of first rescue dose, with error bars representing the standard deviation for each group.
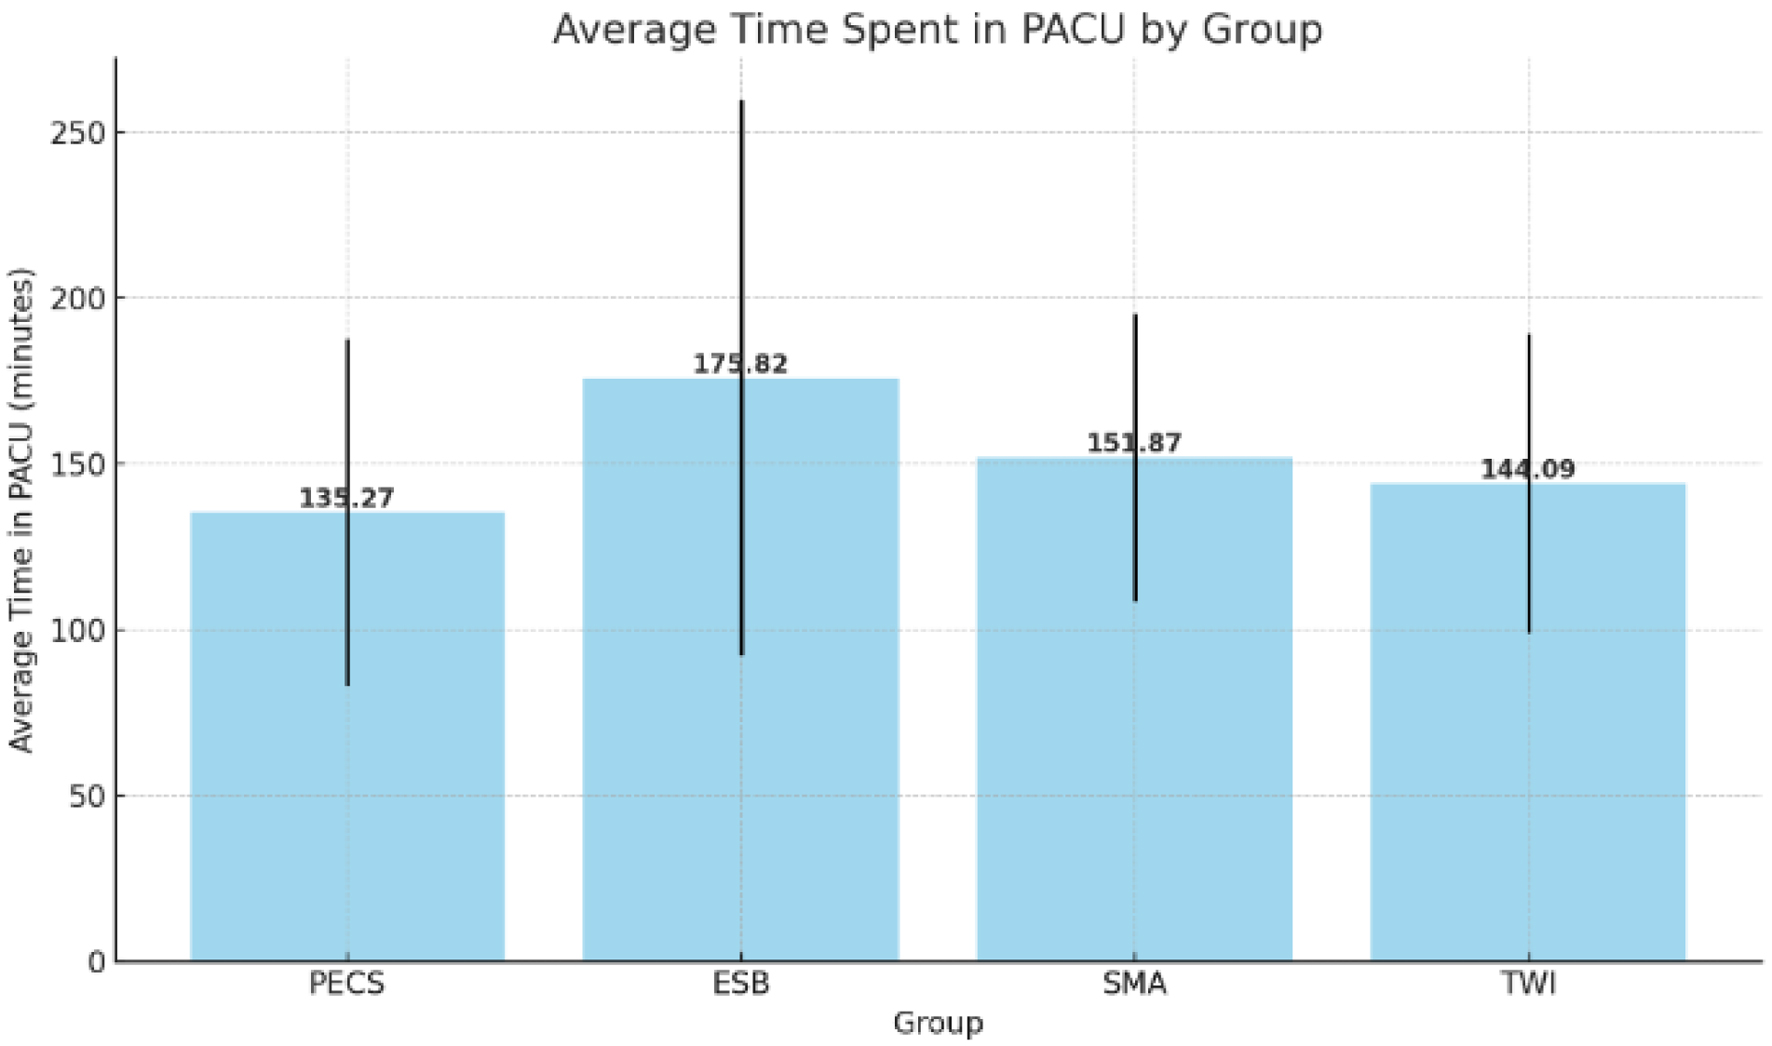
Figure 6. The average time spent in the post-anesthesia care unit (PACU) by group, with error bars representing the standard deviation for each group.
Tables
Table 1. Age Distribution of Participants by Group
| Group | N | Mean age | Standard deviation | Standard error | 95% CI | Minimum age | Maximum age |
|---|
| CI: confidence interval; PECS: pectoral nerve; ESP: erector spinae plane; TWI: thoracic wall local anesthesia infiltration; SMA: systemic multimodal analgesia. |
| PECS | 22 | 28.41 | 5.941 | 1.267 | 25.77 - 31.04 | 19 | 43 |
| ESP | 22 | 27.18 | 6.154 | 1.312 | 24.45 - 29.91 | 19 | 45 |
| SMA | 22 | 25.65 | 5.122 | 1.068 | 23.44 - 27.87 | 19 | 38 |
| TWI | 22 | 26.78 | 5.125 | 1.069 | 24.57 - 29.00 | 19 | 38 |
| Total | 88 | 26.99 | 5.588 | 0.589 | 25.82 - 28.16 | 19 | 45 |
Table 2. Mean Intraoperative MME Scores for Both Group A (T Therapy) and Group B (No T Therapy) With 95% CIs
| Group | Mean intraoperative MME (mg) | 95% CI | Number of patients |
|---|
| CIs: confidence intervals; MME: morphine milligram equivalent. |
| Group A (T therapy) | 18.45 | 16.0 - 20.9 | 54 |
| Group B (no T therapy) | 21.54 | 19.0 - 24.1 | 34 |