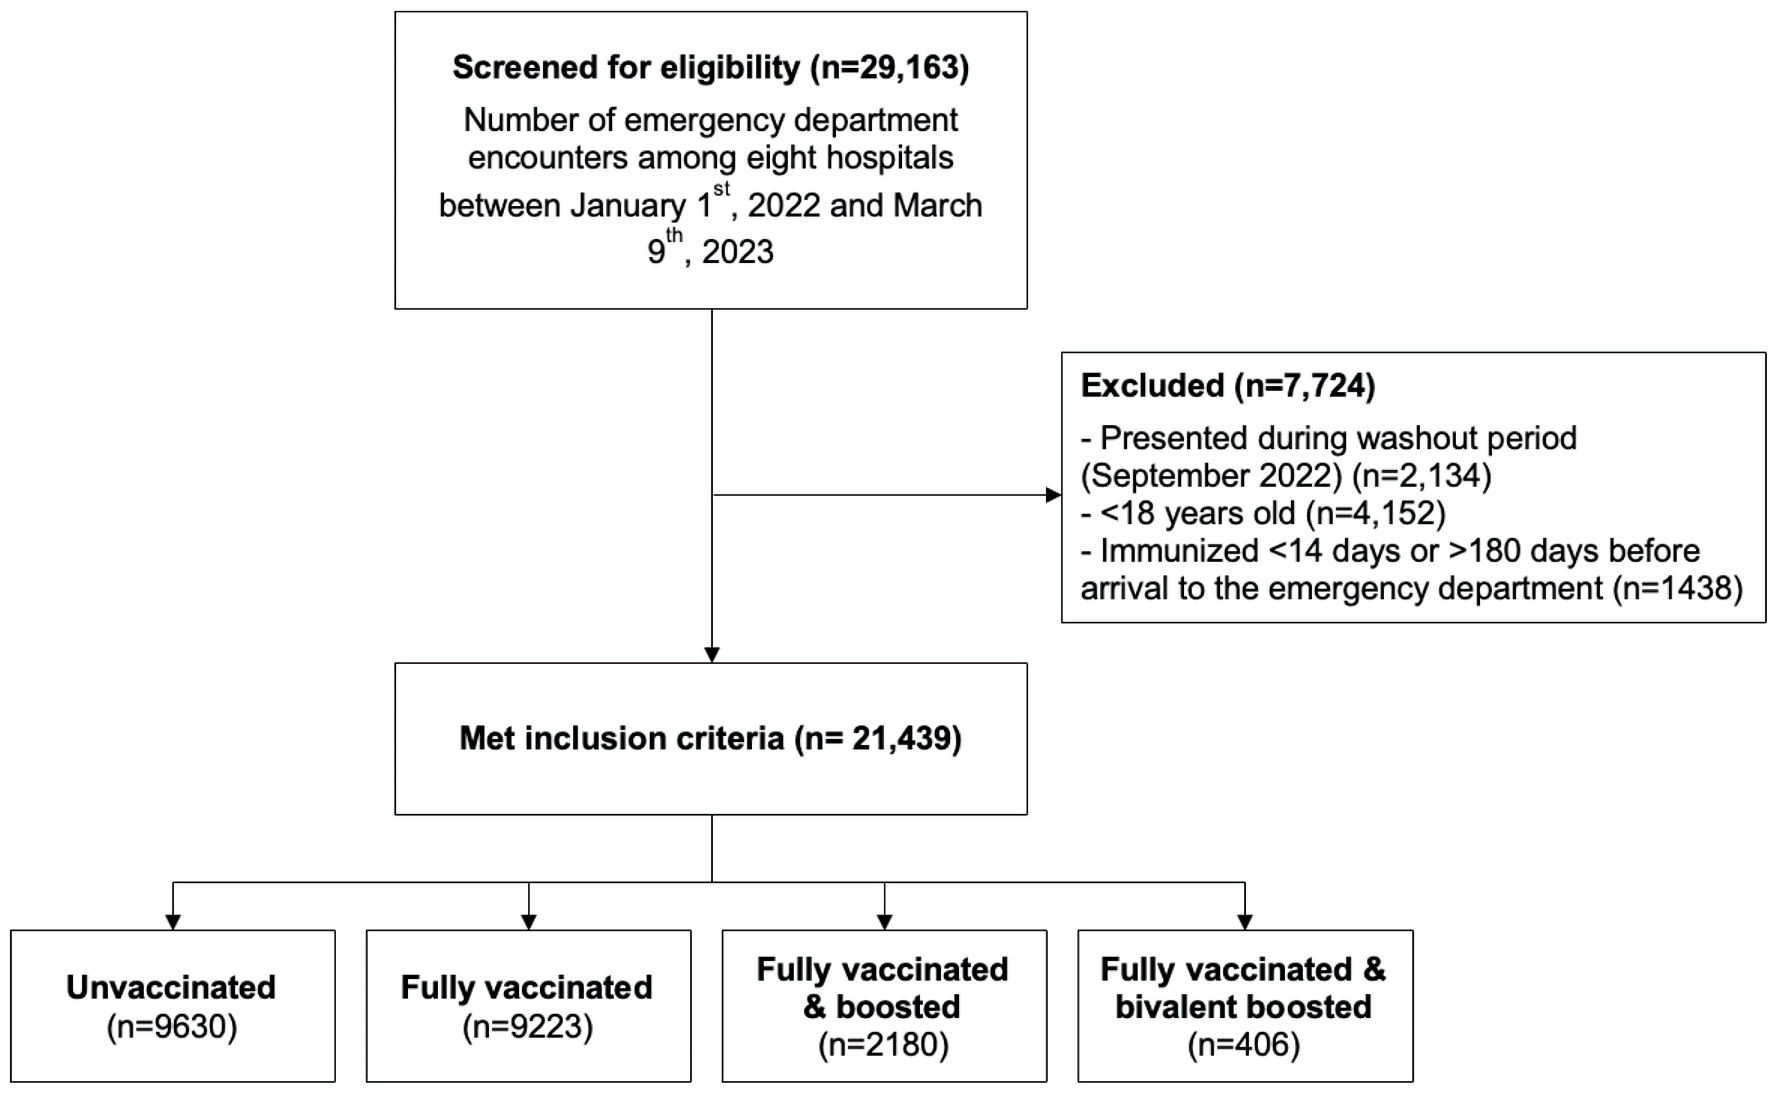
Figure 1. Flow figure of inclusion and exclusion criteria. Flow figure of encounters screened for eligibility, encounters excluded from the study, and vaccination categorization.
| Journal of Clinical Medicine Research, ISSN 1918-3003 print, 1918-3011 online, Open Access |
| Article copyright, the authors; Journal compilation copyright, J Clin Med Res and Elmer Press Inc |
| Journal website https://www.jocmr.org |
Original Article
Volume 16, Number 5, May 2024, pages 208-219
Updated Bivalent COVID-19 Vaccines Reduce Risk of Hospitalization and Severe Outcomes in Adults: An Observational Cohort Study
Figures
Tables
| Variablesa | All | Unvaccinated | Vaccinated | Boosted | Bivalent boosted | P value |
|---|---|---|---|---|---|---|
| aFor continuous variables, medians (interquartile ranges (IQRs)) and means (standard deviation (SD)) were presented. For categorical variables, frequencies (percentage) were presented. ICU: intensive care unit. | ||||||
| N | 21,439 | 9,630 (44.9%) | 9,223 (43.0%) | 2,180 (10.2%) | 406 (1.9%) | |
| Demographics | ||||||
| Age, years | ||||||
| Mean | 48.8 (26.6) | 37.8 (26.5) | 58.9 (21.3) | 66.2 (18.7) | 72.3 (14.3) | < 0.001 |
| Median | 52 (29, 71) | 35 (17, 59) | 62 (43, 76) | 70 (56, 80) | 73 (65, 82) | |
| Sex | ||||||
| Female | 12,777 (59.6) | 5,762 (59.8) | 5,562 (60.3) | 1,248 (57.2) | 205 (50.5) | < 0.001 |
| Male | 8,662 (40.4) | 3,868 (40.2) | 3,661 (39.7) | 932 (42.8) | 201 (49.5) | |
| Race | ||||||
| Black or African American | 7,034 (32.8) | 3,927 (40.8) | 2,533 (27.5) | 498 (22.8) | 76 (18.7) | < 0.001 |
| White or Caucasian | 13,109 (61.1) | 5,182 (53.8) | 6,063 (65.7) | 1,553 (71.2) | 311 (76.6) | |
| Other | 1,296 (6.0) | 521 (5.4) | 627 (6.8) | 129 (5.9) | 19 (4.7) | |
| Body mass index, kg/m2 | ||||||
| Mean | 29.5 (8.4) | 29.4 (8.9) | 29.8 (8.1) | 29.0 (7.4) | 29.0 (8.3) | < 0.001 |
| Median | 28.2 (23.6, 34) | 28.1 (23.1, 34.1) | 28.4 (24.1, 34.1) | 27.6 (23.7, 33.1) | 27.5 (23.5, 3.5) | |
| Comorbidities | ||||||
| Immunocompromised | 2,749 (12.8) | 917 (9.5) | 1,365 (14.8) | 404 (18.5) | 63 (15.5) | < 0.001 |
| Pre-existing end-stage renal disease | 694 (3.2) | 194 (2.0) | 358 (3.9) | 133 (6.1) | 9 (2.2) | < 0.001 |
| Elixhauser weighted score | ||||||
| Mean | 3.17 (3.3) | 2.2 (2.9) | 4.0 (3.5) | 4.8 (3.6) | 5.1 (3.5) | < 0.001 |
| Median | 2 (0,5) | 1 (0,3) | 3 (1,6) | 4 (2,7) | 5 (2,8) | |
| Elixhauser, category | ||||||
| 0 | 3,947 (18.4) | 2,438 (25.3) | 1,284 (13.9) | 202 (9.3) | 23 (5.7) | < 0.001 |
| 1 to 2 | 6,192 (28.9) | 3,192 (33.1) | 2,425 (26.3) | 481 (22.1) | 94 (23.2) | |
| 3 to 4 | 4,279 (20.0) | 1,744 (18.1) | 1,968 (21.3) | 486 (22.3) | 81 (20.0) | |
| ≥ 5 | 7,021 (32.7) | 2,256 (23.4) | 3,546 (38.4) | 1,011 (46.4) | 208 (51.2) | |
| Initial vital signs | ||||||
| Respiratory rate, breaths per minute | ||||||
| < 30 | 21,041 (98.2) | 9,467 (98.4) | 9,042 (98.1) | 2,134 (97.9) | 398 (98.0) | 0.282 |
| ≥ 30 | 381 (1.8) | 153 (1.6) | 175 (1.9) | 45 (2.1) | 8 (2.0) | |
| Pulse, beats per minute | ||||||
| < 90 | 10,451 (48.8) | 4,304 (44.7) | 4,656 (50.5) | 1,237 (56.8) | 254 (62.6) | < 0.001 |
| ≥ 90 | 10,976 (51.2) | 5,318 (55.3) | 4,564 (49.5) | 942 (43.2) | 152 (37.4) | |
| Systolic blood pressure, mm Hg | ||||||
| < 90 | 261 (1.2) | 87 (0.9) | 127 (1.4) | 42 (1.9) | 5 (1.2) | < 0.001 |
| ≥ 90 | 21,161 (98.8) | 9,533 (99.1) | 9,090 (98.6) | 2,137 (98.1) | 401 (98.8) | |
| Temperature, °C | ||||||
| < 36 | 442 (2.1) | 159 (1.7) | 229 (2.5) | 48 (2.2) | 6 (1.5) | < 0.001 |
| 36 - 38 | 19,033 (89.0) | 8,502 (88.4) | 8,177 (88.9) | 1,991 (91.5) | 363 (89.6) | |
| > 38 | 1,921 (9.0) | 952 (9.9) | 796 (8.7) | 137 (6.3) | 36 (8.9) | |
| Blood oxygen saturation, % | ||||||
| < 90 | 588 (2.7) | 277 (2.9) | 247 (2.7) | 56 (2.6) | 8 (2.0) | 0.582 |
| ≥ 90 | 20,836 (97.3) | 9,345 (97.1) | 8,970 (97.3) | 2,123 (97.4) | 398 (98.0) | |
| In-hospital therapies | ||||||
| O2 therapy | 5,618 (26.2) | 2,131 (22.1) | 2,623 (28.4) | 713 (32.7) | 151 (37.2) | < 0.001 |
| Nasal cannula/non-rebreather | 4,008 (18.7) | 1,463 (15.2) | 1,922 (20.8) | 506 (23.2) | 117 (28.8) | < 0.001 |
| High-flow O2 | 556 (2.6) | 255 (2.6) | 231 (2.5) | 57 (2.6) | 13 (3.2) | 0.801 |
| Non-mechanical ventilation | 593 (2.8) | 211 (2.2) | 276 (3.0) | 94 (4.3) | 12 (3.0) | < 0.001 |
| Vasopressor | 598 (2.8) | 230 (2.4) | 269 (2.9) | 84 (3.9) | 15 (3.7) | 0.001 |
| Primary outcome | ||||||
| Composite severe disease | 1,178 (5.5) | 477 (5.0) | 530 (5.7) | 152 (7.0) | 19 (4.7) | 0.001 |
| ICU-level care | 1,015 (4.7) | 405 (4.2) | 453 (4.9) | 139 (6.4) | 18 (4.4) | < 0.001 |
| Mechanical ventilation | 461 (2.2) | 202 (2.1) | 194 (2.1) | 56 (2.6) | 9 (2.2) | 0.563 |
| Death | 416 (1.9) | 178 (1.8) | 183 (2.0) | 48 (2.2) | 7 (1.7) | 0.705 |
| Secondary outcomes | ||||||
| Hospital admission | 9,390 (43.8) | 3,543 (36.8) | 4,366 (47.3) | 1,246 (57.2) | 235 (57.9) | < 0.001 |
| Length of stay, h | ||||||
| Mean | 172.1 (170.0) | 183.0 (176.2) | 167.3 (170.0) | 171.2 (164.3) | 147.0 (128.7) | < 0.001 |
| Median | 122 (72, 212) | 127, (76, 233) | 121 (71, 200) | 121 (71, 216) | 101 (64, 171) | |
| Variablesa | All | Unvaccinated | Vaccinated | Boosted | Bivalent boosted | P value |
|---|---|---|---|---|---|---|
| aFor continuous variables, medians (interquartile ranges (IQRs)) and means (standard deviation (SD)) were presented. For categorical variables, frequencies (percentage) were presented. ICU: intensive care unit. | ||||||
| N | 9,390 | 3,543 (37.7%) | 4,366 (46.5%) | 1,246 (13.3%) | 235 (2.5%) | |
| Demographics | ||||||
| Age, years | ||||||
| Mean | 67.9 (17.5) | 63.0 (18.9) | 70.0 (16.3) | 72.7 (15.0) | 76.6 (11.8) | < 0.001 |
| Median | 71 (58, 81) | 65 (50, 78) | 72 (61, 82) | 74 (65, 84) | 78 (69, 85) | |
| Sex | ||||||
| Female | 5,101 (54.3) | 1,968 (55.5) | 2,359 (54.0) | 662 (53.1) | 112 (47.7) | 0.066 |
| Male | 4,289 (45.7) | 1,575 (44.5) | 2,007 (46.0) | 584 (46.9) | 123 (52.3) | |
| Race | ||||||
| Black or African American | 2,325 (24.8) | 1,062 (30.0) | 965 (22.1) | 255 (20.5) | 43 (18.3) | < 0.001 |
| White or Caucasian | 6,567 (69.9) | 2,313 (65.3) | 3,147 (72.1) | 927 (74.4) | 180 (76.6) | |
| Other | 498 (5.3) | 168 (4.7) | 254 (5.8) | 64 (5.1) | 12 (5.1) | |
| Body mass index, kg/m2 | ||||||
| Mean | 29.1 (8.4) | 29.6 (8.9) | 29.0 (8.3) | 28.4 (7.3) | 28.2 (7.8) | < 0.004 |
| Median | 27.5 (23.4, 33.3) | 27.9 (23.4, 34) | 27.5 (23.4, 33.1) | 27.1 (23.3, 32.4) | 26.6 (22.9, 32.1) | |
| Comorbidities | ||||||
| Immunocompromised | 1,922 (20.5) | 608 (17.2) | 977 (22.4) | 292 (23.4) | 45 (19.1) | < 0.001 |
| Pre-existing end-stage renal disease | 583 (6.2) | 165 (4.7) | 299 (6.8) | 110 (8.8) | 9 (3.8) | < 0.001 |
| Elixhauser weighted score | ||||||
| Mean | 5.2 (3.7) | 4.4 (3.6) | 5.6 (3.6) | 5.8 (3.7) | 5.9 (3.6) | < 0.001 |
| Median | 5 (2,8) | 4 (2,7) | 5 (3,8) | 6 (3,9) | 6 (3,9) | |
| Elixhauser, category | ||||||
| 0 | 852 (9.1) | 464 (13.1) | 296 (6.8) | 77 (6.2) | 15 (6.4) | < 0.001 |
| 1 to 2 | 1,821 (19.4) | 850 (24.0) | 751 (17.2) | 184 (14.8) | 36 (15.3) | |
| 3 to 4 | 1,829 (19.5) | 693 (19.6) | 849 (19.4) | 247 (19.8) | 40 (17.0) | |
| ≥ 5 | 4,888 (52.1) | 1,536 (43.4) | 2,470 (56.6) | 738 (59.2) | 144 (61.3) | |
| Initial vital signs | ||||||
| Respiratory rate, breaths per minute | ||||||
| < 30 | 9,037 (96.3) | 3,398 (95.9) | 4,209 (96.4) | 1,203 (96.5) | 227 (96.6) | 0.648 |
| ≥ 30 | 352 (3.7) | 144 (4.1) | 157 (3.6) | 43 (3.5) | 8 (3.4) | |
| Pulse, beats per minute | ||||||
| < 90 | 4,849 (51.6) | 1,649 (46.6) | 2,325 (53.3) | 727 (58.3) | 148 (63.0) | < 0.001 |
| ≥ 90 | 4,540 (48.4) | 1,893 (53.4) | 2,041 (46.7) | 519 (41.7) | 87 (37.0) | |
| Systolic blood pressure, mm Hg | ||||||
| < 90 | 233 (2.5) | 69 (1.9) | 118 (2.7) | 41 (3.3) | 5 (2.1) | 0.036 |
| ≥ 90 | 9,155 (97.5) | 3,473 (98.1) | 4,247 (97.3) | 1,205 (96.7) | 230 (97.9) | |
| Temperature, °C | ||||||
| < 36 | 283 (3.0) | 97 (2.7) | 150 (3.4) | 31 (2.5) | 5 (2.1) | 0.016 |
| 36 - 38 | 8,257 (88.0) | 3,097 (87.5) | 3,833 (87.8) | 1,125 (90.3) | 202 (86.0) | |
| > 38 | 847 (9.0) | 347 (9.8) | 382 (8.8) | 90 (7.2) | 28 (11.9) | |
| Blood O2 saturation, % | ||||||
| < 90 | 554 (5.9) | 264 (7.5) | 227 (5.2) | 55 (4.4) | 8 (3.4) | < 0.001 |
| ≥ 90 | 8,835 (94.1) | 3,278 (92.5) | 4,139 (94.8) | 1,191 (95.6) | 227 (96.6) | |
| In-hospital therapies | ||||||
| O2 therapy | 5,329 (56.8) | 2,016 (56.9) | 2,482 (56.8) | 691 (55.5) | 140 (59.6) | 0.645 |
| Nasal cannula/non-rebreather | 3,727 (39.7) | 1,353 (38.2) | 1,784 (40.9) | 484 (38.8) | 106 (45.1) | 0.028 |
| High-flow O2 | 556 (5.9) | 255 (7.2) | 231 (5.3) | 57 (4.6) | 13 (5.5) | < 0.001 |
| Non-mechanical ventilation | 588 (6.3) | 207 (5.8) | 275 (6.3) | 94 (7.5) | 12 (5.1) | 0.165 |
| Vasopressor | 592 (6.3) | 228 (6.4) | 265 (6.1) | 84 (6.7) | 15 (6.4) | 0.822 |
| Primary outcome | ||||||
| Composite severe disease | 1,164 (12.4) | 472 (13.3) | 521 (11.9) | 152 (12.2) | 19 (8.1) | 0.052 |
| ICU-level care | 1,015 (10.8) | 405 (11.4) | 453 (10.4) | 139 (11.2) | 18 (7.7) | 0.183 |
| Mechanical ventilation | 458 (4.9) | 201 (5.7) | 192 (4.4) | 56 (4.5) | 9 (3.8) | 0.047 |
| Death | 404 (4.3) | 174 (4.9) | 175 (4.0) | 48 (3.9) | 7 (3.0) | 0.126 |