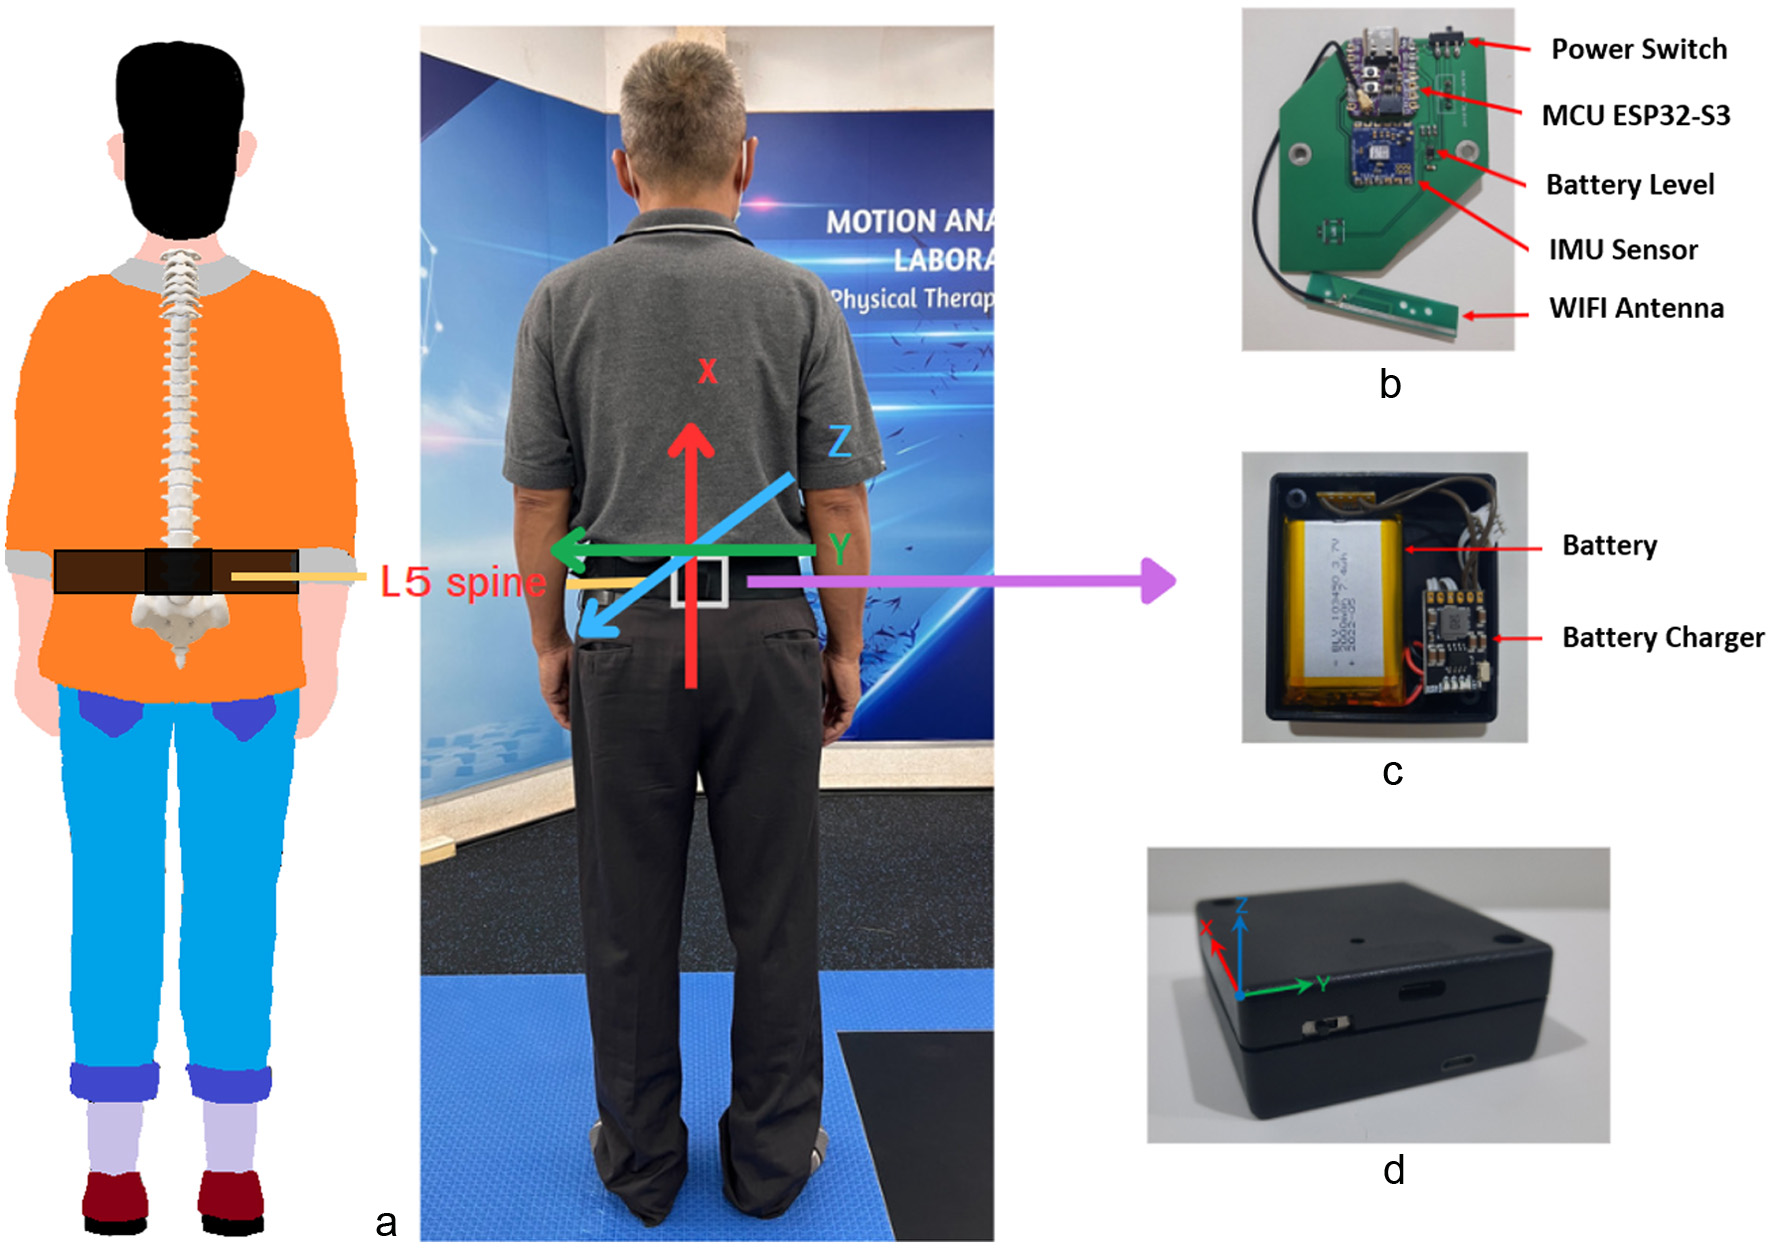
Figure 1. A prototype of the inertial sensor system. (a) Sensor placement in relation to the center of mass (COM) at the L5 vertebra in the lumbar region. (b, c) Subcomponents of the inertial measurement unit (IMU). (d) An assembled IMU.
| Journal of Clinical Medicine Research, ISSN 1918-3003 print, 1918-3011 online, Open Access |
| Article copyright, the authors; Journal compilation copyright, J Clin Med Res and Elmer Press Inc |
| Journal website https://www.jocmr.org |
Short Communication
Volume 16, Number 4, April 2024, pages 174-181
Feasibility Study of a Prototype Wearable Inertial Measurement Unit for Elderly Postural Sway Assessment
Figures
Tables
| Description | Potential risk (n = 68) | Non-risk (n = 35) | P value | ||
|---|---|---|---|---|---|
| Mean (SD) | Min/Max | Mean (SD) | Min/ Max | ||
| *Significant difference at P < 0.05. BMI: body mass index; SPPB: Short Physical Performance Battery; Thai-FRT: fall risk assessment test, Thai version; Min: minimum; Max: maximum. | |||||
| Age (year) | 68.5 (5.64) | 60/87 | 68.4 (5.80) | 60/84 | 0.66 |
| Weight (kg) | 56.41 (11.25) | 29/85 | 54.14 (10.12) | 30/72 | 0.32 |
| Height (cm) | 155.76 (7.71) | 137/175 | 156.03 (7.74) | 138/170 | 0.87 |
| BMI (kg/m2) | 23.24 (4.29) | 33.20/12.23 | 22.25 (4.07) | 13.33/30.22 | 0.32 |
| Gait speed (m/s) | 0.81 (0.14) | 0.34/0.99 | 1.13 (0.11) | 1/1.51 | < 0.001* |
| SPPB | 10.84 (1.31) | 6/12 | 11.91 (0.28) | 11/12 | < 0.001* |
| Thai-FRT | 2.37 (1.65) | 0/8 | 1.80 (1.08) | 0/5 | 0.04* |
| Variable | ST | S-TD | TD | OLS | ||||
|---|---|---|---|---|---|---|---|---|
| Mean ± standard deviation | Max/Min | Mean ± standard deviation | Max/Min | Mean ± standard deviation | Max/Min | Mean ± standard deviation | Max/Min | |
| aCompared with ST, significant difference at P value < 0.001 (pairwise Mann-Whitney tests). bCompared with S-TD, significant difference at P value < 0.001 (pairwise Mann-Whitney tests). cCompared with TD, significant difference at P value < 0.001 (pairwise Mann-Whitney tests). IMU: inertial measurement unit; ST: standing stance with arms at sides; S-TD: semi-tandem stance; TD: tandem stance; OLS: one-leg standing; RMS: root mean square of magnitude; Range: summation of the range of signals; SA: summation of the sway area; SD: summation of distance. | ||||||||
| RMS (degree/s) | 1.436 ± 1.15 | 9.998/0.616 | 1.769 ± 1.10a | 6.315/0.733 | 2.630 ± 1.94b | 12.732/0.876 | 5.193 ± 5.53c | 39.025/1.509 |
| Range (degree/s) | 3.534 ± 3.84 | 28.973/1.060 | 4.619 ± 4.41a | 24.153/1.178 | 6.704 ± 5.93b | 38.338/1.609 | 13.256 ± 17.88c | 117.180/2.379 |
| SA (degree) | 10.756 ± 7.59 | 69.918/2.030 | 12.999 ± 6.96a | 47.220/2.113 | 19.334 ± 12.95b | 82.514/7.122 | 33.940 ± 25.06c | 168.009/3.290 |
| SD (degree) | 62.867 ± 47.69 | 470.535/30.824 | 82.572 ± 44.54a | 297.023/28.664 | 130.218 ± 88.56b | 573.348/42.351 | 216.006 ± 168.29c | 1,186.118/18.933 |
| Variable | SBS, mean (standard deviation) | STD, mean (standard deviation) | TD, mean (standard deviation) | OLS, mean (standard deviation) | ||||||||
|---|---|---|---|---|---|---|---|---|---|---|---|---|
| Data | P value | Data | P value | Data | P value | Data | P value | |||||
| Risk | Non-risk | Risk | Non-risk | Risk | Non risk | Risk | Non-risk | |||||
| *Significant difference at P value < 0.001, Mann-Whitney U tests. IMU: inertial measurement unit; ST: standing stance with arms at sides; S-TD: semi-tandem stance; TD: tandem stance; OLS: one-leg standing; RMS: root mean square of magnitude; Range: summation of the range of signals; SA: summation of the sway area; SD: summation of distance. | ||||||||||||
| RMS (degree/s) | 1.44 (1.15) | 1.77 (1.10) | 2.63 (1.94) | 5.19 (5.53) | ||||||||
| 1.53 (1.31) | 1.25 (0.73) | 0.19 | 1.94 (1.20) | 1.44 (0.80) | 0.01* | 2.89 (2.23) | 2.13 (1.03) | 0.08 | 5.17 (4.30) | 5.24 (7.43) | > 0.05 | |
| Range (degree/s) | 3.53 (3.84) | 4.62 (4.41) | 6.70 (5.93) | 13.26 (17.88) | ||||||||
| 3.89 (4.41) | 2.84 (2.26) | 0.33 | 5.09 (4.64) | 3.70 (3.82) | 0.04* | 7.45 (6.85) | 5.26 (3.17) | 0.11 | 13.39 (14.04) | 12.99 (23.89) | 0.03* | |
| SA (degree) | 10.76 (7.58) | 13.00 (6.96) | 19.33 (12.95) | 33.94 (25.06) | ||||||||
| 11.39 (8.79) | 9.52 (4.25) | 0.23 | 14.22 (7.75) | 10.63 (4.26) | 0.01* | 21.01 (14.79) | 16.08 (7.45) | 0.07 | 34.53 (20.36) | 32.79 (32.63) | 0.04* | |
| SD (degree) | 62.87 (47.69) | 82.57 (44.54) | 130.22 (88.56) | 216.01 (168.29) | ||||||||
| 67.05 (1.20) | 54.73 (18.02) | 0.36 | 89.02 (50.93) | 70.04 (24.38) | 0.11 | 139.18 (101.86) | 112.81 (51.11) | 0.41 | 215.94 (128.23) | 216.14 (229.27) | 0.11 | |