Journal of Clinical Medicine Research, ISSN 1918-3003 print, 1918-3011 online, Open Access
Article copyright, the authors; Journal compilation copyright, J Clin Med Res and Elmer Press Inc
Journal website https://www.jocmr.org

Original Research

Volume 16, Number 2-3, March 2024, pages 94-105


Barriers to Exercise in Patients With Metabolic Dysfunction-Associated Steatotic Liver Disease: A Patient Survey

Figures

Figure 1.
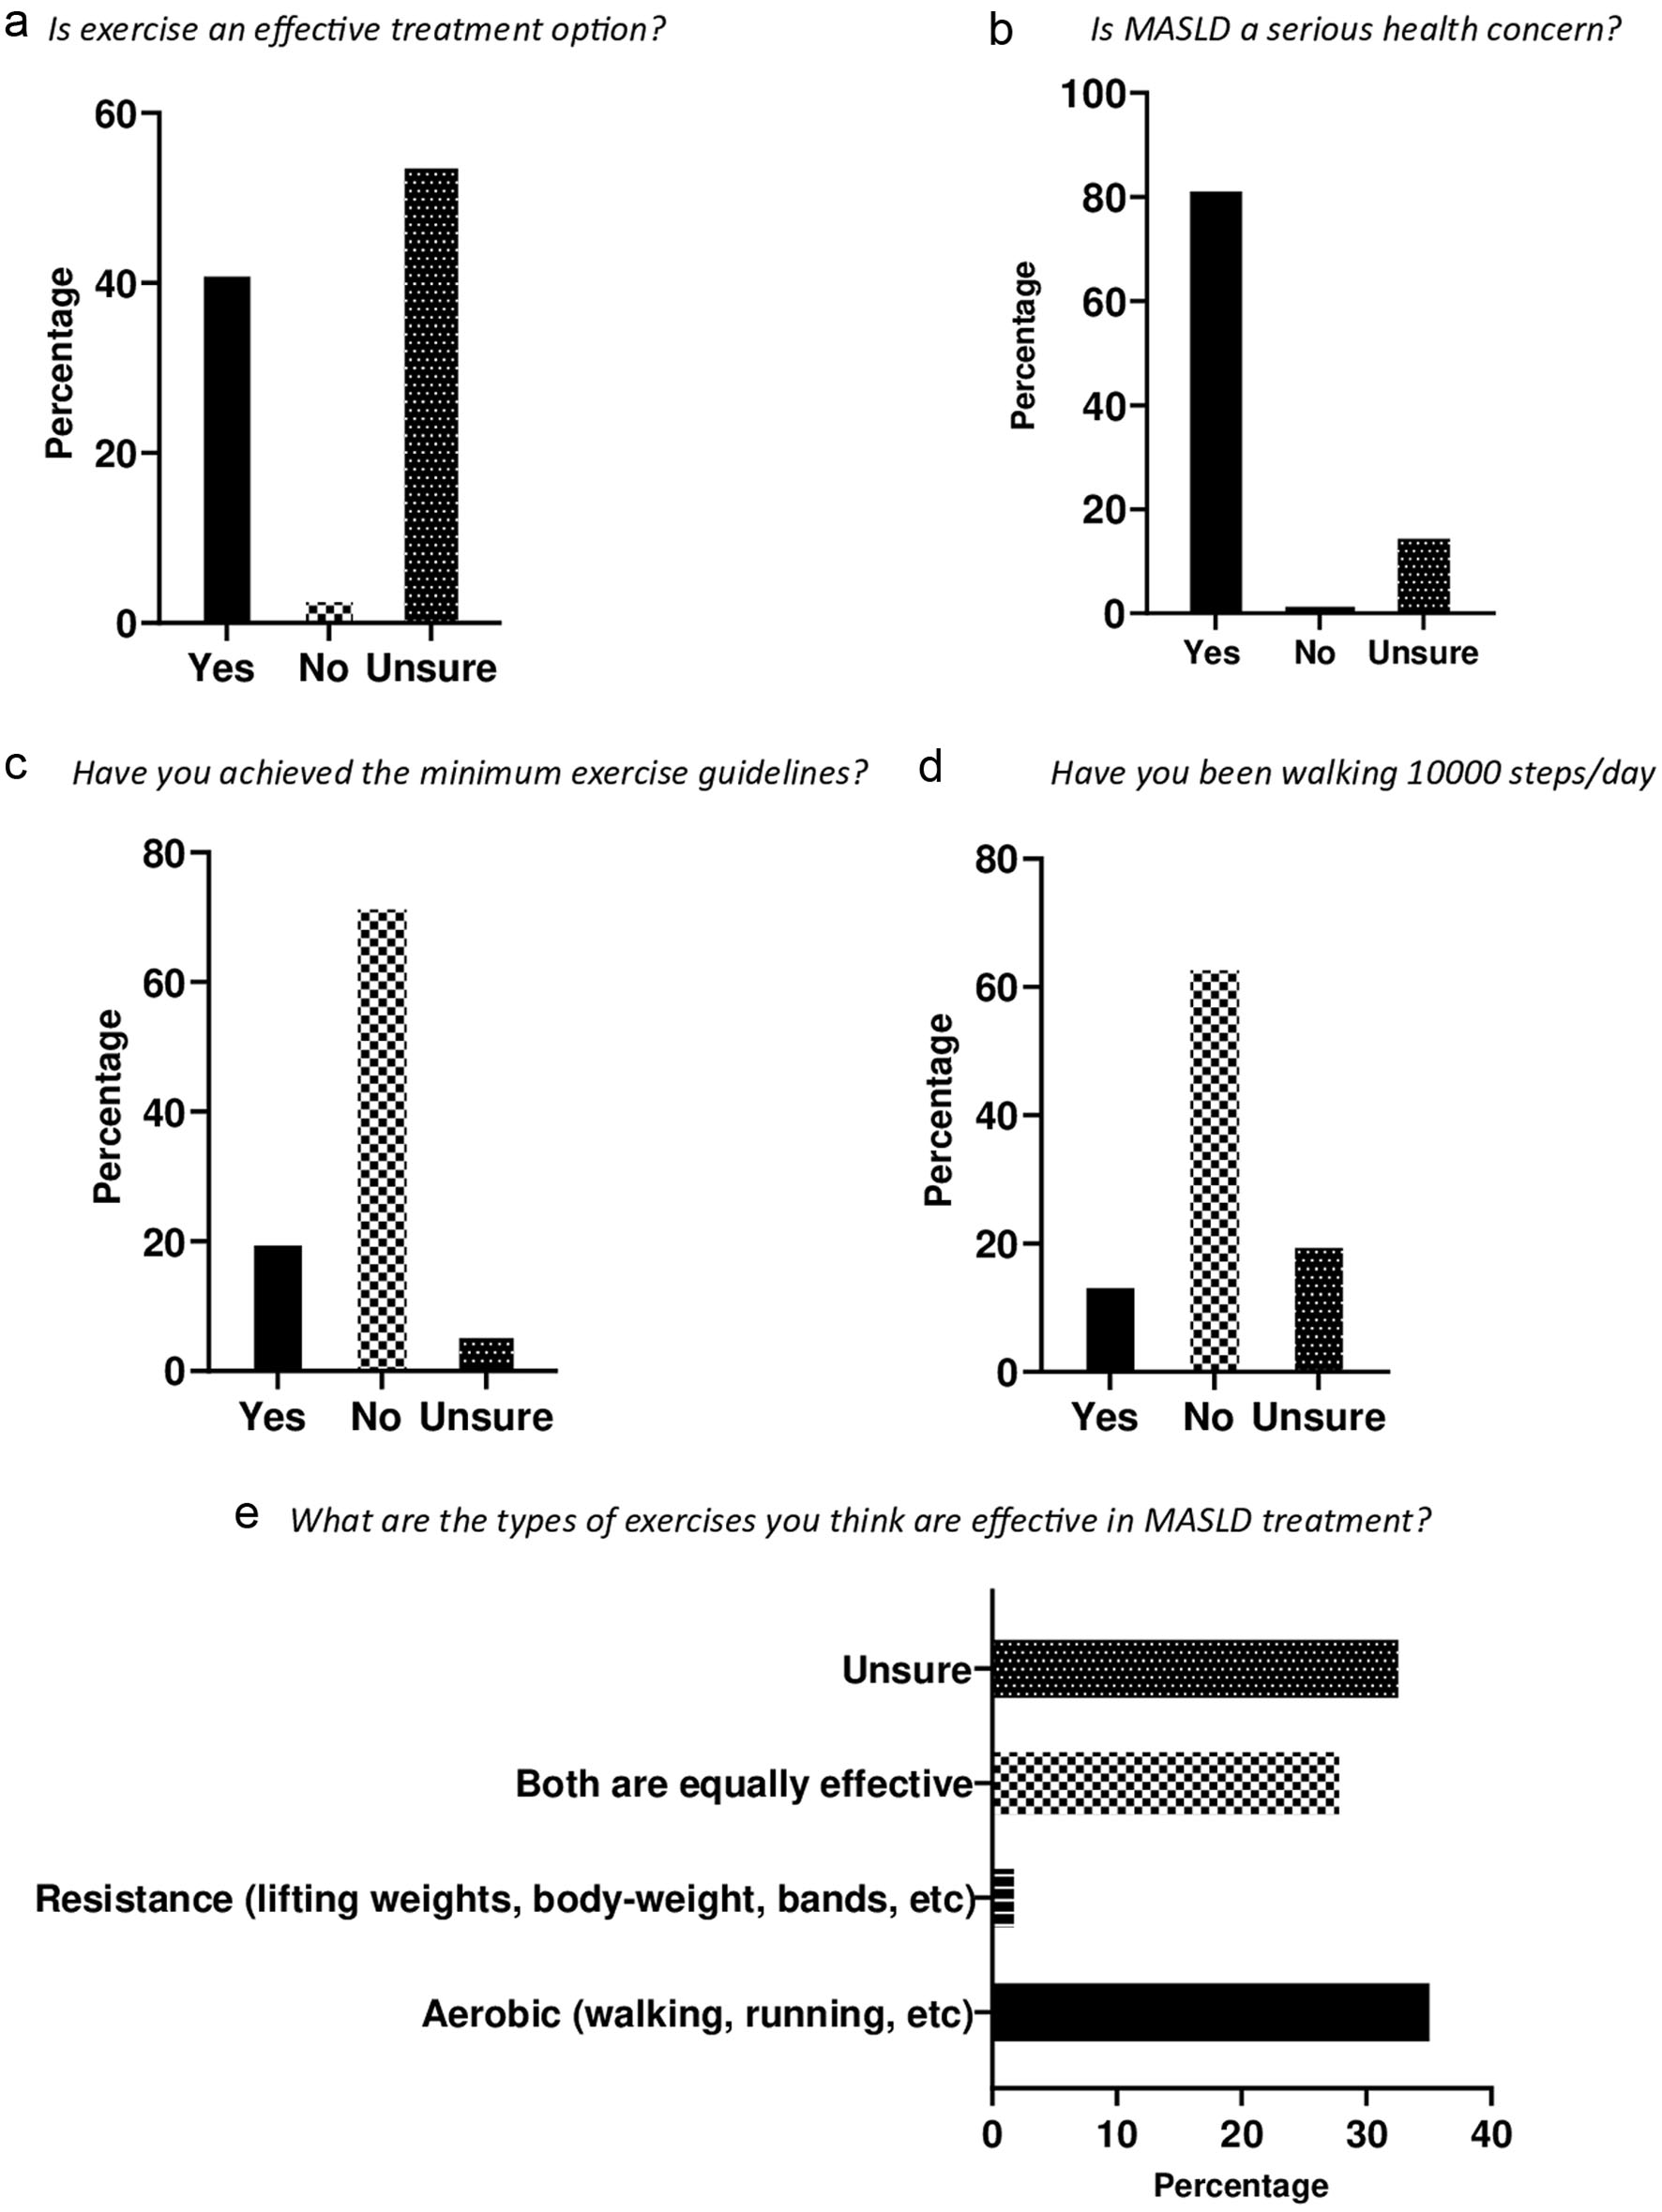
Figure 1. Perceptions, awareness and exercise behaviors. (a) More than half (54%) of the participants were unsure about exercise as a therapeutic option for MASLD. (b) Majority of the participants (83%) agreed that fatty liver is a serious health concern. (c) Majority of the participants (73%) did not achieve the recommended exercise guidelines. (d) Sixty-four percent of the participants did not walk at least 10,000 steps per day. (e) Aerobic exercise was picked as the most effective exercise (36%), and 28% thought that both aerobic and resistance exercise were effective in MASLD therapy. However, a noteworthy proportion (36%) were unsure about the optimal exercise type for MASLD therapy. MASLD: metabolic dysfunction-associated steatotic liver disease.
Figure 2.
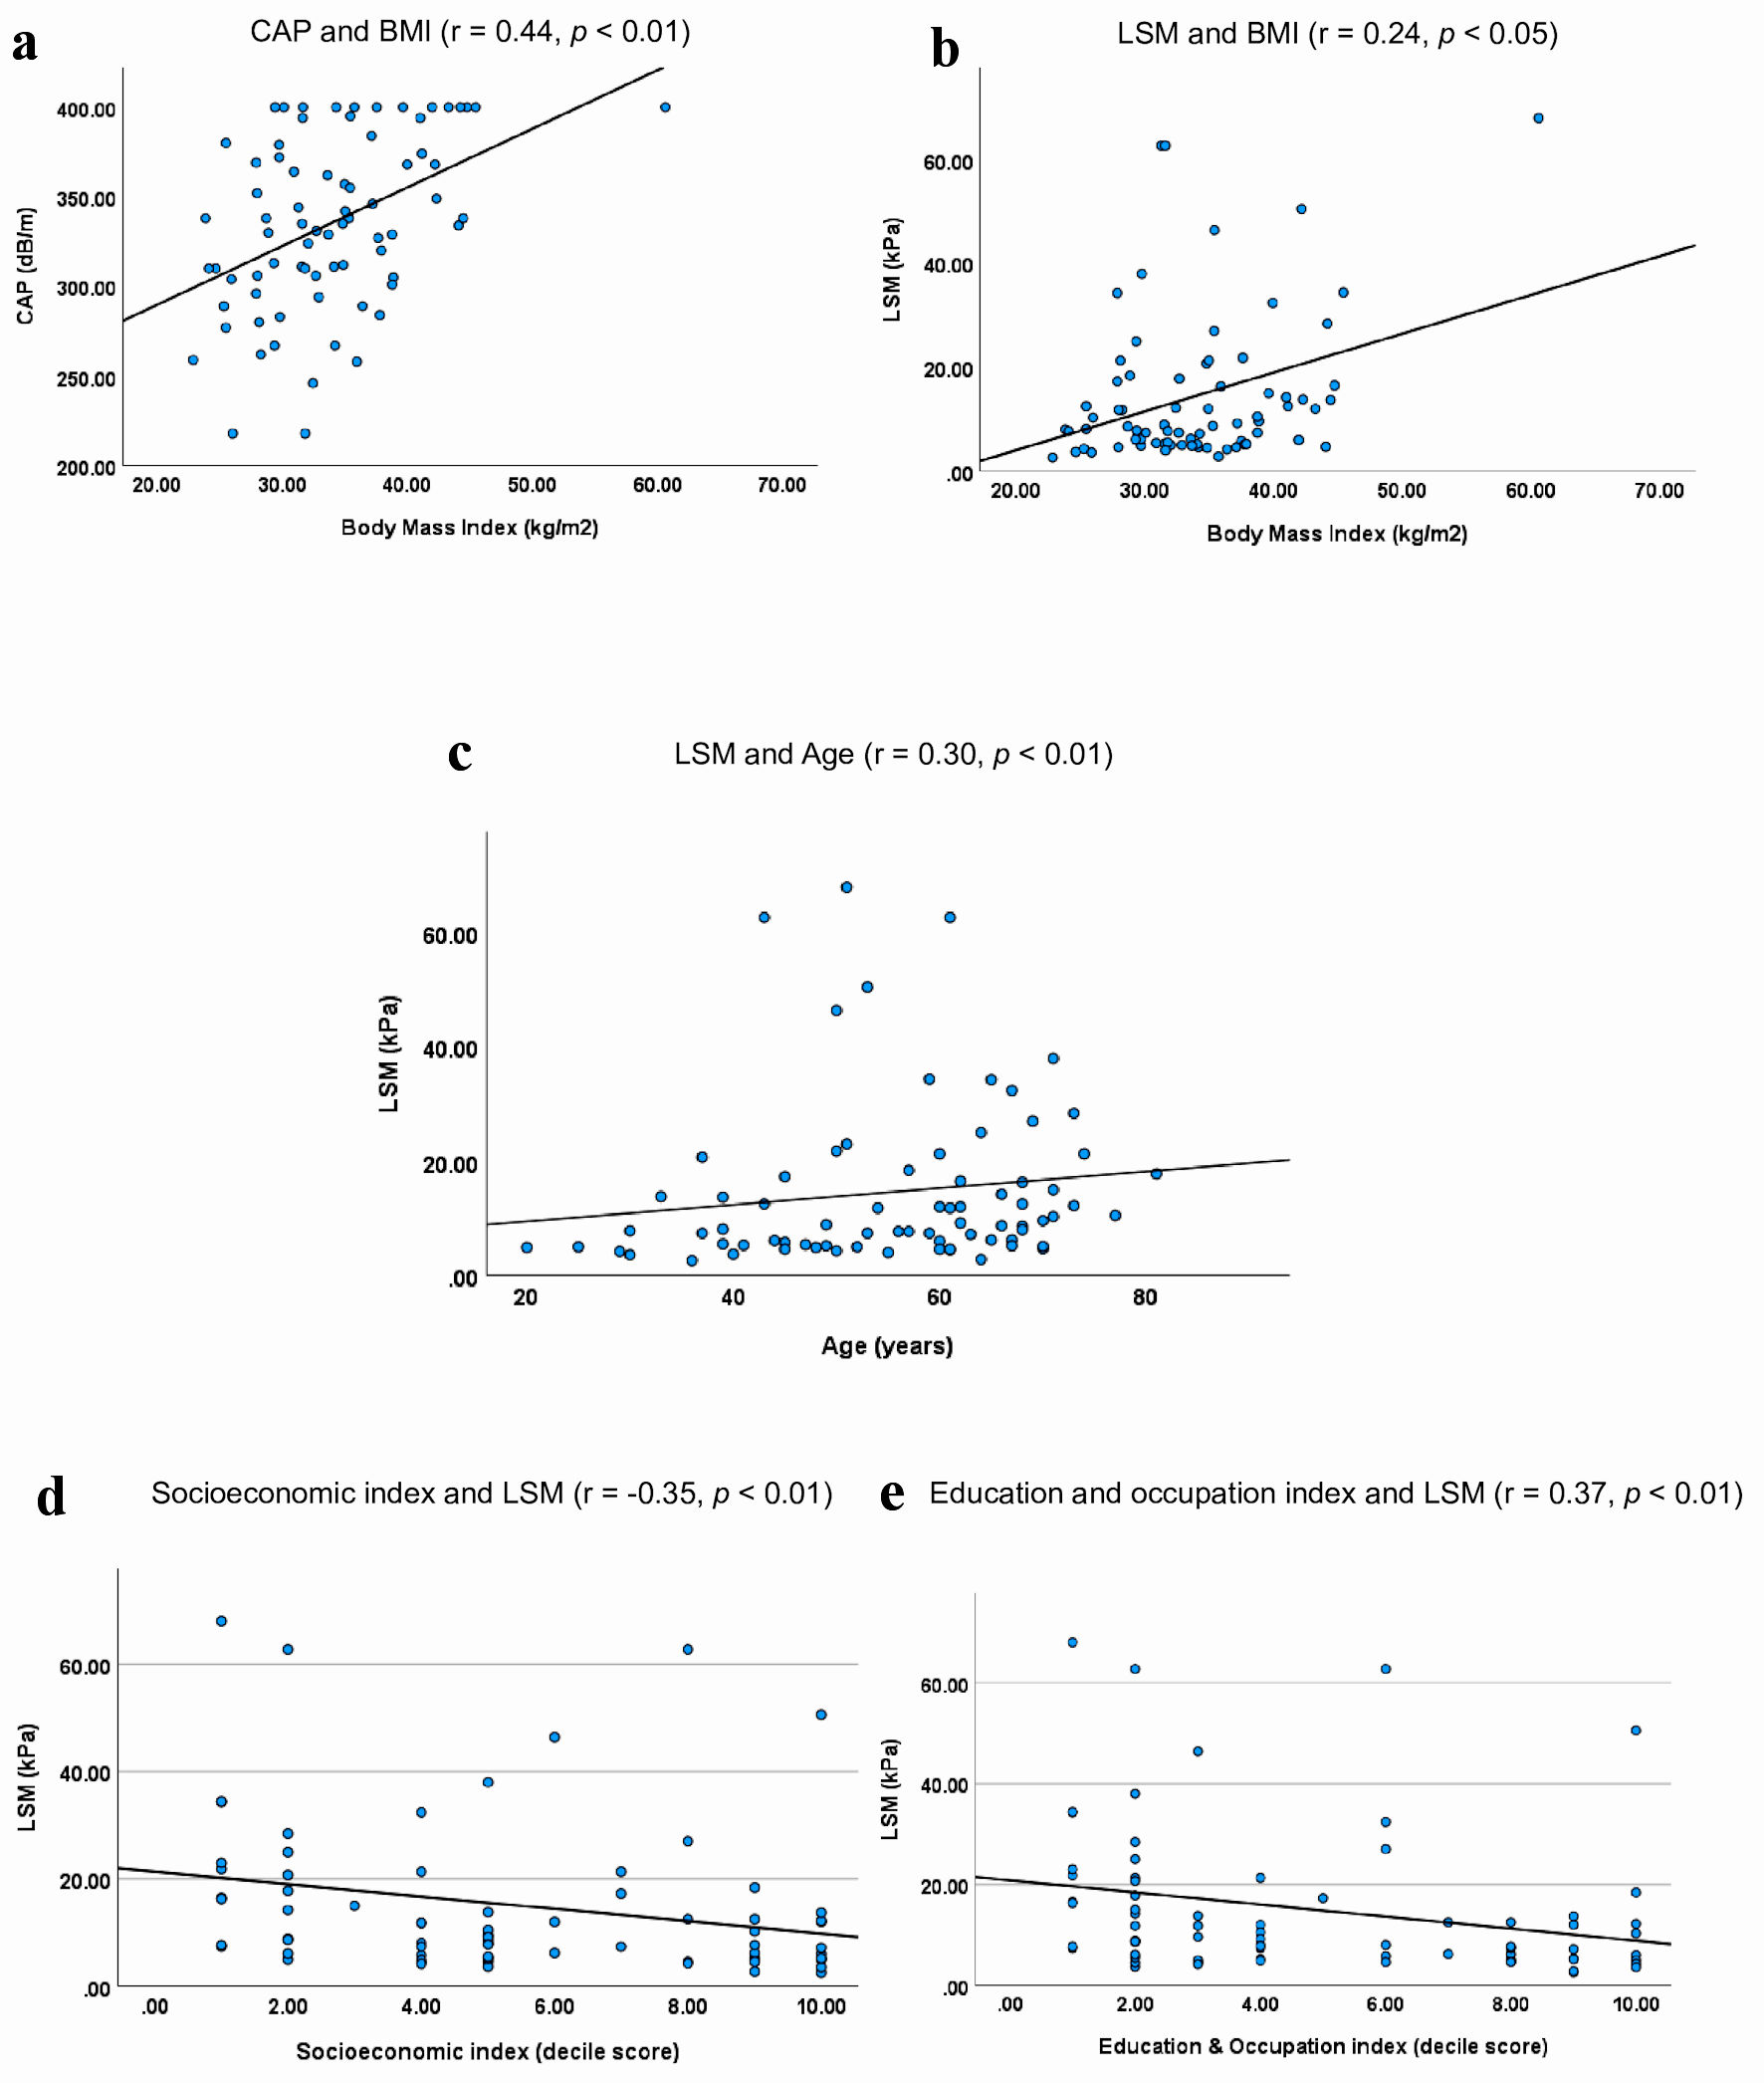
Figure 2. Correlations of CAP and LSM with age, BMI, socioeconomic and education and occupation indices. (a). Participants with high BMI had high CAP scores (r = 0.44, P < 0.01). (b) Participants with high BMI also appeared to have elevated LSM scores (r = 0.24, P < 0.05). (c) Older participants appeared to have higher LSMs (r = 0.30, P < 0.01). (d) LSM was inversely correlated with the socioeconomic status of the participants (r = -0.35, P < 0.01). (e) LSM was inversely correlated with the education and occupation indices of participants (r = -0.35, P < 0.01). Decile scores: 1 - most disadvantaged, 5 - average, 10 - most advantaged. CAP: controlled attenuation parameter; LSM: liver stiffness measurement; BMI: body mass index.
Figure 3.
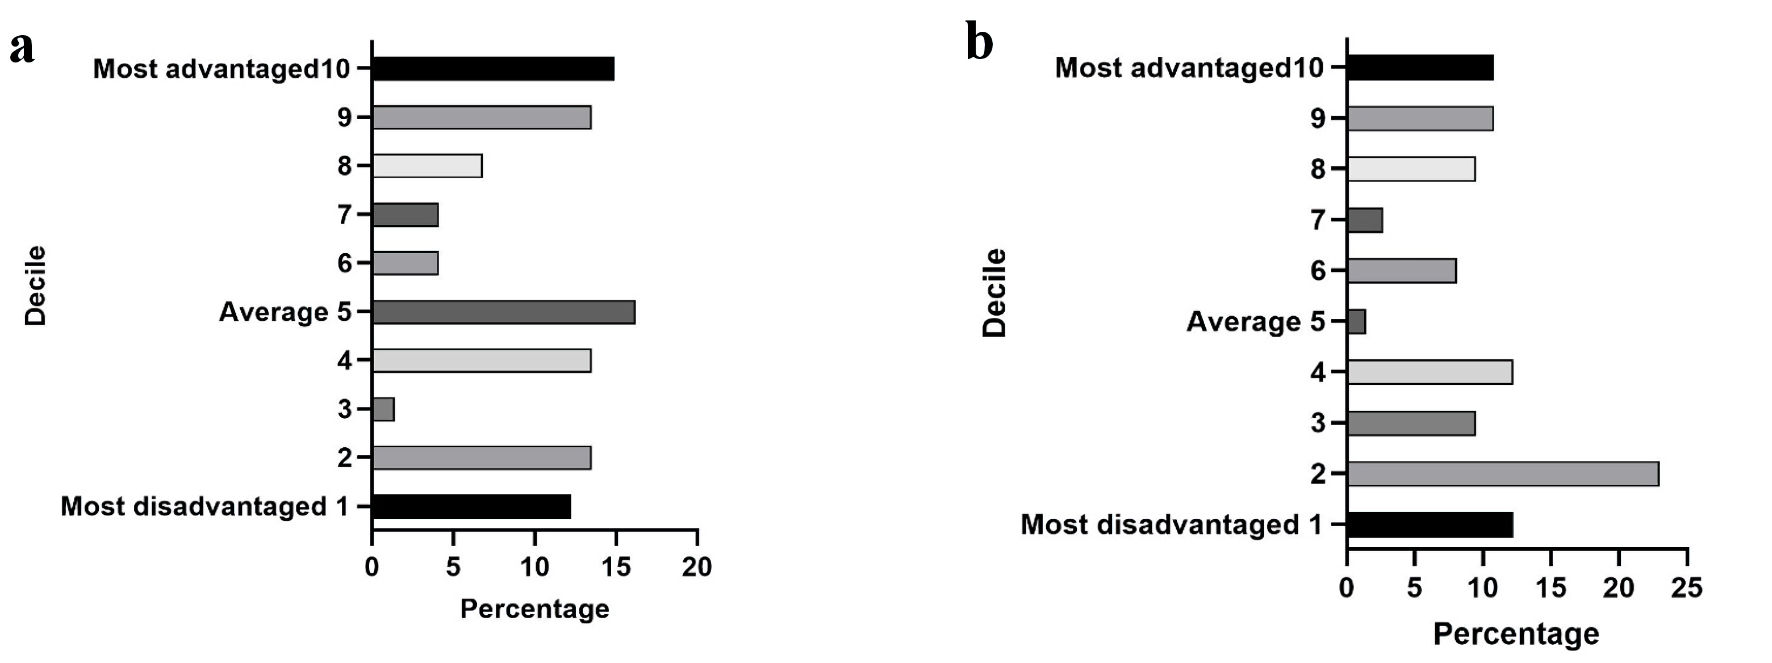
Figure 3. Socioeconomic, education and occupation indices for all participants. (a) Socioeconomic index. The socioeconomic status of participants did not differ significantly and was evenly distributed across most-advantaged and most-disadvantaged regions. (b) Education and occupation index. The number of participants residing in the low decile score regions (55% in decile 2) exceeded those in the high or above-average decile score regions based on their education and occupation index.

Tables

Table 1. Demographic Characteristics of the Participants Who Participated in the Study
 
MASLD (n = 81)Hepatic steatosis gradeHepatic fibrosis stage
S1S2S3F1F2F3F4
Mean and SD values of 81 participants are shown. S1: steatosis grade 1; S2: steatosis grade 2; S3: steatosis grade 3; F1: fibrosis grade 1; F2: fibrosis grade 2; F3: fibrosis grade 3; F4: fibrosis grade 4; SD: standard deviation; MASLD: metabolic dysfunction-associated steatotic liver disease.
Age (years)55 (13.4)60 (15.2)49 (11.6)55 (13.6)53 (11.4)55 (13.3)66 (9.07)58 (12.1)
Male, n (%)35 (43)5 (33.3)6 (46.2)22 (45.8)2 (50)5 (55.6)0 (0)12 (38.7)
Female, n (%)46 (57)10 (66.6)7 (53.8)26 (54.2)2 (50)4 (44.4)5 (100)19 (61.3)
Ethnicity, n (%)
Caucasian49 (60.5)9 (60)10 (76.9)28 (58.3)2 (50)4 (44.4)4 (80)22 (71)
Indian2 (2.5)1 (6.7)-1 (2.1)1 (25)---
African2 (2.5)--2 (4.2)----
Asian12 (14.8)3 (20)2 (15.4)5 (10.4)-3 (33.3)1 (20)1 (3.2)
Aboriginal and Torres Strait Islander1 (1.2)1 (6.7)------
Other15 (18.5)1 (6.7)1 (7.7)12 (25)1 (25)2 (22.2)-8 (25.8)
BMI33.8 (6.4)30.4 (4.8)31.2 (5.0)36 (6.7)33.9 (3.6)29.7 (4.7)31.9 (6.3)36.7 (7.5)


Table 2. Multinomial Logistic Regression Analysis of Liver-Related Variables Influencing the Exercise Behaviors
 
Do you perform at least 150 min/week of exercise?PredictorsBORP value
P value was significant at < 0.05. S1: steatosis 1; S2: steatosis 2; S3: steatosis 3; F1: fibrosis 1; F2: fibrosis 2; F3: fibrosis 3; F4: fibrosis 4; B: regression coefficient; OR: odds ratio.
YesS1-2.810.060.12
S2-46.188.740.99
S30--
F1-28.763.230.99
F2-0.750.471
F322.13411.80.99
F4-42.224.590.98
Fib4 (57)-0.340.710.50
NoS1-2.610.070.06
S2-29.122.240.98
S30--
F1-30.257.220.98
F2-0.640.521.00
F33.6136.99-
F4-41.449.990.98
Fib4 (57)-0.270.750.48


Table 3. Responses to Barriers to Exercise
 
BarrierFrequency (%)
Health issues, lack of time, lack of enjoyment in exercising, other barriers, and fatigue caused during and after exercise were the leading barriers to achieve recommended amounts of exercise for participants.
1. Lack of time43
2. Lack of enjoyment in exercising31
3. Boredom or nothing innovative in exercising15
4. Lack of support (from family, friends, society)13
5. Health issues (physical and mental)57
6. Lack of self-confidence to engage in exercise14
7. Lack of knowledge about exercise and how to perform them correctly15
8. Peer pressure0
9. Lack of money19
10. Energy requirement and fatigue during and after exercise24
11. Discouragement or body shaming by others9
12. Safety, accessibility or traffic issues4
13. Other25


Table 4. Binomial Logistic Regression Analysis of Factors Influencing the Leading Barriers to Exercise
 
BarriersPredictorsB95% CIORP value
*P value was significant at < 0.05. SES: socioeconomic index; Eduocc: education and occupation index; B: regression coefficient; OR: odds ratio; CI: confidence interval.
Lack of timeAge-0.070.89 - 0.970.930.002*
Gender0.360.49 - 4.181.430.50
Ethnicity-0.480.68 - 1.330.950.78
SES0.110.72 - 1.731.120.59
Eduocc-0.0980.59 - 1.380.900.65
Lack of enjoymentAge-0.010.94 - 1.030.980.57
Gender-0.890.14 - 1.160.400.09
Ethnicity-0.260.52 - 1.110.760.16
SES0.080.70 - 1.681.080.70
Eduocc-0.130.56 - 1.350.870.55
Health issuesAge0.041.00 - 1.081.040.03*
Gender0.160.42 - 3.231.170.75
Ethnicity0.040.75 - 1.451.040.78
SES0.010.66 - 1.541.010.94
Eduocc-0.080.60 - 1.380.910.68
Energy requirement and fatigueAge-0.540.90 - 0.990.940.02*
Gender1.110.84 - 10.93.040.09
Ethnicity0.110.78 - 1.601.120.52
SES-0.260.46 - 1.250.760.29
Eduocc0.220.77 - 2.031.250.35
OthersAge-0.0040.95 - 1.040.990.86
Gender0.220.38 - 4.091.250.71
Ethnicity-0.250.49 - 1.210.770.26
SES0.210.74 - 2.071.240.40
Eduocc0.070.67 - 1.731.070.75