Figures
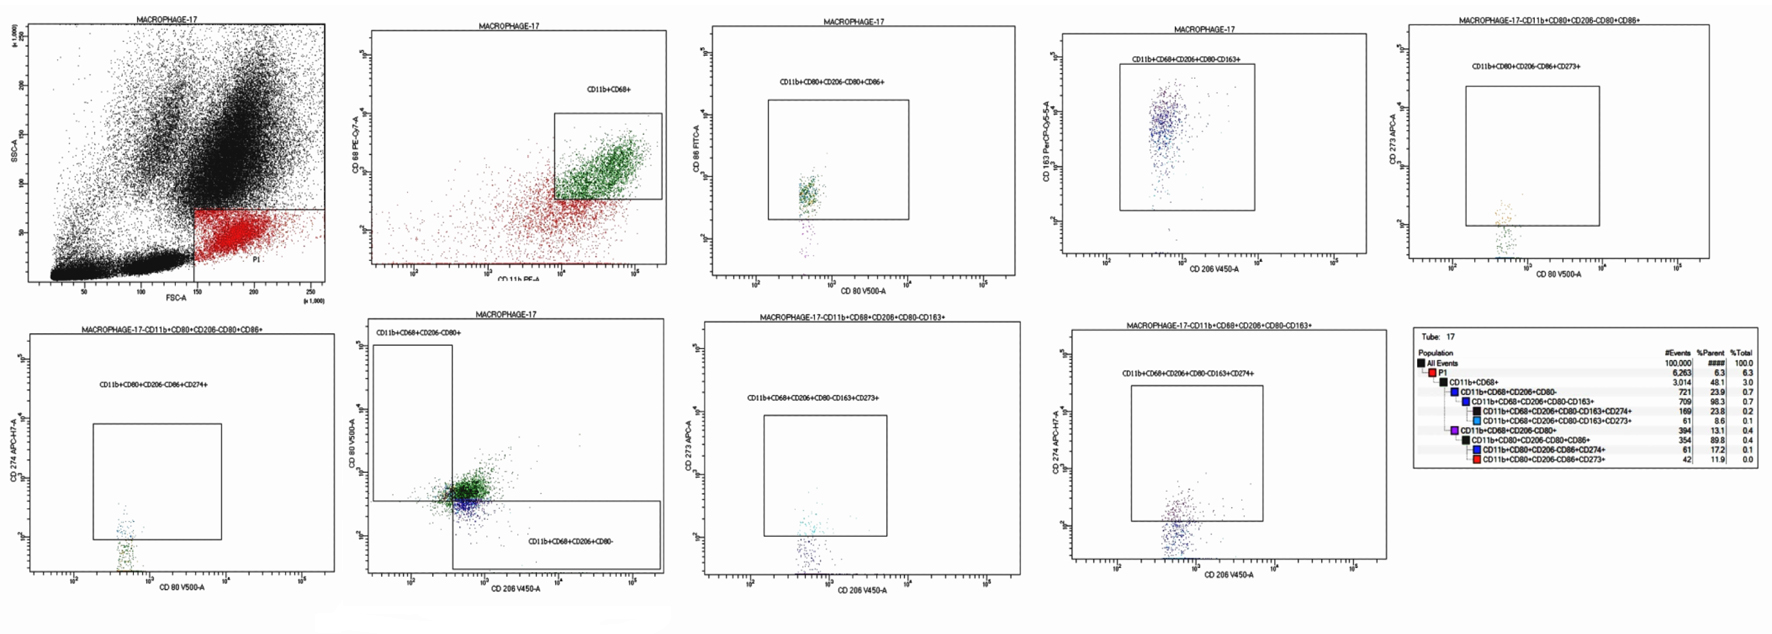
Figure 1. Flow cytometric detection of macrophages subtypes. First blot: FSC and SSC were gating on monocyte and macrophage region (high FSC, low SSC). Second blot: gating on macrophage/monocytes (coexpression of CD68+CD11b+). Third blot: subclassification of the (CD68+CD11b+) into M1 (CD80+CD206-) and M2 (CD80-CD206+). Fourth blot: further characterization of M1 as (CD80+CD86+). Fifth blot: further characterization of M2 as (CD206+CD163+). Sixth blot: expression of the PD-L1 (CD274) on M1 (CD80+CD86+CD274+). Seventh blot: expression of the PD-L2 (CD273) on M1 (CD80+CD86+CD273+). Eighth blot: expression of the PD-L1 (CD274) on M2 (CD206+CD163+CD274+). Ninth blot: expression of the PD-L2 (CD273) on M2 (CD206+CD163+CD273+). FSC: forward scatter; SSC: side scatter.
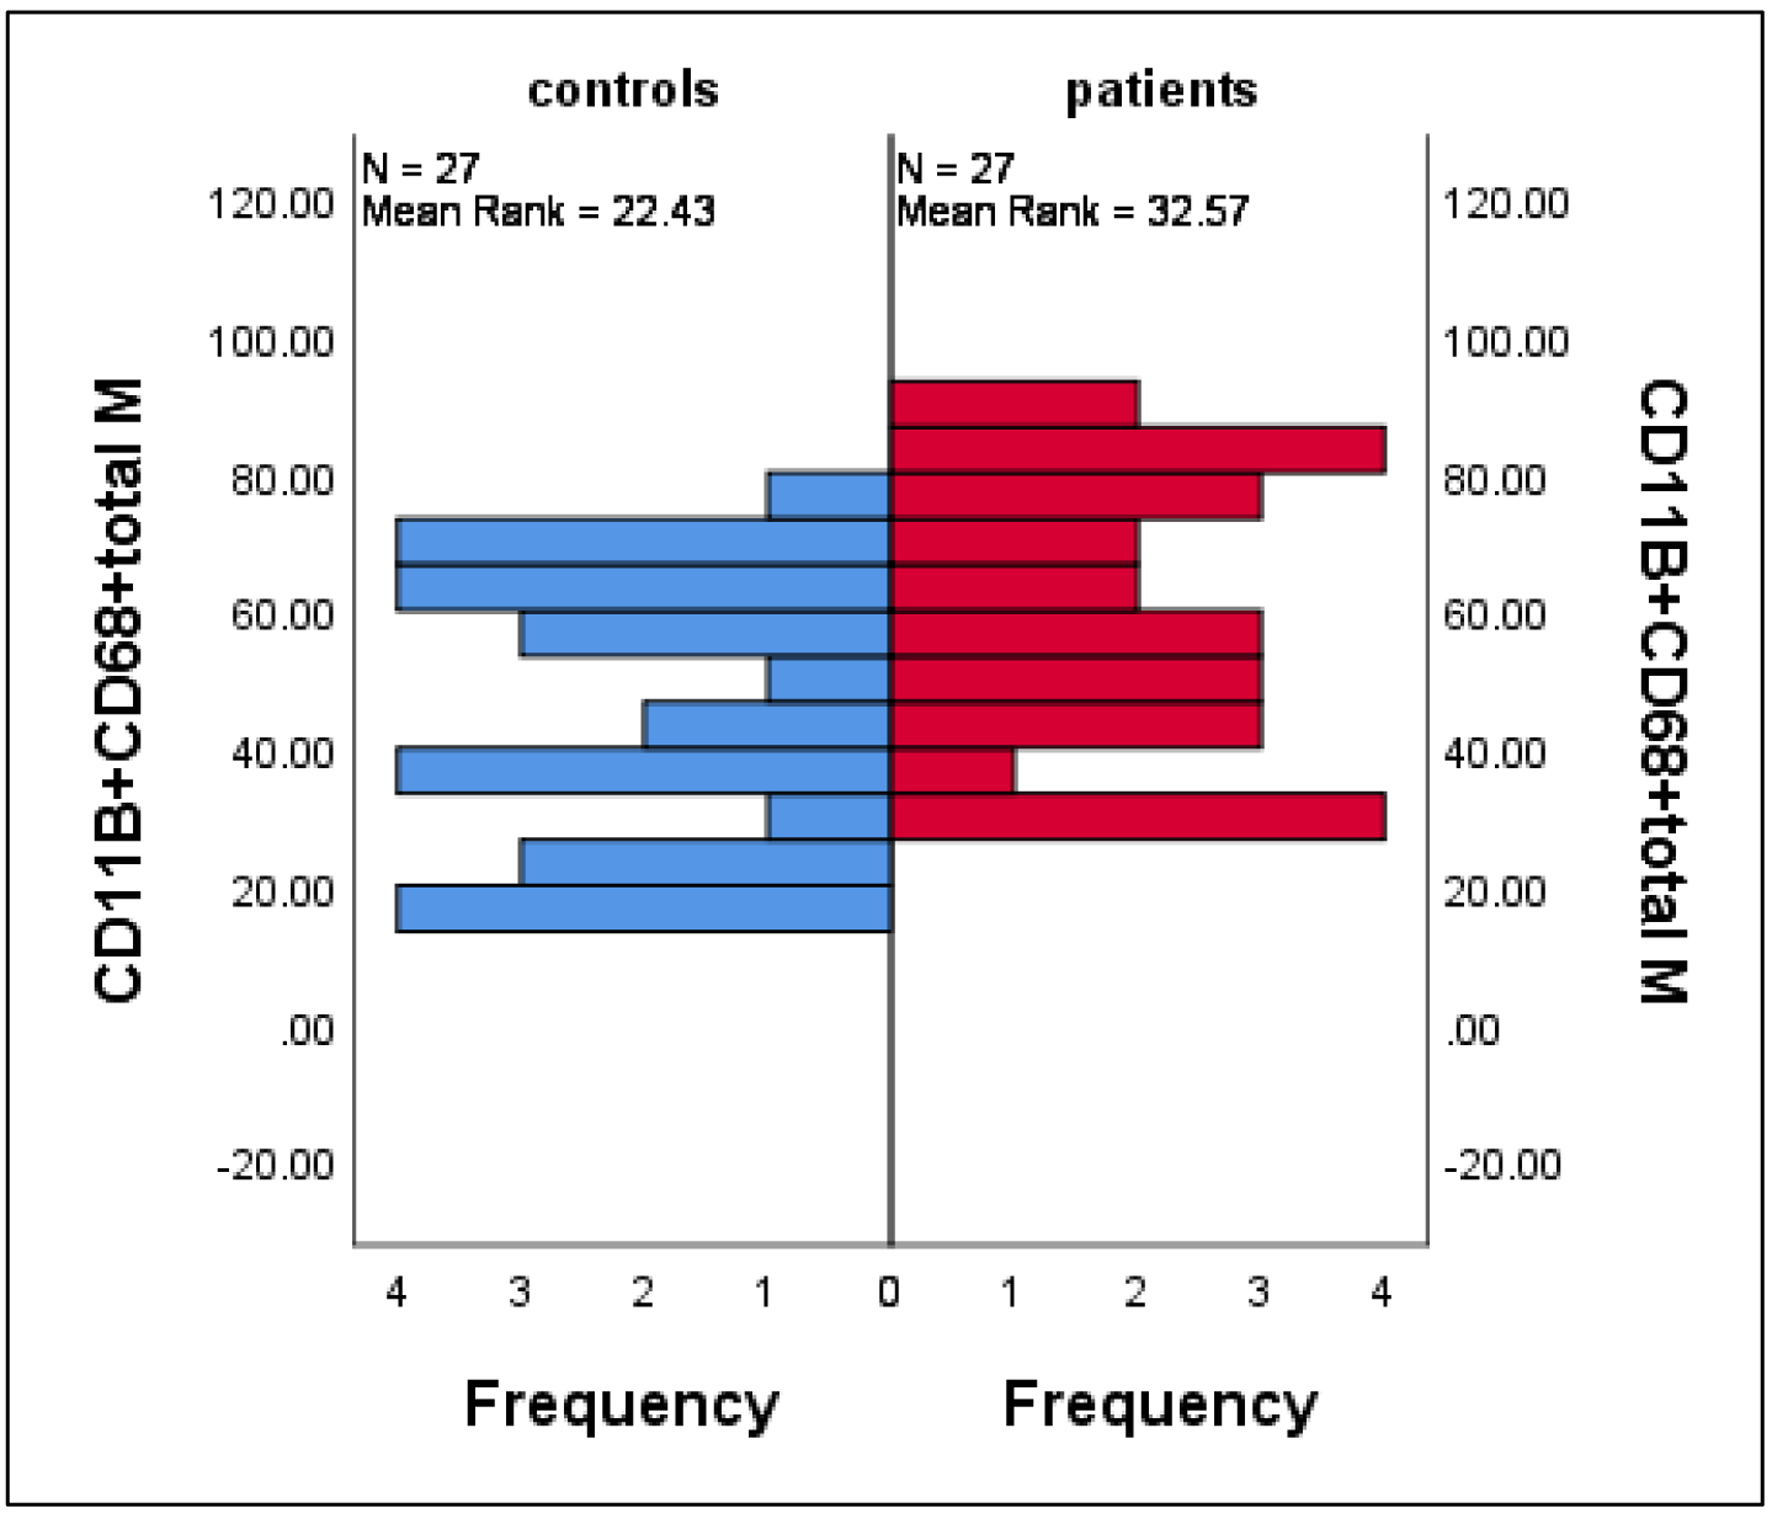
Figure 2. Differences in the mean percentages of macrophage (characterized by CD11B+CD68+ phenotype) between patients and controls. Data are expressed as mean ± SE, Mann-Whitney U-test. SE: standard error of the mean.
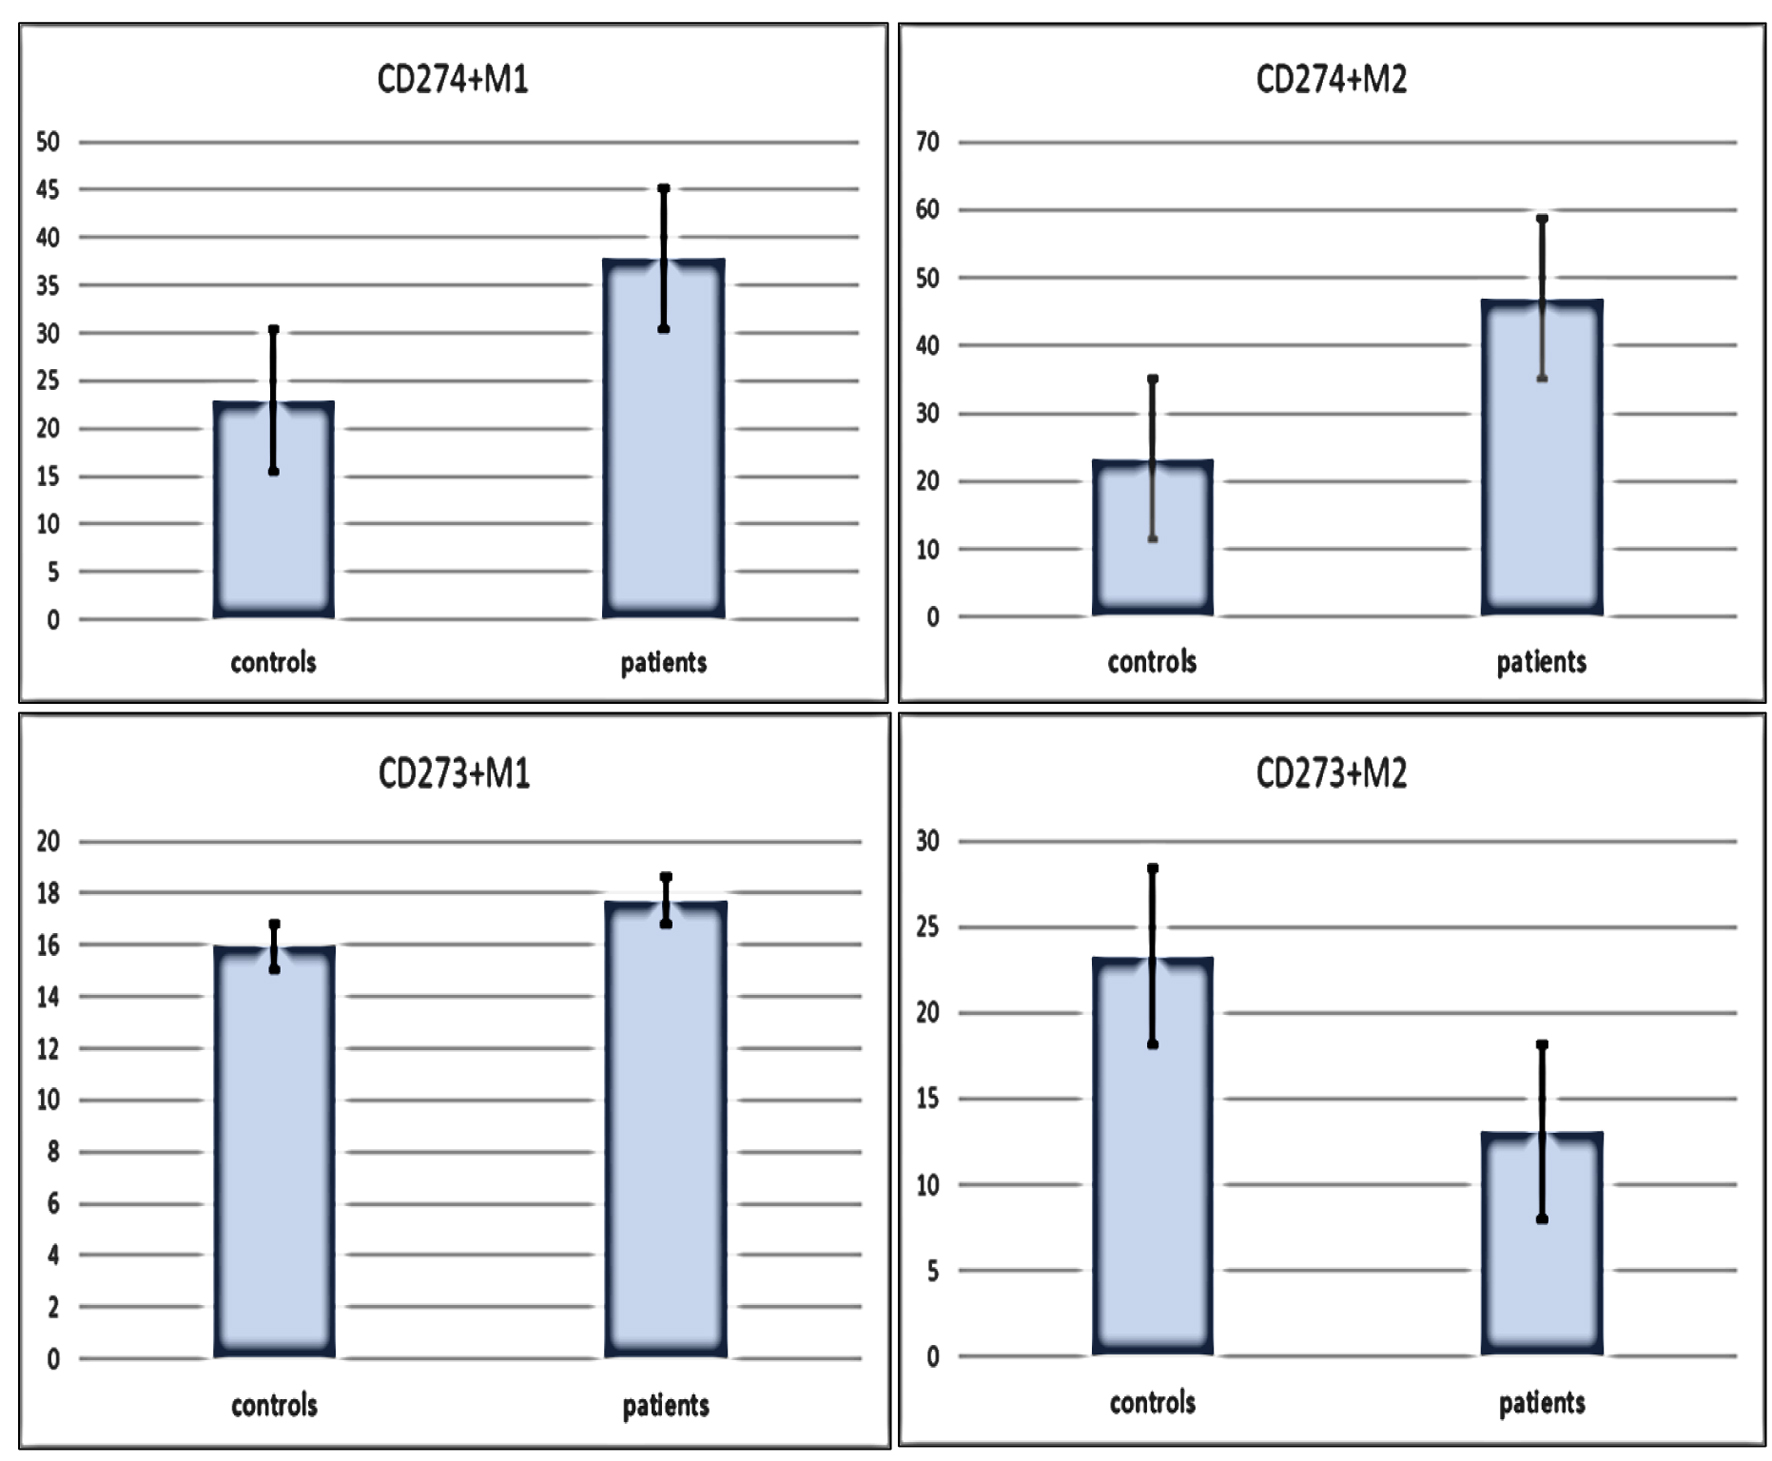
Figure 3. Differences in immune check points (CD273 and CD274) expressions on M1 and M2 macrophages subtypes between patients and controls. Data are expressed as mean ± SE. Mann-Whitney U-test. SE: standard error of the mean.
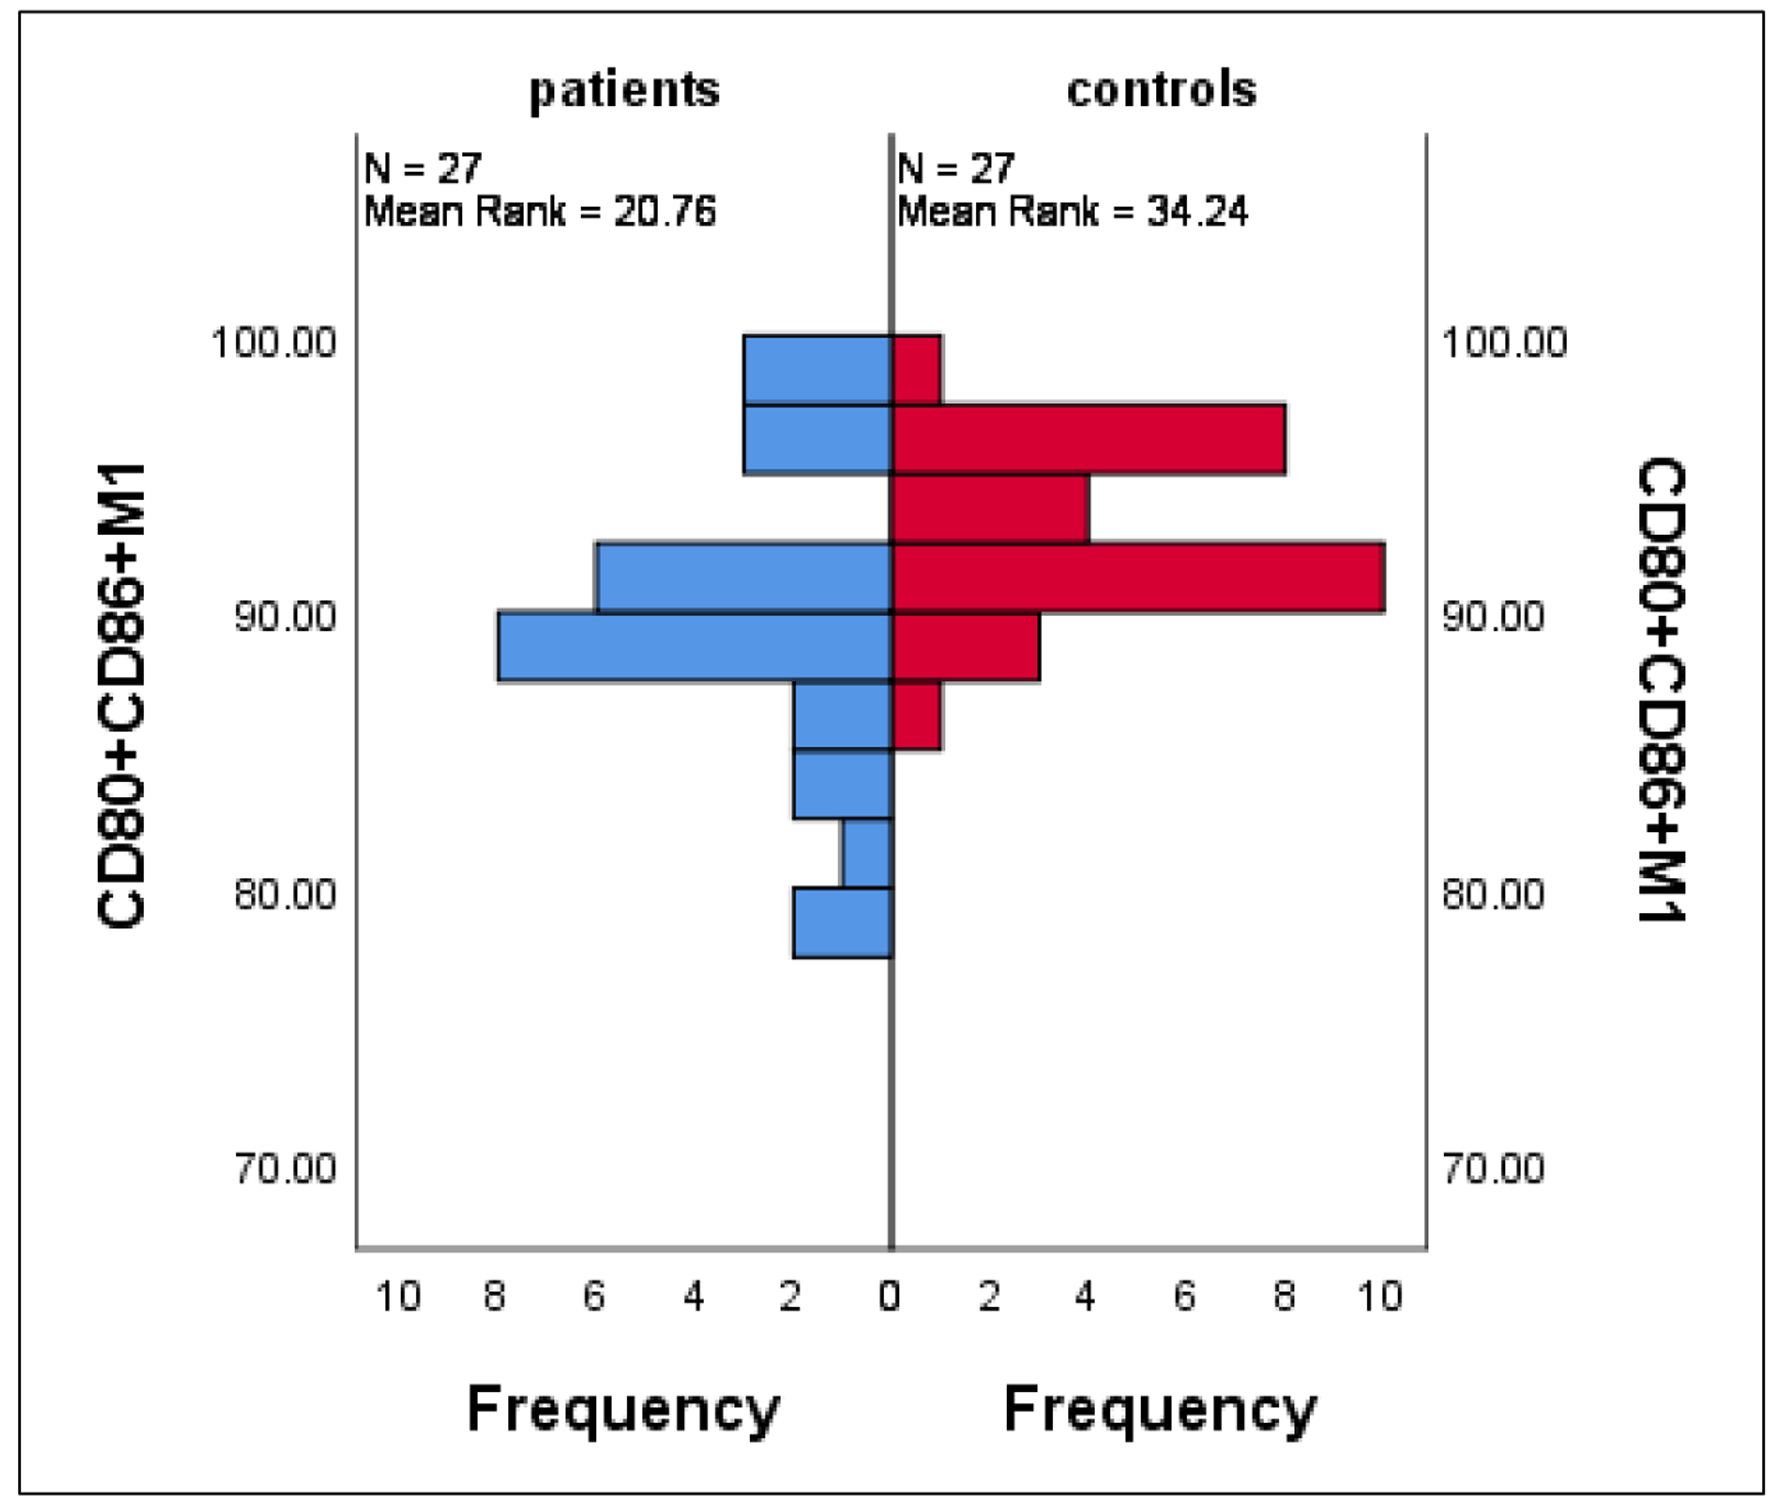
Figure 4. Differences in CD80+CD86+ M1 between patients and controls. Data are expressed as mean ± SE. Mann-Whitney U-test. SE: standard error of the mean.
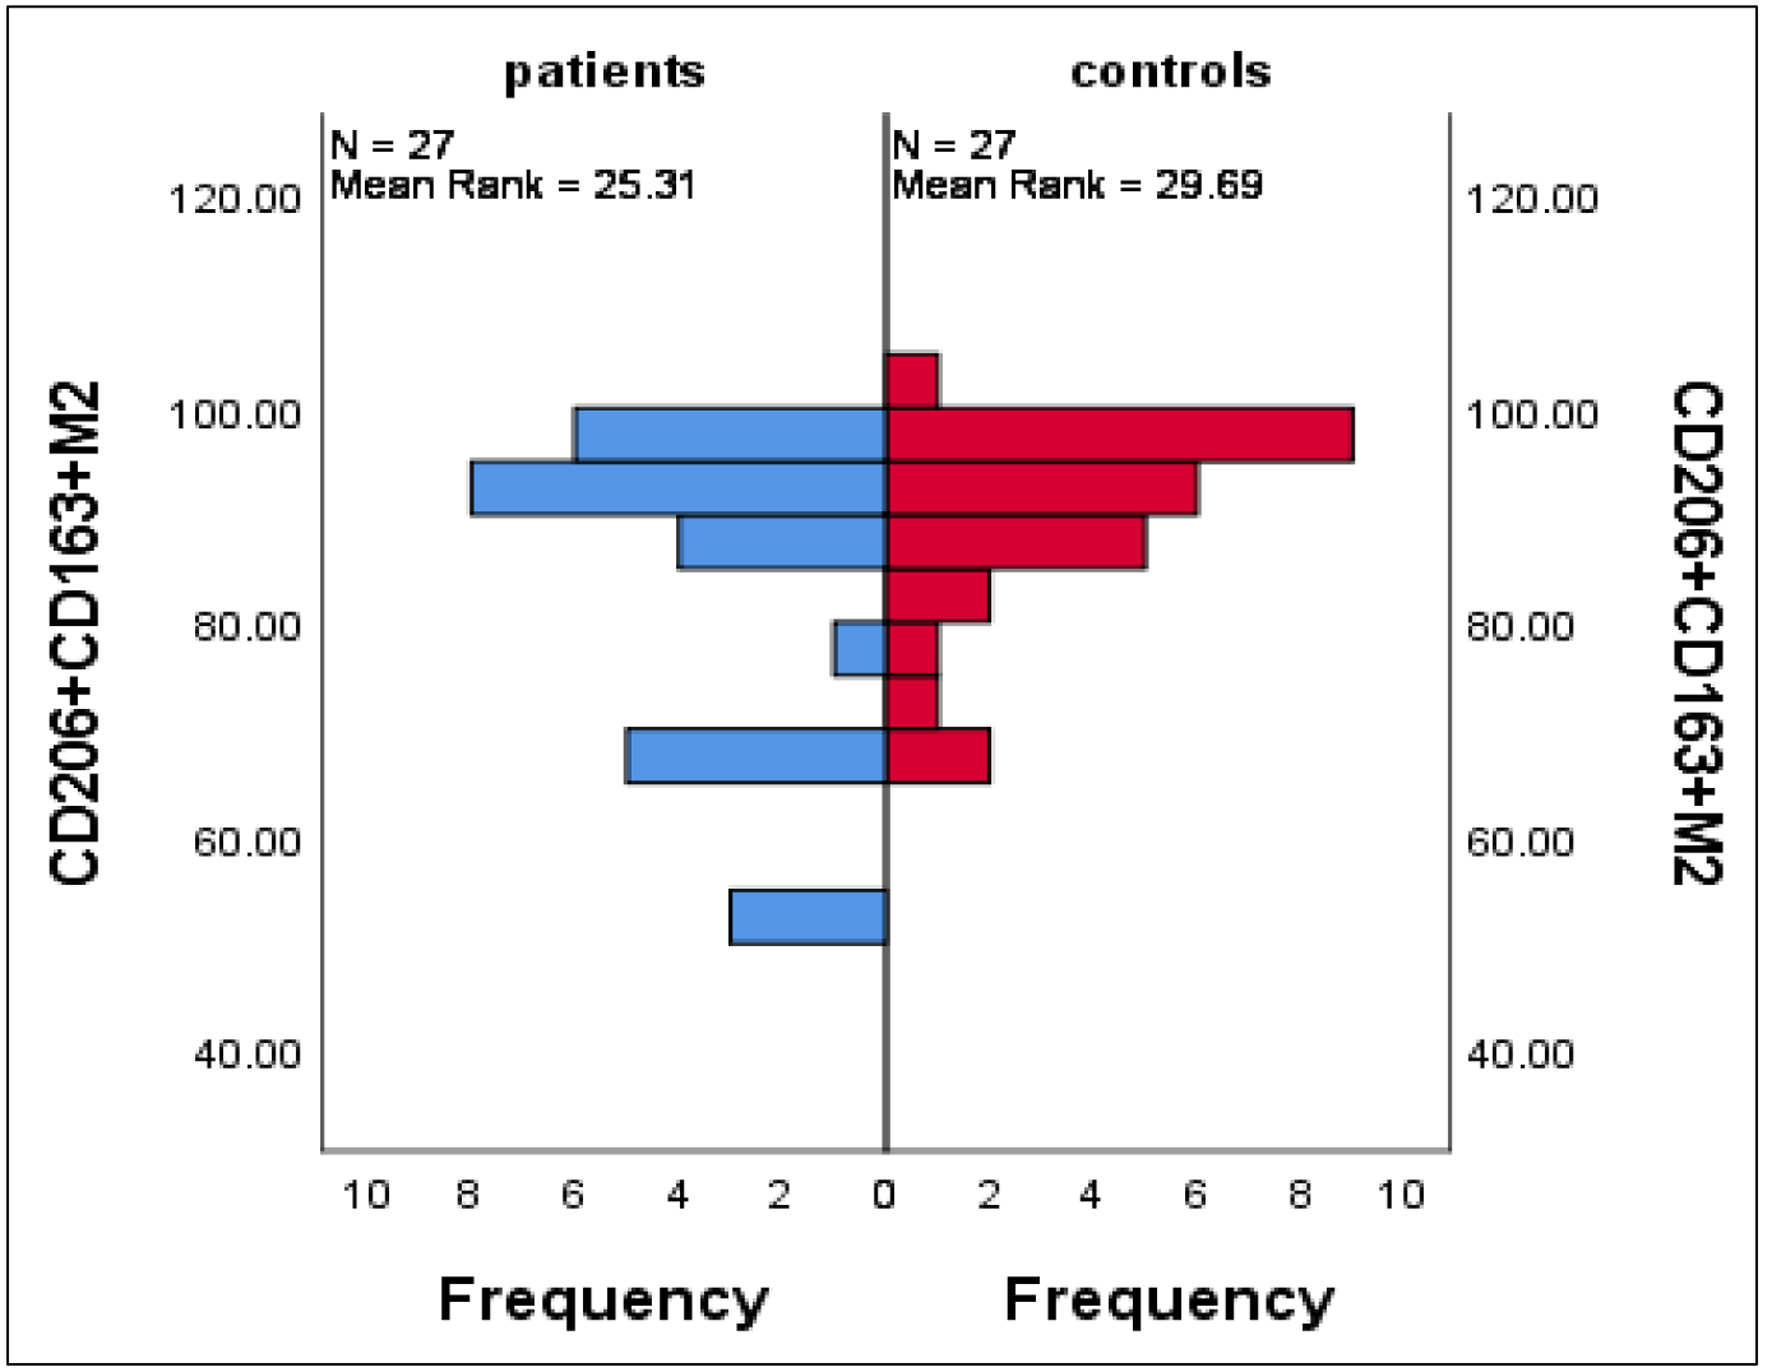
Figure 5. Differences in CD206+CD163+ M2 between patients and controls. Data are expressed as mean ± SE. Mann-Whitney U-test. SE: standard error of the mean.
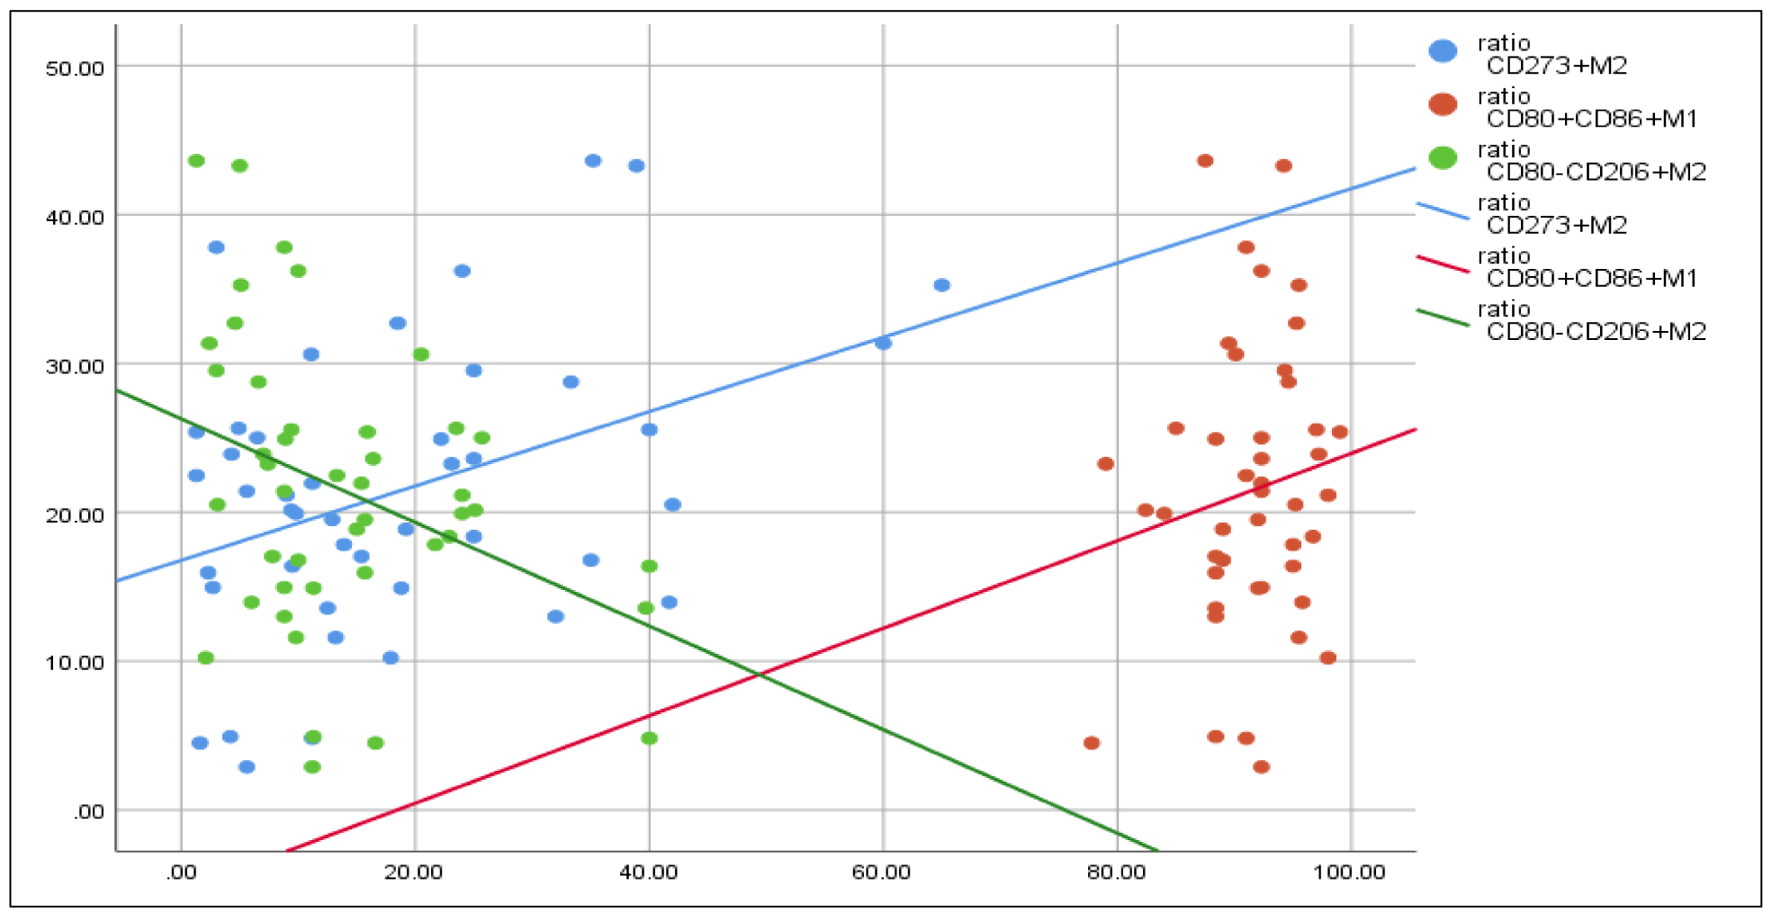
Figure 6. Correlations between PC/MPV ratio and, CD80+CD86+ M1, CD80-CD206+ M2. Spearman rho test is used for correlation. PC: platelet count; MPV: mean platelet volume.
Tables
Table 1. Antibody Reagent
| Marker | Fluorochrome | Volume used (µL) |
|---|
| General phenotypic markers | | |
| CD11b | PE | 10 |
| CD68 | PE-CY7 | 10 |
| M1 macrophage markers | | |
| CD80 | V500 | 10 |
| CD86 | FITC | 10 |
| M2 macrophage markers | | |
| CD206 | V450 | 10 |
| CD163 | PerCP-CY5-5 | 10 |
| Immune checkpoint markers | | |
| CD273 (PD-L2, B7-DC) | APC | 10 |
| CD274 (PD-L1, B7-H1) | APC-H7 | 10 |
Table 2. Gating Populations
| Cells | Markers | References |
|---|
| General macrophages’ phenotypic markers | CD68+CD11b+ | [18-21] |
| M1 macrophage | CD68+CD11b+CD80+CD86+ | |
| M2 macrophage | CD68+CD11b+CD206+CD163+ | |
| CD274 (PD-L1, B7-H1) immune checkpoint of M1 | CD68+CD11b+CD80+CD86+CD274+ | |
| CD274 (PD-L1, B7-H1) immune checkpoint of M2 | CD68+CD11b+CD206+CD163+CD274+ | |
| CD273 (PD-L2, B7-DC) immune checkpoint of M1 | CD68+CD11b+CD80+CD86+CD273+ | |
| CD273 (PD-L2, B7-DC) immune checkpoint of M2 | CD68+CD11b+CD206+CD163+CD273+ | |
Table 3. Clinical and Demographic Data of All Participants
| Item | Patients (n = 27) | Controls (n = 27) |
|---|
| Sex, n (%) | | |
| Female | 12 (44.5%) | 12 (44.5%) |
| Male | 15 (53.5%) | 15 (53.5%) |
| Age, years, mean ± SD | 35 ± 13 | 37 ± 10 |
| Smoking, n (%) | 14 (52%) | 12 (44.5%) |
| Type of viral infections, n (%) | | |
| H1N1 | 5 (18.5%) | - |
| H3N2 | 1 (3.7%) | - |
| Influenza A no subtype | 5 (18.5%) | - |
| Influenza B | 4 (14.8%) | - |
| COVID-19 | 12 (44.5%) | - |
| Cough, n (%) | 27 (100%) | - |
| Fever, n (%) | 25 (93%) | - |
| Myalgia, n (%) | 25 (93%) | - |
| Dyspnea, n (%) | 24 (89%) | - |
| Oxygen saturation < 93%, n (%) | 22 (81%) | - |
Table 4. Blood Characteristics of Patients and Controls
| Blood elements | Groups | Mean ± SE | P-value |
|---|
| Data expressed as mean ± SE and analyzed by independent sample t-test. Hb: hemoglobin; LMR: lymphocyte-to-monocyte ratio; MPV: mean platelet volume; NLR: neutrophil/lymphocyte ratio; PC: platelet count; RBC: red blood cell; SE: standard error. |
| RBCs (× 1012/L) | Patients | 3.4 ± 0.14 | < 0.001 |
| Controls | 4.9 ± 0.2 | |
| Hb (g/L) | Patients | 9.8 ± 0.4 | < 0.001 |
| Controls | 13.1 ± 0.5 | |
| Neutrophils (× 109/L) | Patients | 3.7 ± 0.5 | < 0.001 |
| Controls | 9.2 ± 1.0 | |
| Lymphocytes (× 109/L) | Patients | 1.1 ± 0.2 | 0.4 |
| Controls | 1.3 ± 0.2 | |
| Monocytes (× 109/L) | Patients | 0.72 ±0.09 | 0.8 |
| Controls | 0.61 ± 0.08 | |
| Eosinophils (× 109/L) | Patients | 0.05 ±0.02 | 0.6 |
| Controls | 0.07 ± 0.03 | |
| Basophils (× 109/L) | Patients | 0.03 ± 0.005 | 0.3 |
| Controls | 0.04 ± 0.01 | |
| PC (× 109/µL) | Patients | 114.0 ± 9.12 | < 0.001 |
| Controls | 259.3 ± 23.1 | |
| MPV (fL) | Patients | 6.5 ± 0.1 | 0.001 |
| Controls | 10.91 ± 0.2 | |
| NLR | Patients | 4.7 ± 1.0 | 0.002 |
| Controls | 10.2 ± 1.4 | |
| LMR | Patients | 2.5 ± 0.6 | 0.9 |
| Controls | 2.6 ± 0.7 | |
| PC/MPV ratio | Patients | 17.5 ± 1.5 | 0.006 |
| Controls | 25.3 ± 2.3 | |