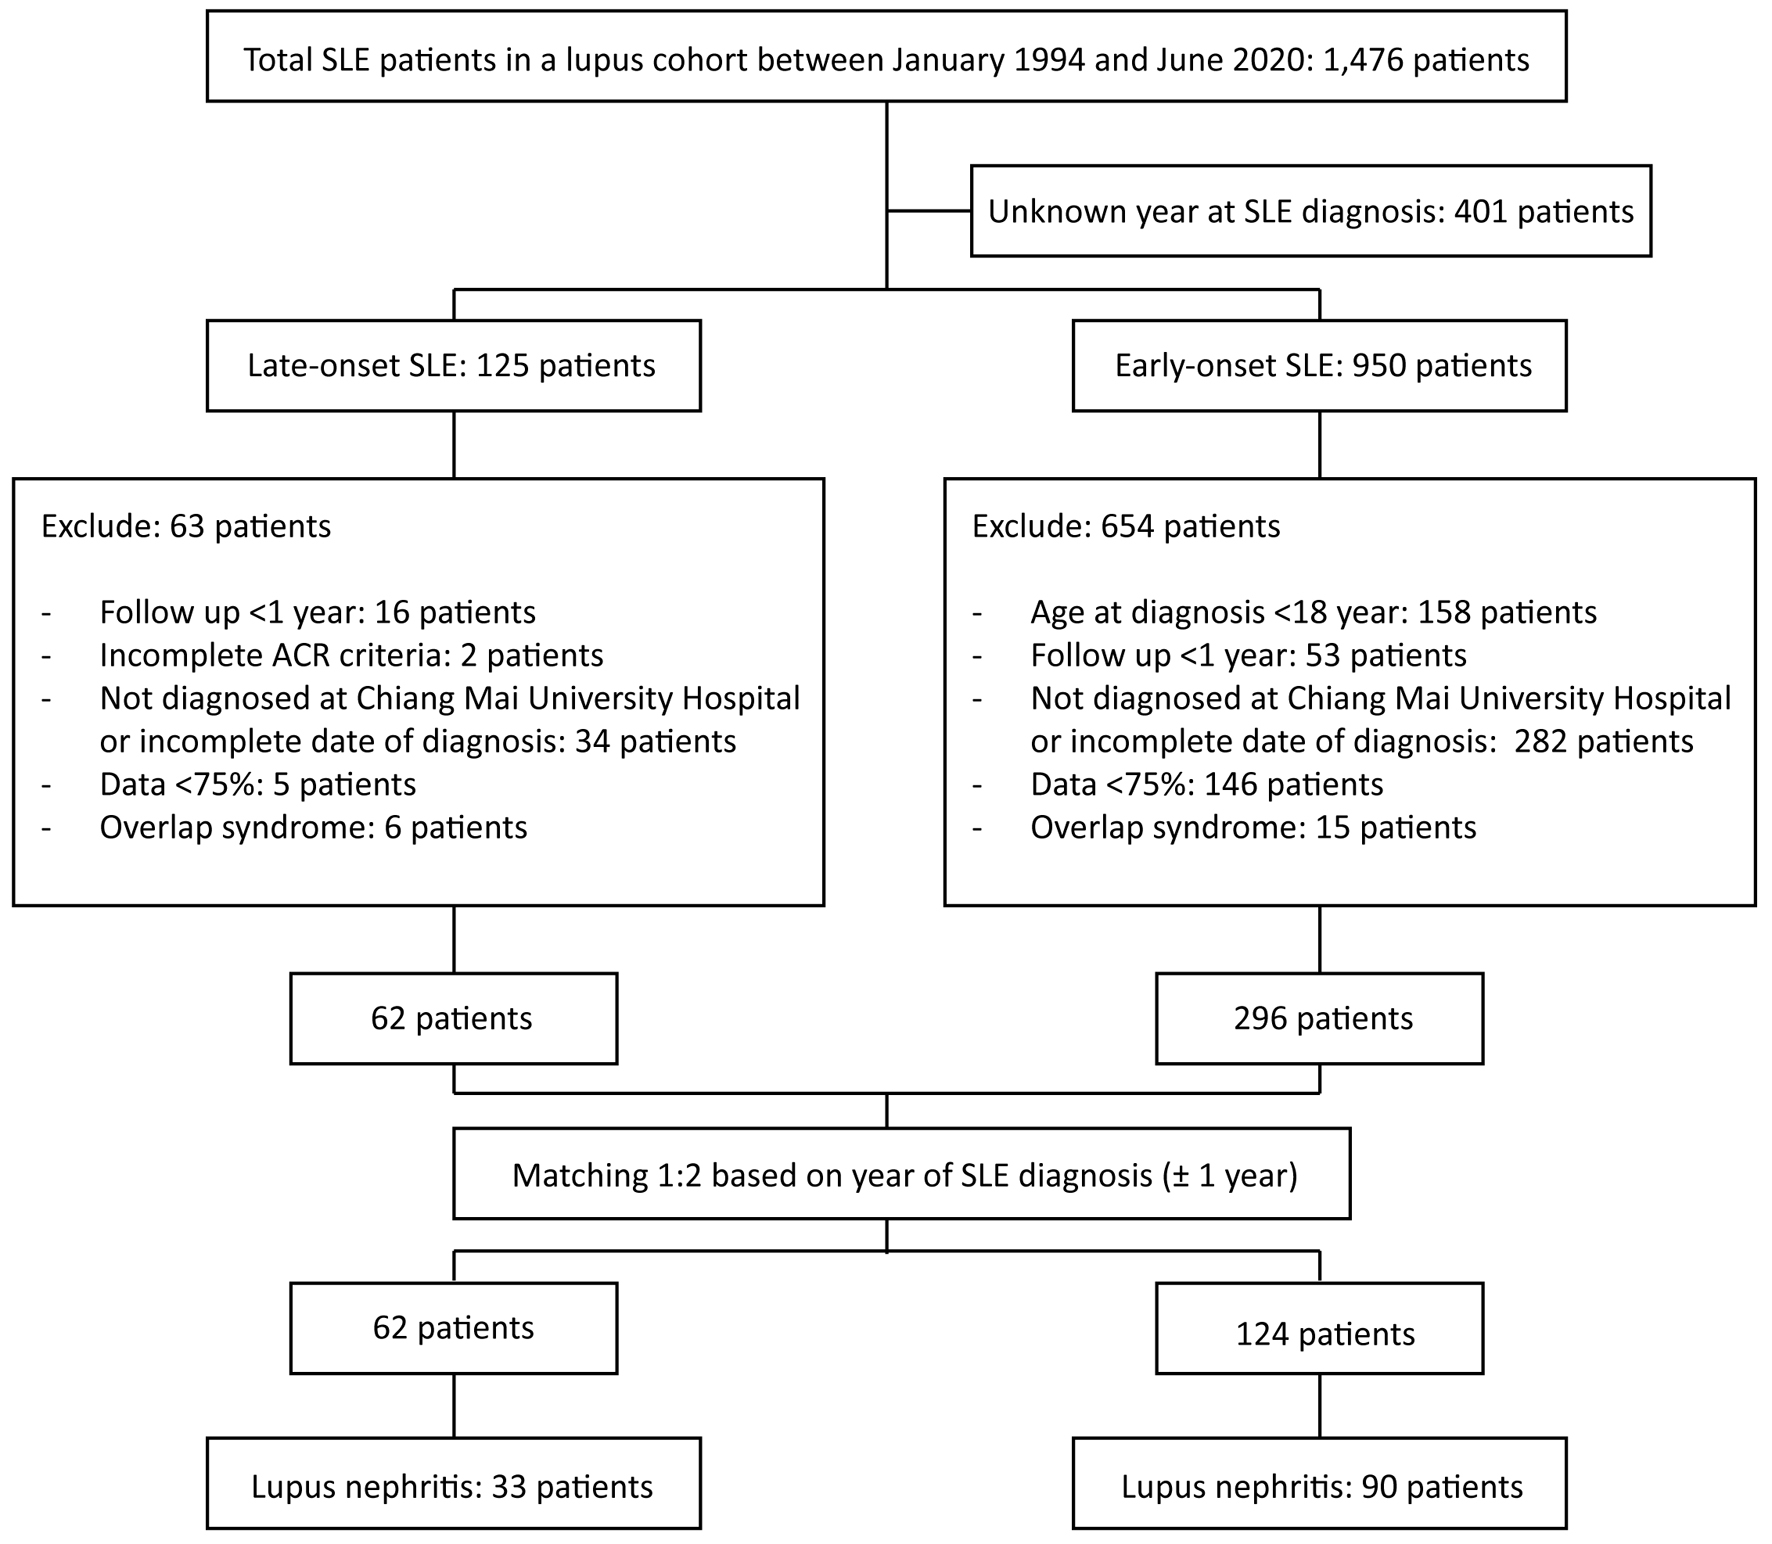
Figure 1. Flowchart showing the matching process. ACR: American College of Rheumatology; SLE: systemic lupus erythematosus.
| Journal of Clinical Medicine Research, ISSN 1918-3003 print, 1918-3011 online, Open Access |
| Article copyright, the authors; Journal compilation copyright, J Clin Med Res and Elmer Press Inc |
| Journal website https://www.jocmr.org |
Original Article
Volume 16, Number 2-3, March 2024, pages 106-117
Comparison of Clinical Features, Treatment and Outcomes of Lupus Nephritis Between Patients With Late- and Early-Onset Systemic Lupus Erythematosus: A Controlled Study
Figures
Tables
| Variables | Late-onset SLE (N = 33) | Early-onset SLE (N = 90) | P-value |
|---|---|---|---|
| Data are expressed as mean (95% CI) or n (%). aTransformed data. bAt SLE diagnosis. *Statistically significant. CI: confidence interval; LN: lupus nephritis; SLE: systemic lupus erythematosus. | |||
| Female | 28 (84.85) | 82 (91.11) | 0.425 |
| Body weight (kg) | 47.31 (44.57 - 50.10) | 50.81 (48.91 - 52.72) | 0.052 |
| Age at SLE diagnosis (years) | 56.27 (54.79 - 57.75) | 29.96 (28.06 - 31.86) | < 0.001* |
| Age at LN diagnosis (years) | 56.78 (55.27 - 58.30) | 31.52 (29.60 - 33.44) | < 0.001* |
| Duration of SLE (years)a | 3.87 (2.51 - 5.54) | 6.46 (5.35 - 7.68) | 0.011* |
| Duration of LN (years)a | 3.68 (2.33 - 5.34) | 5.39 (2.33 - 5.34) | 0.073 |
| Year of LN diagnosis | 0.629 | ||
| 1990 - 1999 | 0 | 2 (2.22) | |
| 2000 - 2009 | 13 (39.39) | 31 (34.44) | |
| 2010 - 2020 | 20 (60.61) | 57 (63.33) | |
| Underlying diseaseb | |||
| Hypertension | 9 (27.27) | 2 (2.22) | < 0.001* |
| Diabetes mellitus | 3 (9.09) | 1 (1.11) | 0.059 |
| Dyslipidemia | 1 (3.03) | 0 | 0.286 |
| Chronic kidney disease | 1 (3.03) | 0 | 0.268 |
| Thyroid disease | 4 (12.12) | 4 (4.44) | 0.209 |
| Cerebrovascular disease | 1 (3.03) | 0 | 0.268 |
| Venous thromboembolism | 0 | 1 (1.11) | 1.000 |
| Heart disease | 3 (9.09) | 2 (2.22) | 0.119 |
| Malignancy | 0 | 1 (1.11) | 1.000 |
| Variables | Late-onset SLE (N = 33) | Early-onset SLE (N = 90) | P-value |
|---|---|---|---|
| Data are expressed as mean (95% CI) or n (%) unless indicates otherwise. aTransformed data. *Statistically significant. ACR: American College of Rheumatology; ANA: anti-nuclear antibody; anti-dsDNA: anti-double stranded DNA antibody; anti-Sm: anti-Smith antibody; CI: confidence interval; LN: lupus nephritis; mSLEDAI-2K: modified systemic lupus erythematosus disease activity index-2000; n/N: number of positive tests/numbers of patients tested; SDI: ACR/Systemic Lupus Erythematosus International Collaborating Clinics (SLICC) damage index; SLE: systemic lupus erythematosus. | |||
| Mucocutaneous manifestation | 19 (57.58) | 64 (71.11) | 0.156 |
| Malar rash | 5 (15.15) | 34 (37.78) | 0.017* |
| Discoid rash | 11 (33.33) | 35 (38.89) | 0.573 |
| Oral ulcers | 7 (21.21) | 34 (37.78) | 0.084 |
| Photosensitivity | 5 (15.15) | 14 (15.56) | 0.956 |
| Nonerosive arthritis | 10 (30.30) | 54 (60.00) | 0.003* |
| Serositis | 13 (39.39) | 13 (14.44) | 0.003* |
| Pleuritis | 8 (24.24) | 10 (11.11) | 0.068 |
| Pericarditis | 8 (24.24) | 8 (8.89) | 0.025* |
| Lupus nephritis | 29 (87.88) | 58 (64.44) | 0.011* |
| Neurologic disorder | 4 (12.12) | 5 (5.56) | 0.215 |
| Seizures | 2 (6.06) | 2 (2.22) | 0.288 |
| Psychosis | 2 (6.06) | 3 (3.33) | 0.497 |
| Hematologic disorder | 25 (75.76) | 73 (81.11) | 0.513 |
| Hemolytic anemia | 18 (54.55) | 30 (33.71) | 0.036* |
| Leukopenia | 12 (36.36) | 46 (51.11) | 0.147 |
| Lymphopenia | 17 (51.52) | 62 (68.89) | 0.075 |
| Thrombocytopenia | 8 (24.24) | 16 (17.78) | 0.423 |
| Positive ANA, n (%) | 33 (100) | 89/89 (100) | |
| Immunologic disorder | |||
| Anti-dsDNA, n/N (%) | 20/29 (68.97) | 61/70 (87.14) | 0.033* |
| Anti-Sm, n/N (%) | 4/8 (50.00) | 4/10 (40.00) | 0.671 |
| Anticardiolipin, n/N (%) | 4/19 (21.05) | 10/40 (25.00) | 0.739 |
| Lupus anticoagulant, n/N (%) | 5/14 (35.71) | 9/29 (31.03) | 0.759 |
| Number of ACR criteria | 5.00 (4.58 - 5.42) | 5.24 (4.95 - 5.53) | 0.369 |
| mSLEDAI-2K at SLE diagnosisa | 9.46 (7.43 - 11.72) | 8.72 (7.46 - 10.07) | 0.563 |
| SDI at SLE diagnosis | 0.94 (0.61 - 1.27) | 0.13 (0.06 - 0.21) | < 0.001* |
| Variables | Late-onset SLE (N = 33) | Early-onset SLE (N = 90) | P-value |
|---|---|---|---|
| Data are expressed as mean (95% CI) or n (%) unless indicates otherwise. *Statistically significant. aHypertension was adjusted with underlying hypertension. bTransformed data. cUnavailable data in one. dDead in five and missing in one. eDead in five and unavailable data in two. fDead in three, unavailable data in two and study censor in one. gDead in three, unavailable data in one and study censor in four. LN: lupus nephritis; n: number of observations; n/N: number of positive tests or clinical manifestation/number of patients tested or had clinical manifestations; CI: confidence interval; eGFR: estimated glomerular filtration rate; RPGN: rapidly progressive glomerulonephritis; SLE: systemic lupus erythematosus; UPCR: urine protein-creatinine ratio. | |||
| Hypertensive episode during active LNa, n/N (%) (n) | 8/33 (24.24) (33) | 9/90 (10.00) (90) | 0.235 |
| Serum creatinine (mg/dL)b (n) | 0.84 (0.71 - 1.01) (33) | 0.83 (0.79 - 0.93) (90) | 0.888 |
| eGFR (mL/min/1.73 m2) (n) | 81.43 (67.56 - 95.31) (33) | 93.97 (86.49 - 101.45) (90) | 0.096 |
| < 30 mL/min/1.73 m2, n/N (%) | 2/33 (6.06) | 4/90 (4.44) | 0.712 |
| UPCRb (n) | 2.57 (2.04 - 3.25) (33) | 1.94 (1.63 - 2.31) (89) | 0.078 |
| UPCR ≥ 3.5, n/N (%) | 12/33 (36.36) | 23/89 (25.84) | 0.254 |
| Serum albumin (g/dL) (n) | 2.30 (2.06 - 2.53) (33) | 2.94 (2.79 - 3.09) (89) | < 0.001* |
| Low C3 level, n/N (%) | 19/28 (67.86) | 44/59 (74.58) | 0.512 |
| Low C4 level, n/N (%) | 16/27 (59.26) | 38/55 (69.09) | 0.378 |
| Anti-dsDNA, n/N (%) | 19/29 (65.52) | 50/58 (86.21) | 0.025* |
| RPGN, n/N (%) | 2/33 (6.06) | 5/90 (5.56) | 0.915 |
| Treatment | |||
| Prednisolone (mg/day) | 37.88 (34.22 - 41.53) | 36.06 (33.46 - 38.65) | 0.452 |
| < 0.5 mg/kg/day | 1 (3.03) | 19 (21.11) | 0.016* |
| ≥ 0.5 mg/kg/day | 32 (96.97) | 71 (78.89) | 0.016* |
| Intravenous methylprednisolone | 2 (6.06) | 5 (5.56) | 0.915 |
| Antimalarial drug | 14 (42.42) | 53 (58.89) | 0.104 |
| Immunosuppressive drug | 18 (54.54) | 53 (58.89) | 0.666 |
| Azathioprine | 2 (6.06) | 12 (13.33) | 0.260 |
| Cyclophosphamide | 10 (30.30) | 32 (35.56) | 0.586 |
| Intravenous cyclophosphamide | 5 (15.15) | 22 (24.44) | 0.270 |
| Oral cyclophosphamide | 6 (18.18) | 10 (11.11) | 0.302 |
| Mycophenolate mofetil | 6 (18.18) | 9 (10.00) | 0.219 |
| Renal outcomes | |||
| At 6 months, no. of events | 27d | 84f | |
| Serum creatinine (mg/dL) (n) | 0.99 (0.84 - 1.14) (27) | 0.81 (0.76 - 0.85) (82) | 0.019* |
| eGFR (mL/min/1.73 m2) (n) | 74.02 (64.59 - 83.45) (27) | 103.11 (97.52 - 108.71) (82) | < 0.001* |
| UPCRb (n) | 0.48 (0.27 - 0.85) (20) | 0.48 (0.35 - 0.66) (65) | 0.988 |
| Serum albumin (g/dL) (n) | 3.49 (3.20 - 3.79) (26) | 3.81 (3.69 - 3.93) (77) | 0.020* |
| Complete remission, n/N (%) | 14/26 (53.85) | 51/84 (60.71) | 0.534 |
| Partial remission, n/N (%) | 4/26 (15.38) | 6/84 (7.14) | 0.201 |
| No remission, n/N (%) | 8/26 (30.77)c | 27/84 (32.14) | 0.895 |
| At 12 months, no. of events | 26e | 82g | |
| Serum creatinine (mg/dL) (n) | 1.08 (0.89 - 1.26) (25) | 0.81 (0.76 - 0.86) (78) | 0.008* |
| eGFR (mL/min/1.73 m2) (n) | 69.36 (58.47 - 80.25) (25) | 103.89 (96.81 - 110.98) (78) | < 0.001* |
| UPCRb (n) | 0.40 (0.24 - 0.69) (19) | 0.49 (0.38 - 0.64) (61) | 0.473 |
| Serum albumin (g/dL) (n) | 3.55 (3.22 - 3.88) (24) | 3.90 (3.78 - 4.01) (73) | 0.051 |
| Complete remission, n/N (%) | 15/26 (57.69) | 49/82 (59.76) | 0.852 |
| Partial remission, n/N (%) | 3/26 (11.54) | 14/82 (17.07) | 0.500 |
| No remission, n/N (%) | 8/26 (30.77) | 19/82 (23.17) | 0.436 |
| Variables | Late-onset SLE (N = 33) | Early-onset SLE (N = 90) | P-value† |
|---|---|---|---|
| Data are expressed as mean (95% CI) or n (%) unless indicates otherwise. aTransformed data. bHypertension also was adjusted with underlying hypertension. cSome patients received combination of immunosuppressive drugs. dLaboratory not available in one. eDead in five and unavailable data in one. fDead in five, unavailable data in two and study censor in one. gDead in four, unavailable data in four, and study censor in six. hDead in four, unavailable data in eight and study censor in 12. *Statistically significant. †P-value was adjusted with duration of lupus nephritis. LN: lupus nephritis; n: number of observations; n/N: number of positive tests or clinical manifestation/number of patients tested or had clinical manifestations; CI: confidence interval; eGFR: estimated glomerular filtration rate; RPGN: rapidly progressive glomerulonephritis; SLE: systemic lupus erythematosus; UPCR: urine protein-creatinine ratio. | |||
| Total active LN events | 39 | 214 | |
| Duration of follow-up of LN (years)a | 3.68 (2.33 - 5.34) | 5.39 (2.33 - 5.34) | 0.073 |
| Frequency of LN flare (time/person) | 1.18 (0.84 - 1.61) | 2.38 (2.07 - 2.72) | 0.001* |
| Incidence of LN (per 100 person-years) | 2.00 (0.75 - 5.33) | 6.11 (4.32 - 8.64) | 0.020* |
| Incidence rate of active LN (95% CI)/per 100 person-years) | 5.78 (2.75 - 12.12) | 18.28 (13.93 - 24.00) | 0.001* |
| Hypertensive episode during active LNb, n/N (%) | 8/39 (20.51) | 55/214 (25.70) | 0.920 |
| Serum creatininea (mg/dL) (n) | 0.82 (0.71 - 0.98) (39) | 0.83 (0.79 - 0.87) (213) | 0.995 |
| eGFR (mL/min/1.73 m2) (n) | 79.33 (66.80 - 91.85) (39) | 92.57 (88.24 - 96.90) (213) | 0.016* |
| eGFR < 30, n/N (%) | 3/39 (7.69) | 7/213 (3.29) | 0.168 |
| UPCRa (n) | 2.58 (2.09 - 3.19) (39) | 2.20 (1.98 - 2.44) (212) | 0.238 |
| UPCR ≥ 3.5, n/N (%) | 13/39 (33.33) | 58/212 (27.36) | 0.499 |
| Serum albumin (g/dL) (n) | 2.43 (2.19 - 2.66) (39) | 3.13 (3.04 - 3.23) (212) | < 0.001* |
| Low C3 level, n/N (%) | 22/31 (70.97) | 70/114 (61.4) | 0.580 |
| Low C4 level, n/N (%) | 18/30 (60.00) | 65/109 (59.63) | 0.365 |
| Anti-ds DNA, n/N (%) | 21/32 (65.63) | 87/101 (86.14) | 0.011* |
| RPGN, n/N (%) | 3/39 (7.69) | 12/214 (5.61) | 0.671 |
| Treatment | |||
| Prednisolone (mg/day) | 32.99 (31.28 - 34.70) | 36.28 (32.88 - 39.68) | < 0.001* |
| < 0.5 mg/kg/day | 3 (7.69) | 84 (39.25) | < 0.001* |
| ≥ 0.5 mg/kg/day | 36 (92.31) | 130 (60.75) | 0.001* |
| Intravenous methylprednisolone | 2 (5.13) | 22 (10.28) | 0.319 |
| Antimalarial drug | 16 (41.03) | 98 (45.79) | 0.196 |
| Immunosuppressive drugc | 23 (58.97) | 168 (78.50) | 0.009* |
| Azathioprine | 2 (5.13) | 31 (14.49) | 0.111 |
| Cyclophosphamide | 11 (28.21) | 88 (41.12) | 0.128 |
| Intravenous cyclophosphamide | 5 (12.82) | 61 (28.50) | 0.040* |
| Oral cyclophosphamide | 7 (17.95) | 27 (12.62) | 0.369 |
| Calcineurin inhibitor | 1 (2.56) | 5 (2.34) | 0.932 |
| Mycophenolate mofetil | 10 (25.64) | 55 (25.70) | 0.994 |
| Renal outcomes | |||
| At 6 months, events | 33e | 200g | |
| Serum creatinine (mg/dL) (n) | 1.01 (0.88 - 1.14) (33) | 0.86 (0.81 - 0.91) (194) | 0.011* |
| eGFR (mL/min/1.73 m2) (n) | 72.93 (64.42 - 81.44) (33) | 97.47 (93.53 - 101.42) (194) | < 0.001* |
| UPCRa (n) | 0.57 (0.34 - 0.95) (26) | 0.71 (0.60 - 0.85) (170) | 0.630 |
| Serum albumin (g/dL) (n) | 3.53 (3.29 - 3.78) (32) | 3.72 (3.64 - 3.81) (186) | 0.086 |
| Complete remission, n/N (%) | 17/32 (53.13) | 83/200 (41.50) | 0.494 |
| Partial remission, n/N (%) | 5/32 (15.63) | 36/200 (18.00) | 0.942 |
| No remission, n/N (%) | 10/32 (31.25)d | 81/200 (40.50) | 0.491 |
| At 12 months, events | 31f | 193h | |
| Serum creatinine (mg/dL)a (n) | 0.95 (0.85 - 1.06) (30) | 0.79 (0.76 - 0.82) (187) | 0.001* |
| eGFR (mL/min/1.73 m2) (n) | 70.73 (61.02 - 80.43) (30) | 97.60 (93.32 - 101.88) (187) | < 0.001* |
| UPCRa (n) | 0.44 (0.28 - 0.70) (23) | 0.65 (0.54 - 0.77) (163) | 0.259 |
| Serum albumin (g/dL) (n) | 3.66 (3.38 - 3.94) (29) | 3.83 (3.76 - 3.91) (181) | 0.157 |
| Complete remission, n/N (%) | 18/31 (58.06) | 92/193 (47.67) | 0.452 |
| Partial remission, n/N (%) | 4/31 (12.90) | 39/193 (20.21) | 0.423 |
| No remission, n/N (%) | 9/31 (29.03) | 62/193 (32.12) | 0.873 |
| Variables | Late-onset SLE (N = 33) | Early-onset SLE (N = 90) | P-value | |
|---|---|---|---|---|
| P1 | P2 | |||
| P1: P-value adjusted with duration of lupus nephritis. P2: P-value adjusted with duration of lupus nephritis and underlying diseases at SLE diagnosis (hypertension and diabetes mellitus). *Statistically significant. †Adjusted with underlying diseases at SLE diagnosis (hypertension and diabetes mellitus). SLE: systemic lupus erythematosus. | ||||
| Death (N, %) | 9 (27.27) | 6 (6.67) | 0.014* | 0.013* |
| Infection (N, %) | 9 (100) | 5 (83.33) | 0.379 | 0.476 |
| Associated with SLE (N, %) | 3 (33.33) | 3 (50.00) | 0.554 | 0.265 |
| Cardiovascular disease (N, %) | 0 | 1 (16.67) | 0.386 | 0.484 |
| Incidence rate of death (95% CI)/100 person-years) | 5.61 (2.92 - 10.78) | 1.02 (0.46 - 2.26) | 0.004*† | |