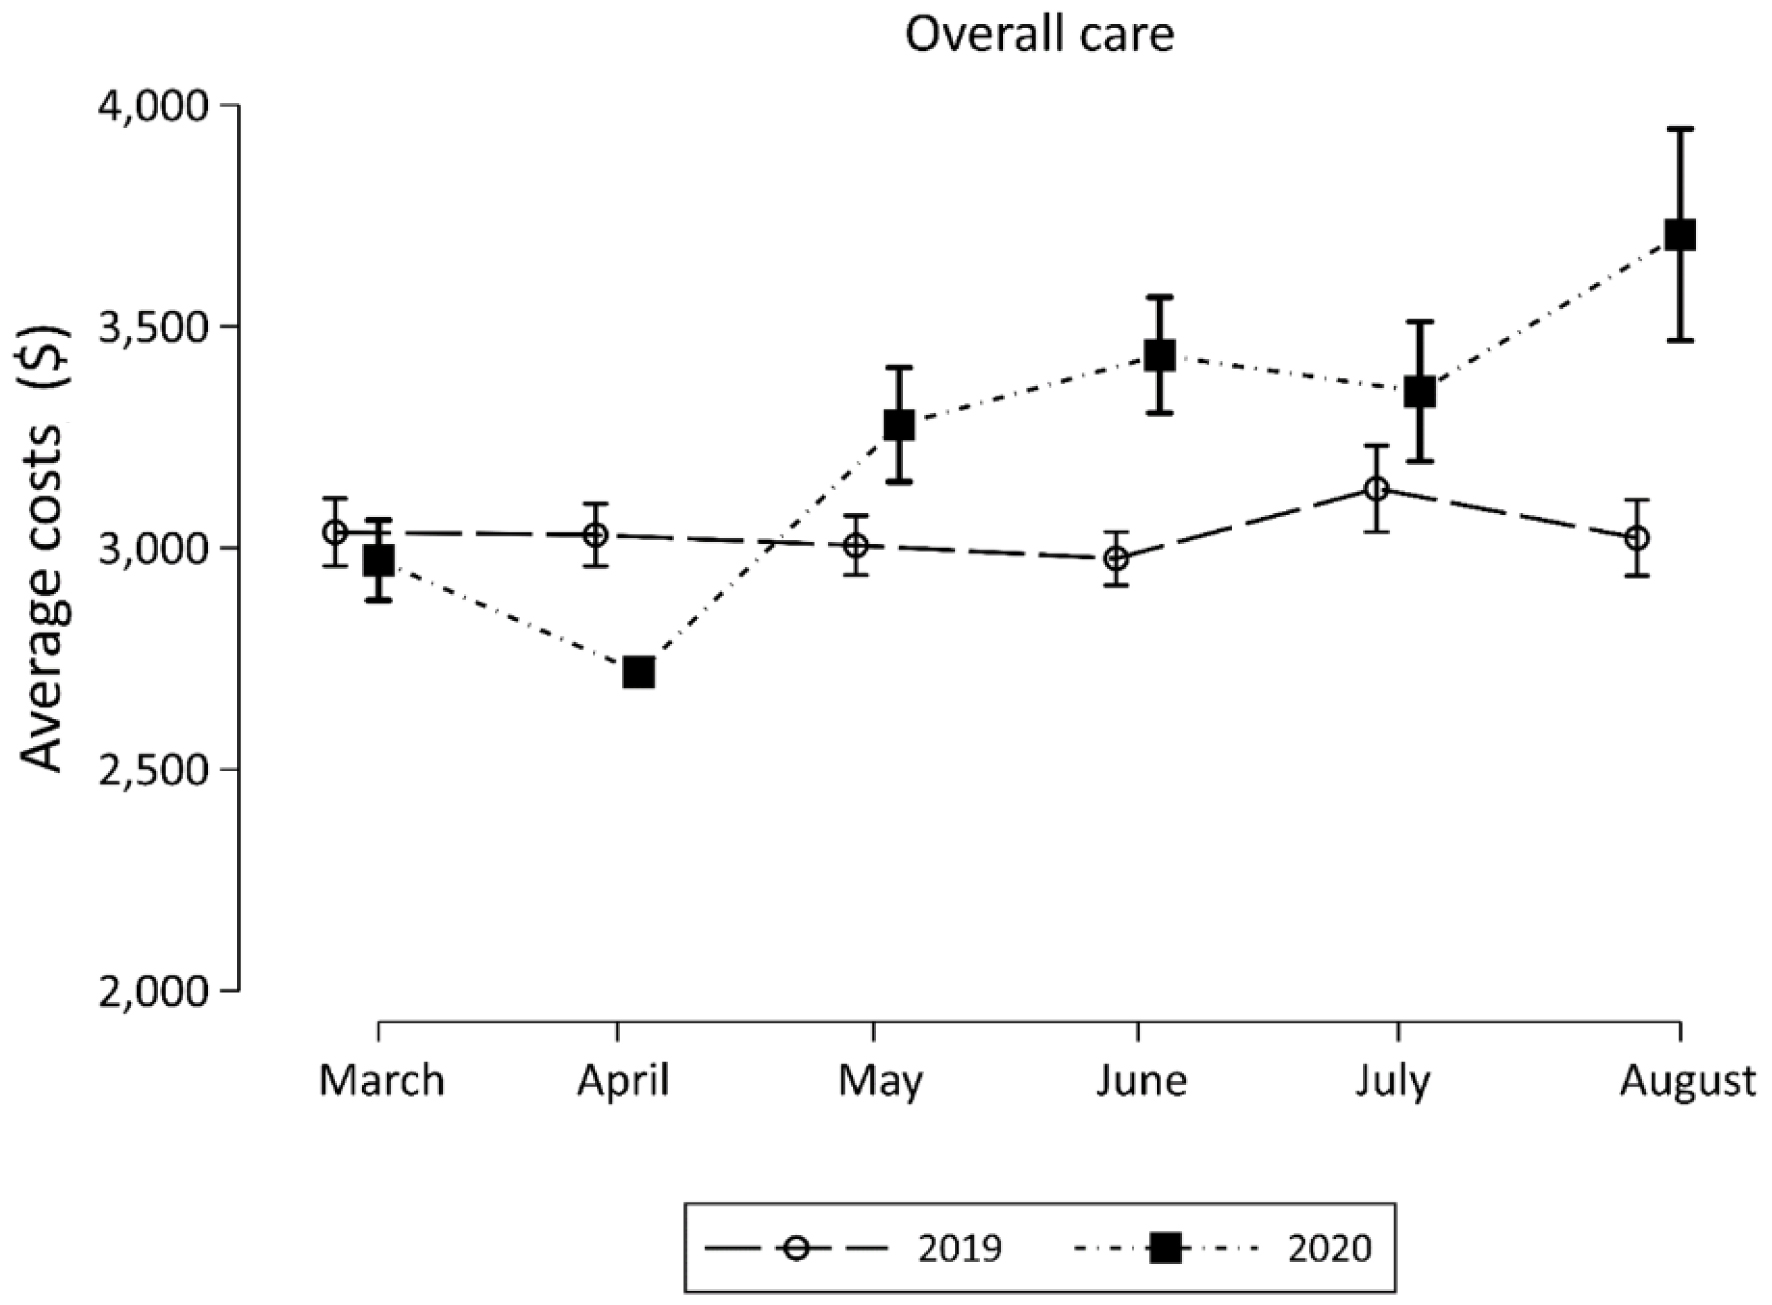
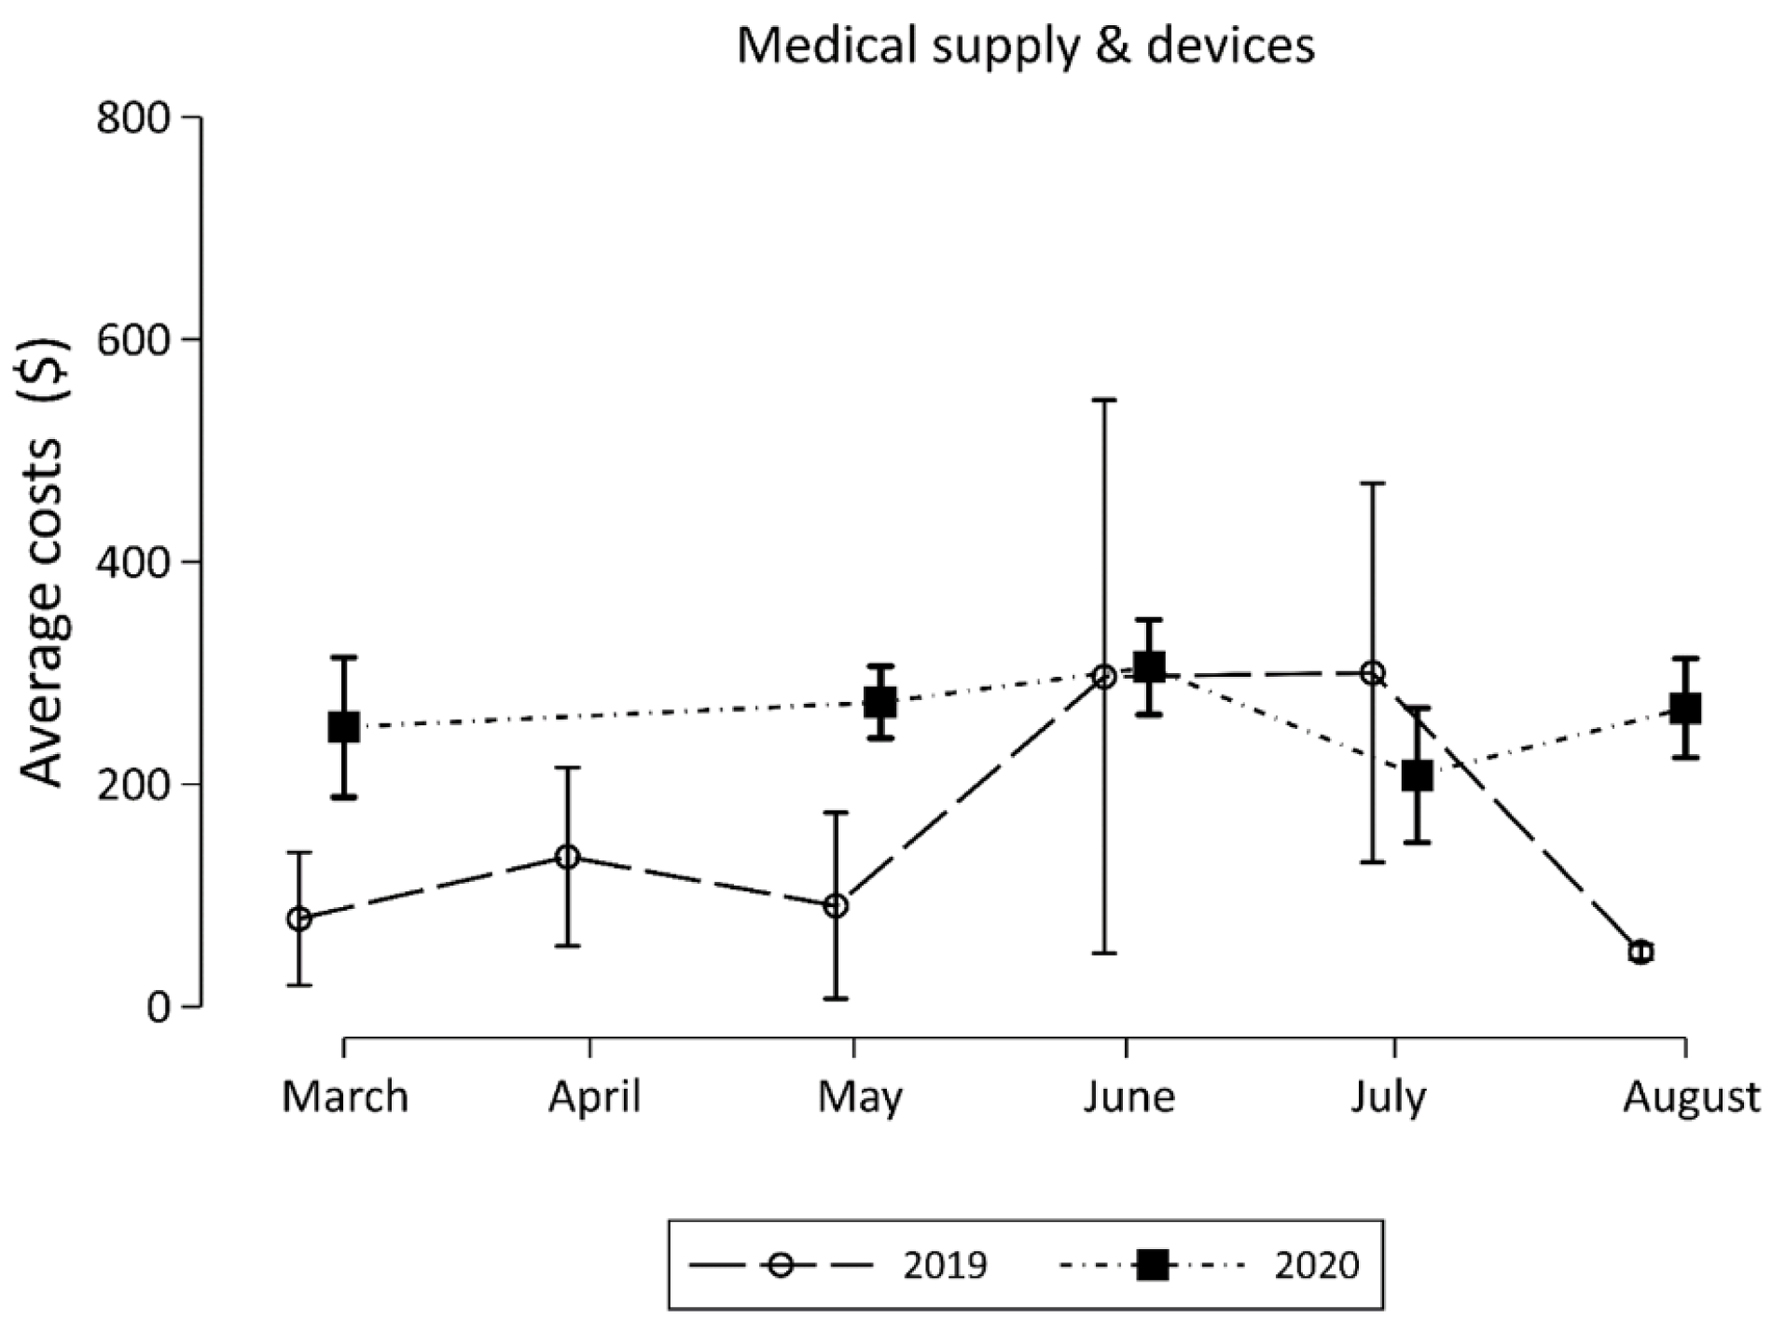
Figure 1. Average cost of overall care during April - August in 2019 compared to April - August 2020.
| Journal of Clinical Medicine Research, ISSN 1918-3003 print, 1918-3011 online, Open Access |
| Article copyright, the authors; Journal compilation copyright, J Clin Med Res and Elmer Press Inc |
| Journal website https://www.jocmr.org |
Original Article
Volume 16, Number 2-3, March 2024, pages 56-62
Economic Impact of COVID-19 on a Free-Standing Pediatric Ambulatory Center
Figures
Tables
| Characteristics | Overall | 2019 | 2020 | P-value |
|---|---|---|---|---|
| The data are listed as number (%). BMI: body mass index; sCHIP: Children’s Health Insurance Program; ASA: American Society of Anesthesiologists. | ||||
| Study population | 1,797 (100.0) | 1,175 (65.4) | 622 (34.6) | |
| Male gender | 960 (53.6) | 632 (54.1) | 328 (52.8) | 0.615 |
| Race/ethnicity | ||||
| Non-Hispanic White | 1,420 (80.8) | 938 (81.6) | 482 (79.3) | 0.348 |
| Non-Hispanic Black | 164 (9.3) | 108 (9.4) | 56 (9.2) | |
| Other | 153 (8.7) | 93 (8.1) | 60 (9.9) | |
| Hispanic | 21 (1.2) | 11 (1) | 10 (1.6) | |
| Age in years | ||||
| ≤ 5 | 93 (5.2) | 36 (3.1) | 57 (9.2) | < 0.001 |
| 6 - 12 | 438 (24.5) | 249 (21.3) | 189 (30.4) | |
| ≥ 13 | 1,259 (70.3) | 884 (75.6) | 375 (60.4) | |
| ASA physical classification | ||||
| 1 | 903 (50.4) | 616 (52.7) | 287 (46.2) | 0.001 |
| 2 | 870 (48.6) | 548 (46.9) | 322 (51.9) | |
| 3 | 17 (0.9) | 5 (0.4) | 12 (1.9) | |
| BMI category (for patients ≥ 2 years of age) | ||||
| Underweight | 85 (8) | 58 (9) | 27 (6.4) | 0.096 |
| Normal weight | 714 (66.8) | 439 (68.1) | 275 (64.9) | |
| Overweight | 168 (15.7) | 90 (14) | 78 (18.4) | |
| Obese | 102 (9.5) | 58 (9) | 44 (10.4) | |
| Insurance | ||||
| Private/commercial | 965 (53.9) | 653 (55.9) | 312 (50.2) | 0.117 |
| Medicaid/sCHIP; private/commercial | 124 (6.9) | 75 (6.4) | 49 (7.9) | |
| Medicaid/sCHIP | 690 (38.5) | 433 (37) | 257 (41.4) | |
| Self-pay | 11 (0.6) | 8 (0.7) | 3 (0.5) | |
| Services | Average cost (dollars) | Cost ratio (2020 vs. 2019) | P-value | |
|---|---|---|---|---|
| 2019 | 2020 | |||
| The average cost is listed in dollars with 95% confidence intervals. | ||||
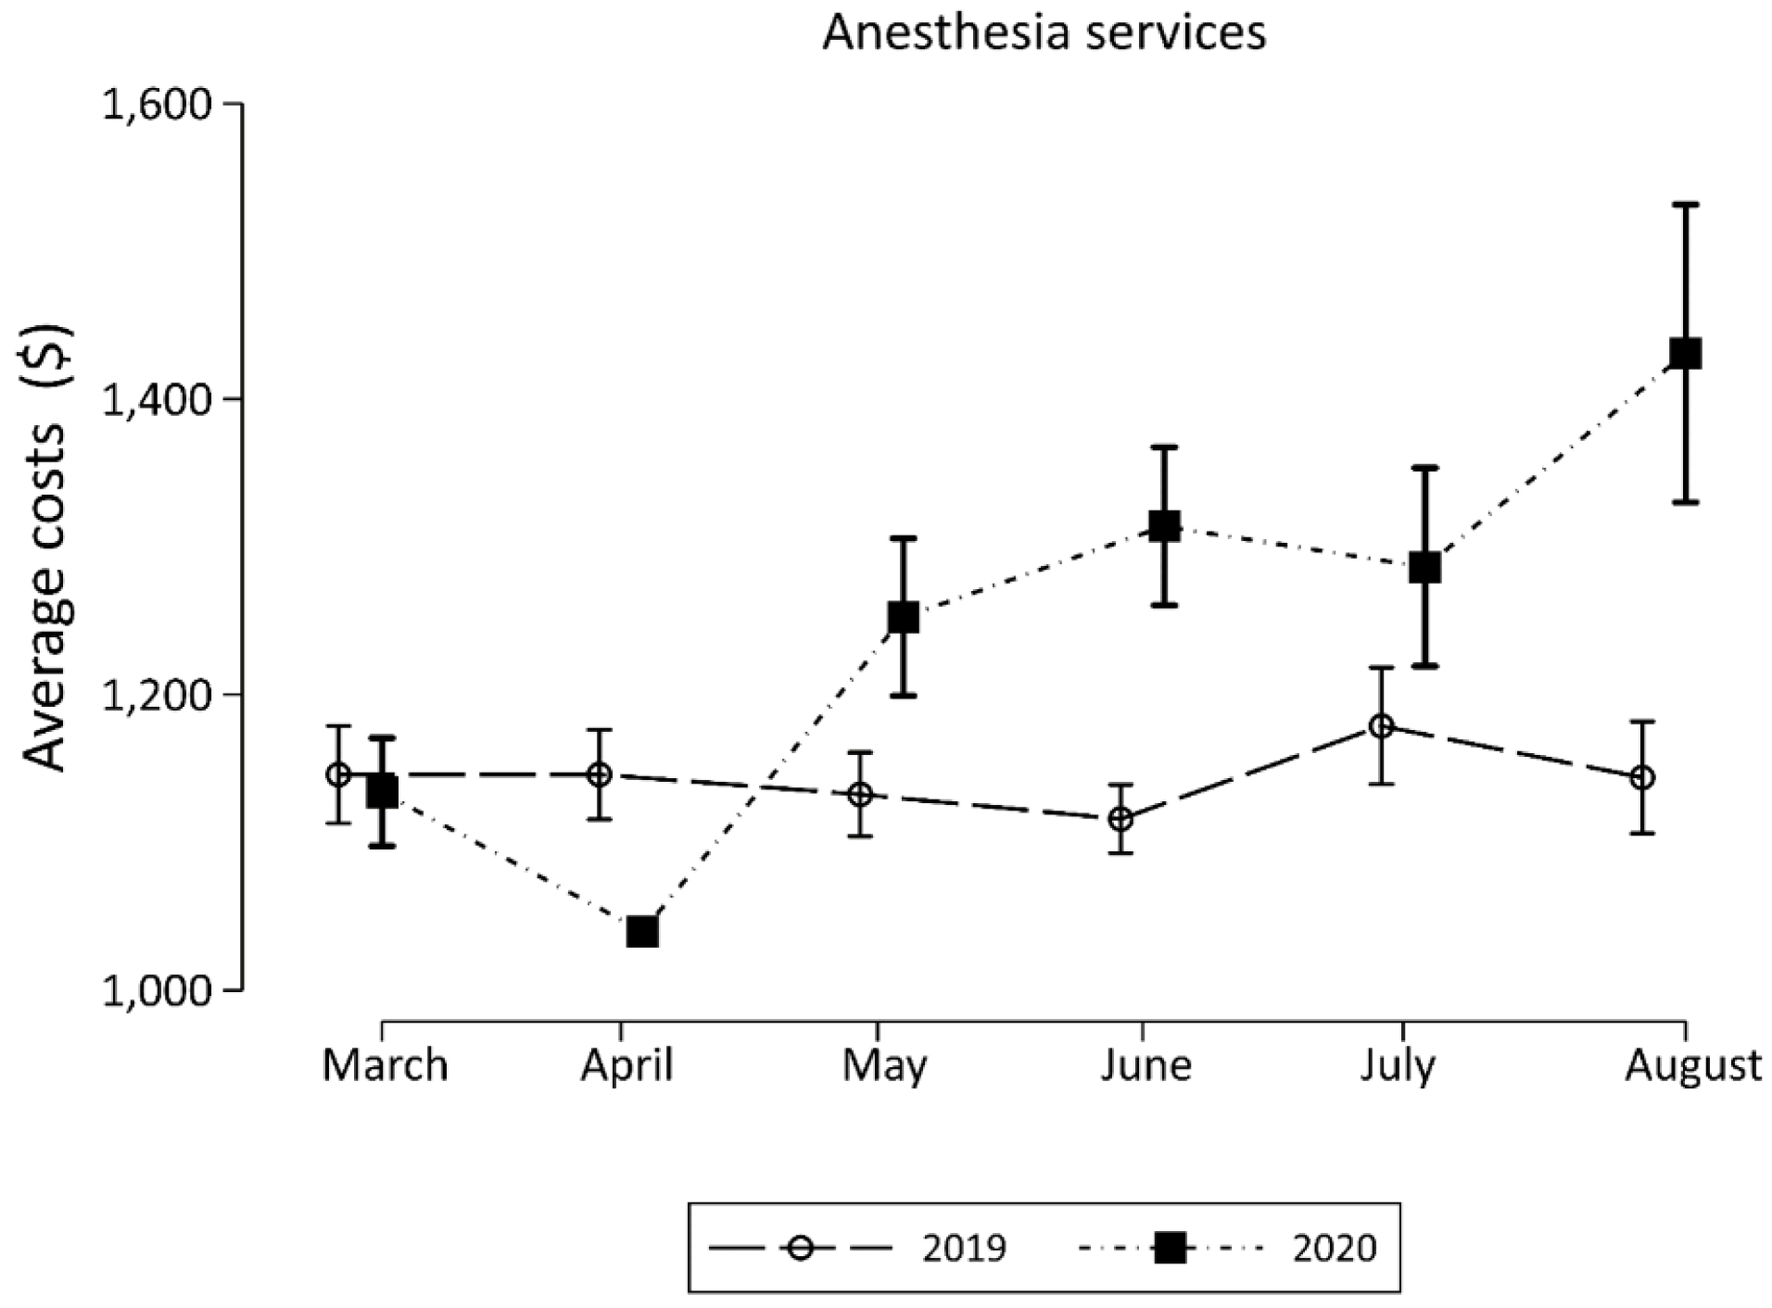
| Anesthesia services | 1,143 (1,130, 1,156) | 1,268 (1,241, 1,295) | 1.11 (1.08, 1.14) | < 0.001 |
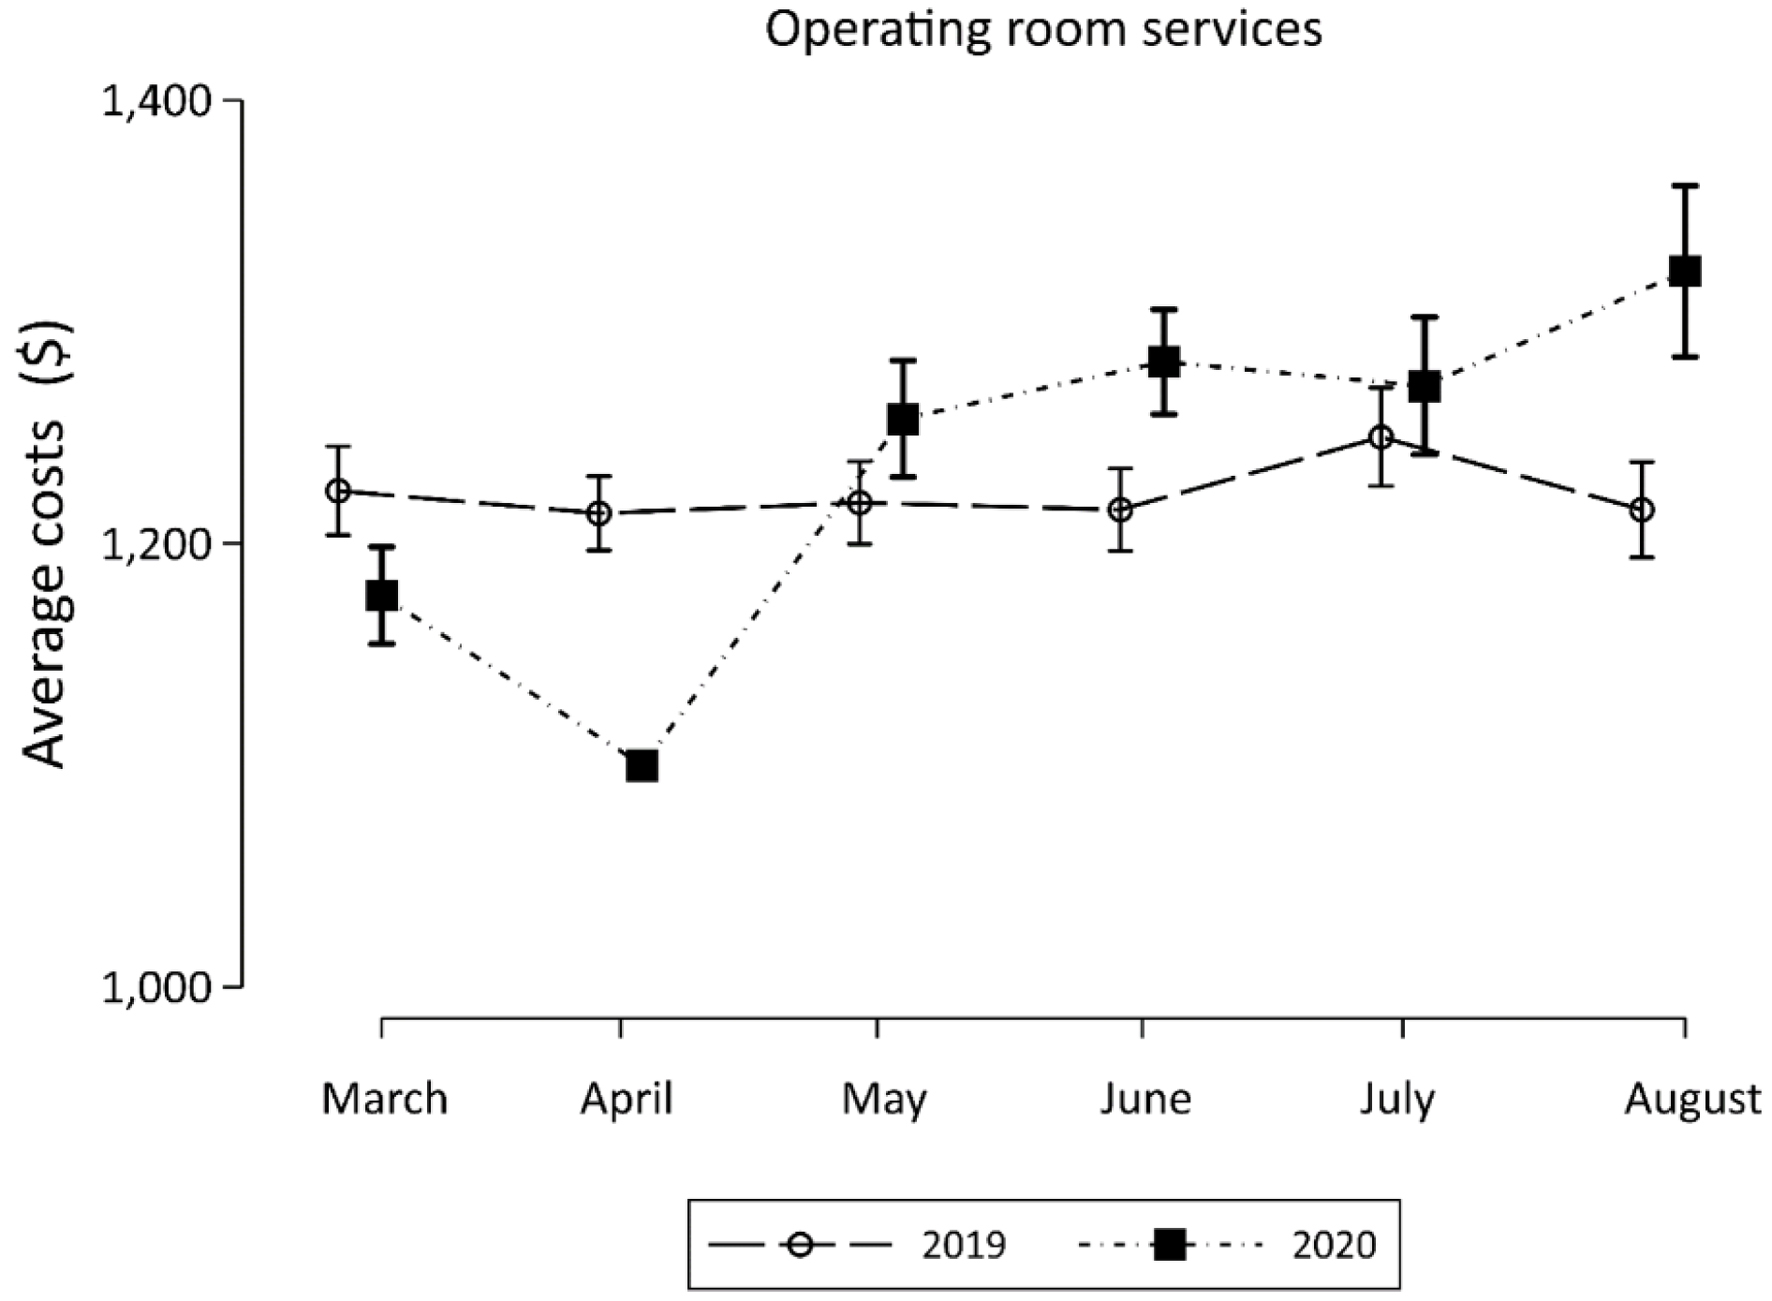
| Operating room services | 1,221 (1,213, 1,229) | 1,255 (1,243, 1,268) | 1.03 (1.02, 1.04) | < 0.001 |
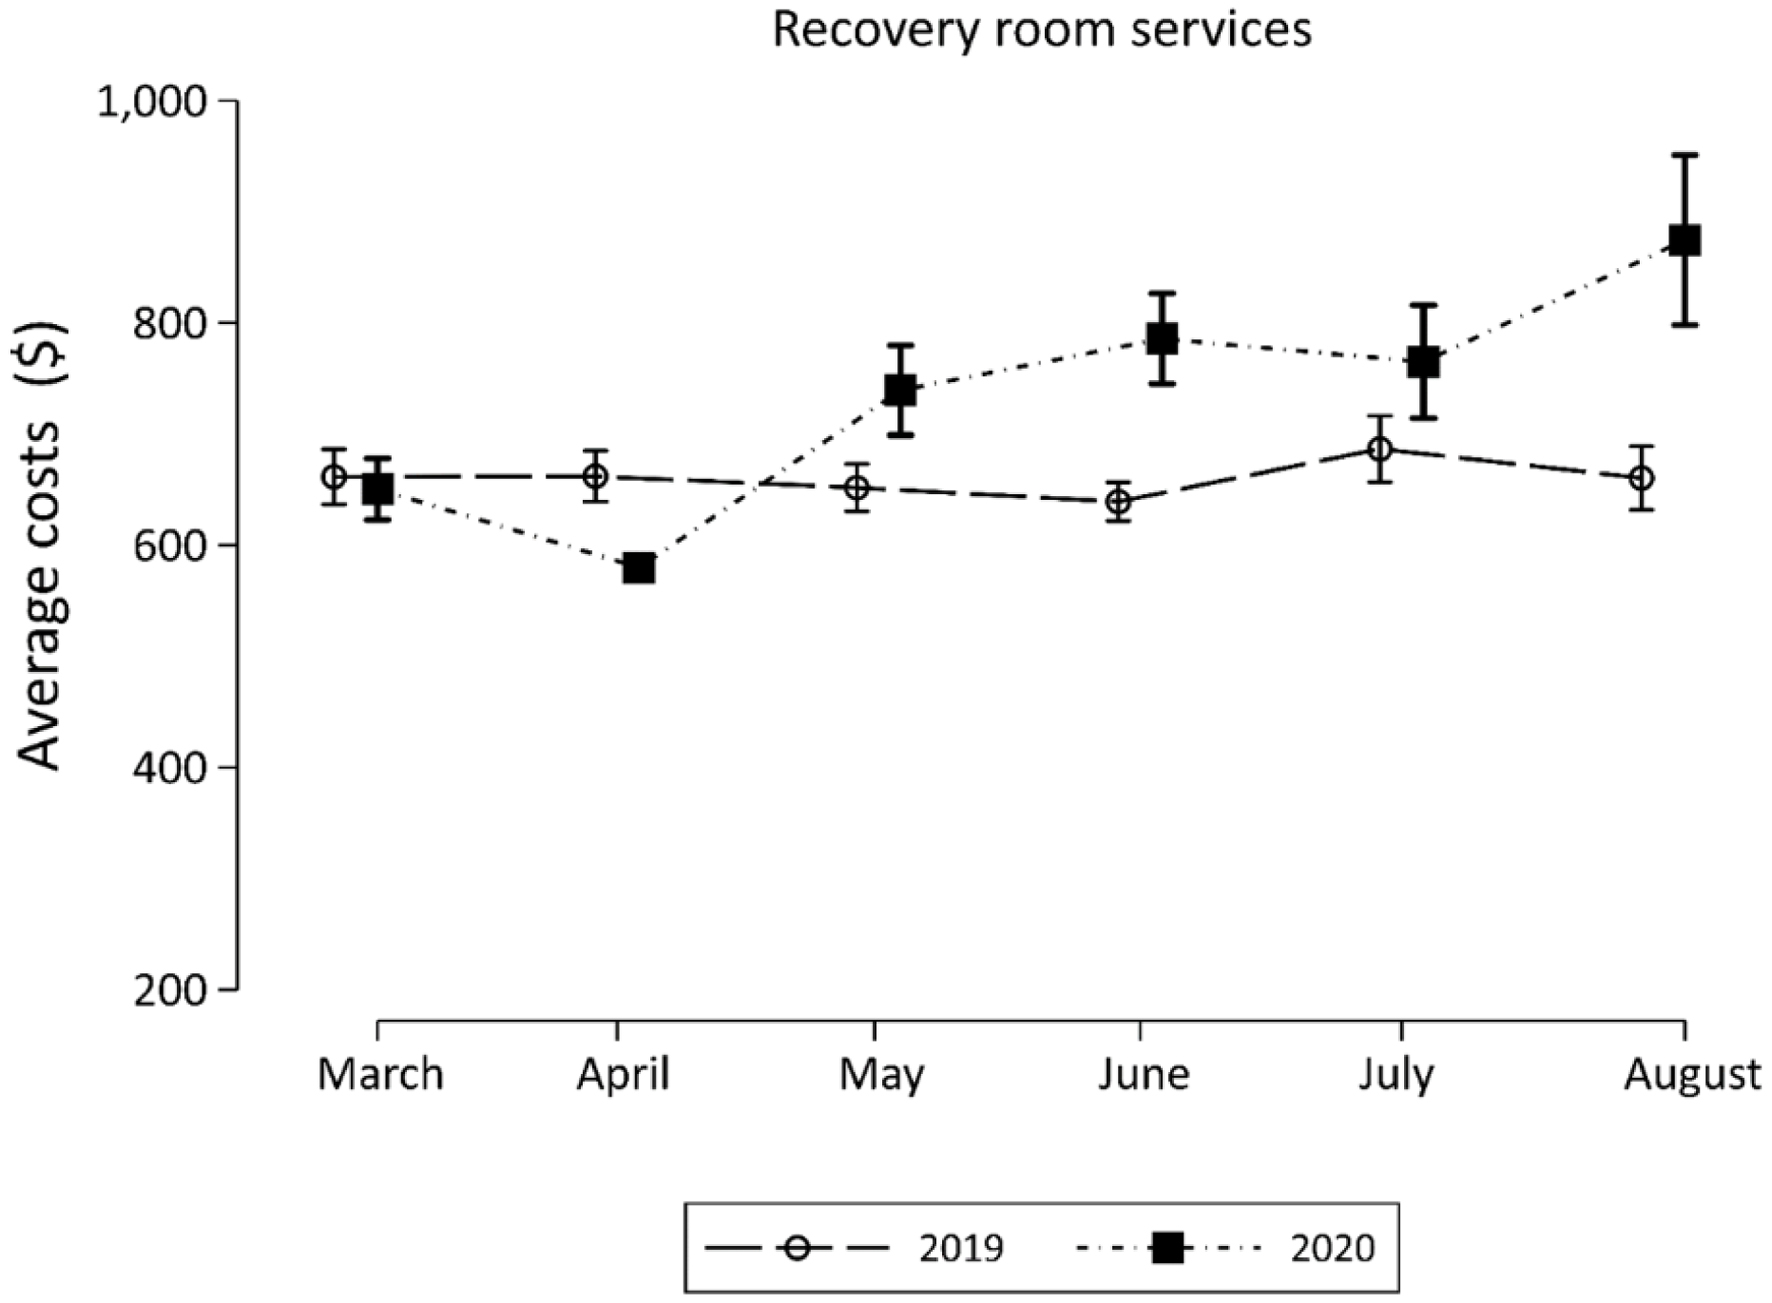
| Recovery room services | 659 (649, 669) | 751 (731, 772) | 1.14 (1.10, 1.18) | < 0.001 |
| Supply and medical devices | 150 (97, 202) | 271 (248, 294) | 1.81 (1.26, 2.6) | 0.001 |
| Overall | 3,030 (2,999, 3,061) | 3,313 (3,248, 3,378) | 1.09 (1.07, 1.12) | < 0.001 |