Journal of Clinical Medicine Research, ISSN 1918-3003 print, 1918-3011 online, Open Access
Article copyright, the authors; Journal compilation copyright, J Clin Med Res and Elmer Press Inc
Journal website https://www.jocmr.org

Original Article

Volume 16, Number 6, June 2024, pages 293-301


Comparison Between Twenty-Four-Hour Collection and Single Spot Urines for the Detection of Biogenic Amines by High-Performance Liquid Chromatography Tandem Mass Spectrometry

Figures

Figure 1.
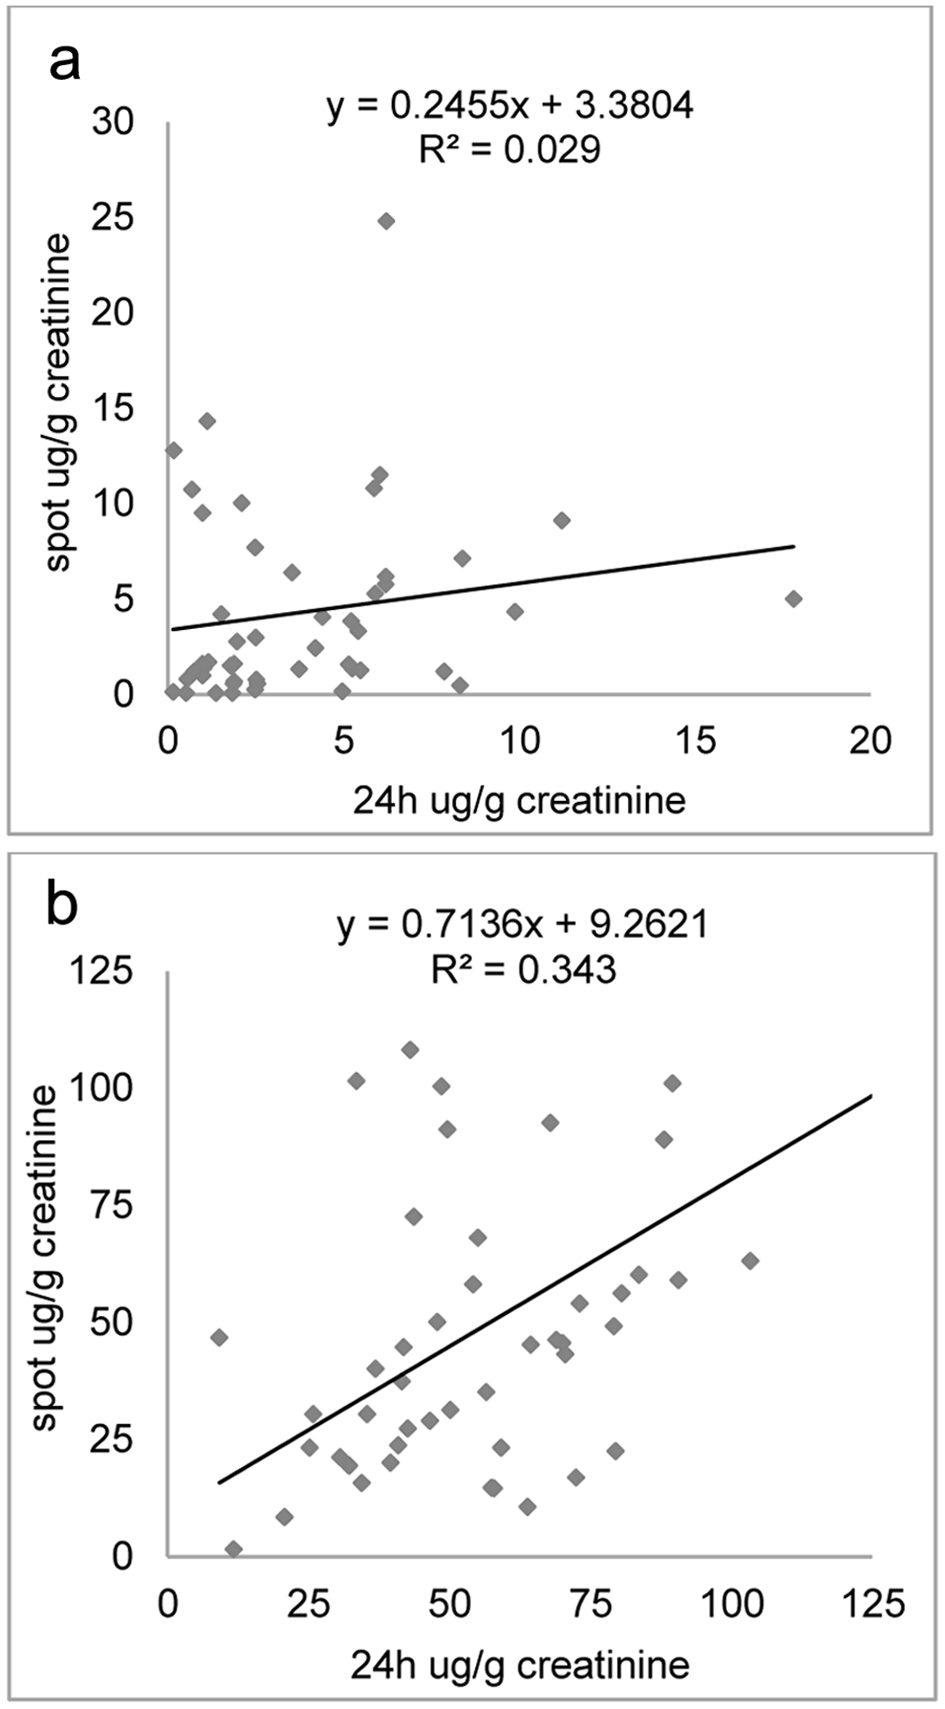
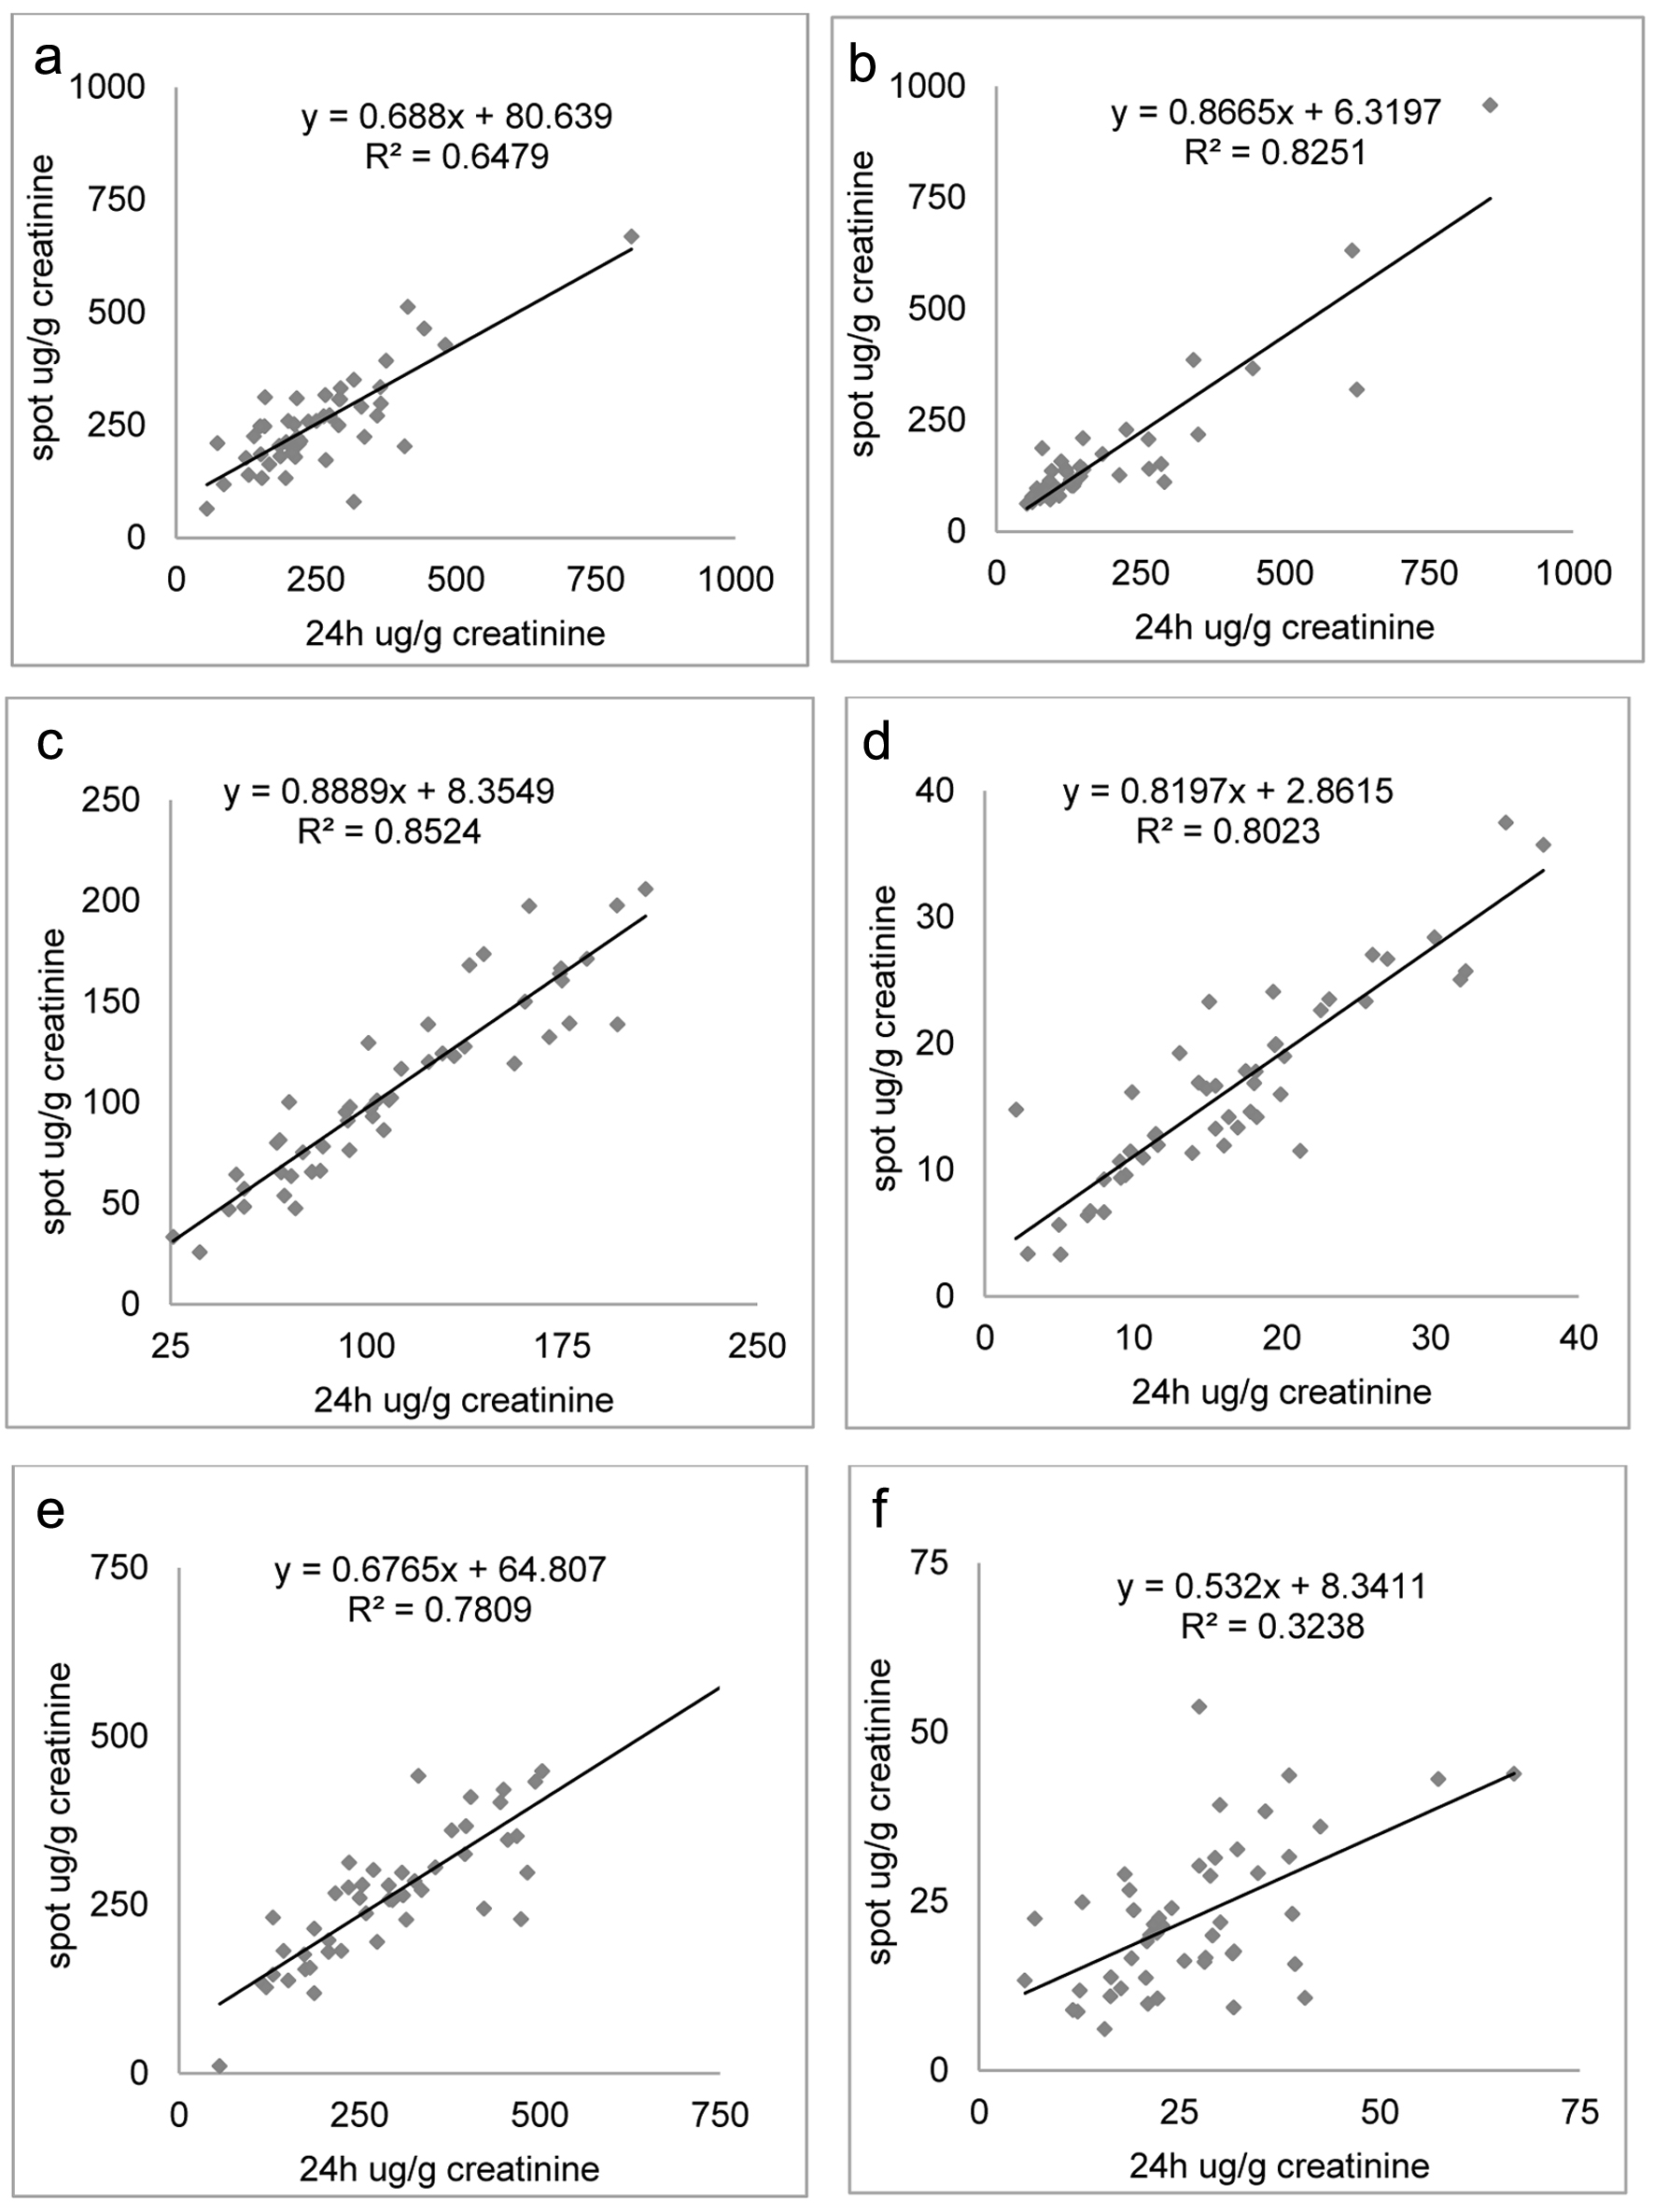
Figure 1. Correlation plots between dopamine (a), 3-methoxytyramine (b), total metanephrine (c), free metanephrine (d), total normetanephrine (e), and free normetanephrine (f) as a ratio to creatinine concentration measured in 24-h collection and spot urine samples.
Figure 2.
Figure 2. Correlation plots between epinephrine (a) and norepinephrine (b) as a ratio to creatinine concentration measured in 24-h collection and spot urine samples.
Figure 3.
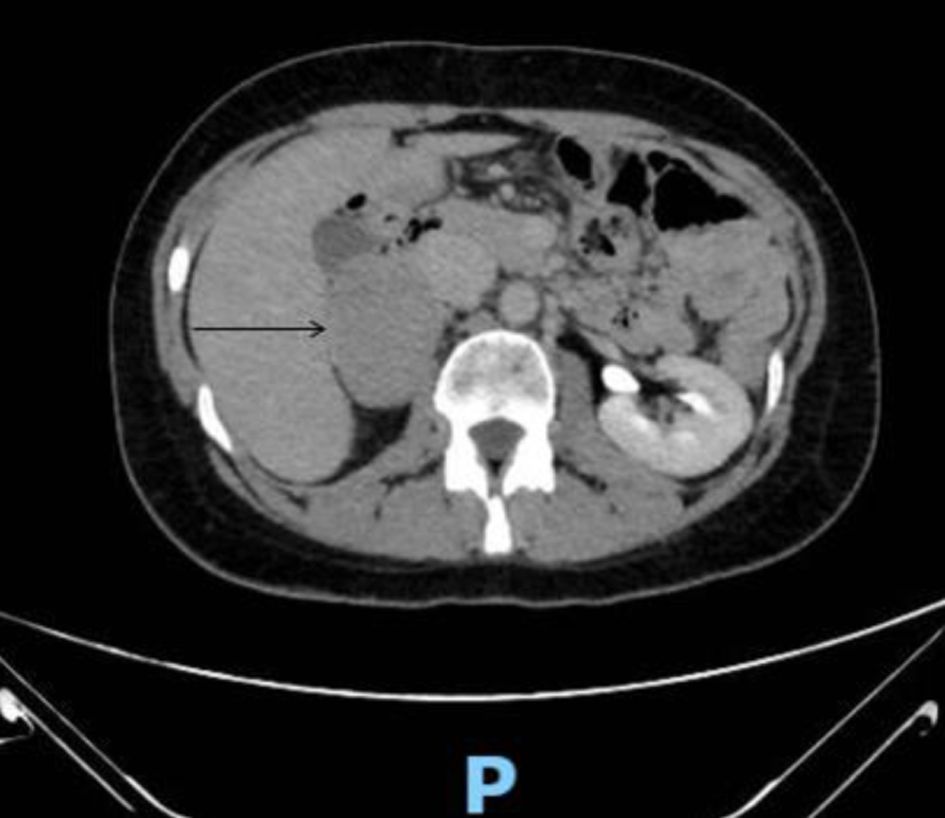
Figure 3. Computed tomography (CT) performed with the administration of an intravenous contrast media showed a well-defined, large and roundish mass (50 × 60 mm) in the right adrenal gland. The neoformation had a weak and uneven enhancement in the dynamic phases (arrow).

Tables

Table 1. General Clinical Characteristics of the Study Population
 
Clinical characteristicsPatients, n (%)
PPGL: pheochromocytomas and paragangliomas.
Gender
  Male25 (50%)
  Female25 (50%)
Age, years
  18 - 4916 (32%)
  50 - 6413 (26%)
  ≥ 6521 (42%)
Inclusion criteria: clinical suspicion of PPGL
  Presence of signs
    Hypertension43 (86%)
    Tachycardia29 (58%)
    Sweating23 (46%)
    Hyperglycemia20 (40%)
    Pallor19 (38%)
    Weight loss3 (6%)
    Decreased peristalsis2 (4%)
  Presence of symptoms
    Headache41 (82%)
    Anxiety36 (72%)
    Weakness, fatigue35 (70%)
    Palpitations25 (50%)
    Nausea and vomiting14 (28%)
Exclusion criteria
  Simultaneous therapy with drugs that modify catecholamine metabolism0 (0%)
  Not correct sample collection and storage0 (0%)


Table 2. Binary Gradient Used for HPLC
 
Time (min)Phase APhase B
HPLC: high-performance liquid chromatography.
0.00100
1.00100
2.01090
2.11090
2.53070
2.60100
3.90100
4.00100


Table 3. MRM Transitions and Retention Time Parameters for Catecholamines and Their Metabolites
 
AnalytePrecursor (Q1) mass (Da)Fragment (Q3) mass (Da)XIC width (Da)Retention time (min)
3-MT: 3-methoxytyramine; DA: dopamine; E: epinephrine; NE: norepinephrine; MN: metanephrine; NMN: normetanephrine; MRM: multiple reaction monitoring; XIC: extracted ion chromatograms.
DA154910.21.51
E1841660.21.75
NE1701520.22.73
MN1981650.20.96
NMN1841340.21.37
3-MT168910.20.90
IS DA D4158950.21.49
IS E D61901130.21.74
IS NE D61761580.22.73
IS MN D32011830.20.96
IS NMN D31871370.21.35


Table 4. PCC Obtained for DA, 3-MT, Total MN and Free MN, Total NMN and Free NMN and Type of Correlation Between Data of 24-h and Spot Urine Samples
 
DA3-MTTotal MNFree MNTotal NMNFree NMN
PCC: Pearson’s correlation coefficient; 3-MT: 3-methoxytyramine; DA: dopamine; MN: metanephrine; NMN: normetanephrine.
PCC0.7880.8890.9040.8770.8650.777
CorrelationStrongStrongStrongStrongStrongIntermediate


Table 5. Biogenic Amines Concentrations (µg/g Creatinine) of the Two Pathological Patients, Obtained Analyzing Both Spot and 24-h Urine Samples
 
DAENETotal MNFree MNTotal NMNFree NMN3-MT
3-MT: 3-methoxytyramine; E: epinephrine; NE: norepinephrine; DA: dopamine; MN: metanephrine; NMN: normetanephrine.
Patient 1
  Spot urine410.024.010,685.6380.659.725,057.54,321.8935.1
  24-h urine502.437.610,071.4228.955.224,878.53,909.5900.7
Patient 2
  Spot urine317.771.4360.33,454.7526.04,917.7998.3248.9
  24-h urine208.492.7301.84,374.2583.44619.0856.0298.0