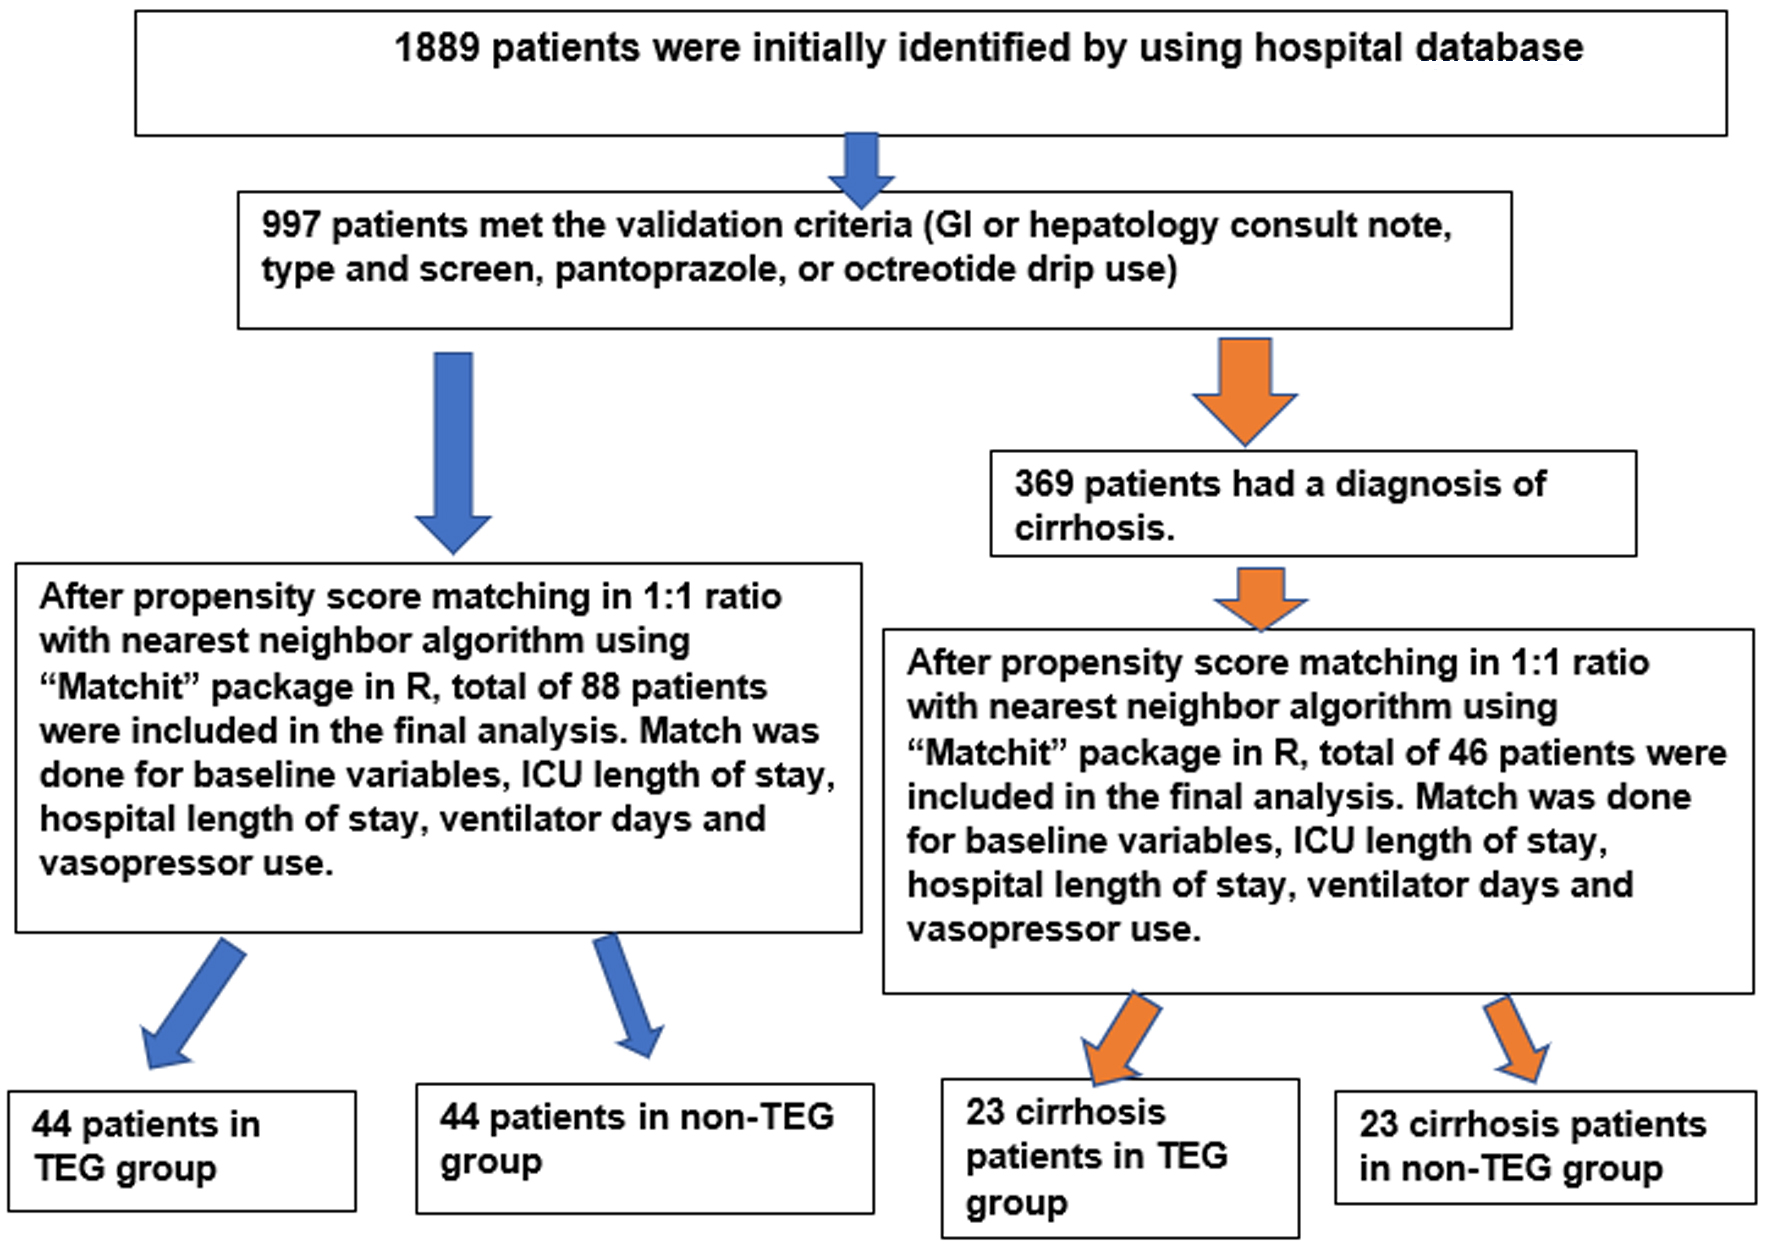
Figure 1. The patient inclusion in study flow chart. GI: gastrointestinal; ICU: intensive care unit; TEG: thromboelastography.
| Journal of Clinical Medicine Research, ISSN 1918-3003 print, 1918-3011 online, Open Access |
| Article copyright, the authors; Journal compilation copyright, J Clin Med Res and Elmer Press Inc |
| Journal website https://www.jocmr.org |
Original Article
Volume 15, Number 10-11, December 2023, pages 431-437
A Retrospective Study Comparing the Effect of Conventional Coagulation Parameters Vs. Thromboelastography-Guided Blood Product Utilization in Patients With Major Gastrointestinal Bleeding
Figure
Tables
| Patient demographics | TEG group (n = 44) | Non-TEG group (n = 44) | P-value | TEG cirrhosis sub-group (n = 23) | Non-TEG cirrhosis sub-group (n = 23) | P-value | Test of significance |
|---|---|---|---|---|---|---|---|
| aPTT: activated partial thromboplastin time; ICU: intensive care unit; INR: international normalized ratio; IV: intravenous; LOS: length of stay; SOFA: sequential organ failure assessment; TEG: thromboelastography. | |||||||
| Age (mean) | 56.5 | 57.7 | 0.66 | 52 | 51 | 0.79 | t-test |
| Gender | Chi-square test | ||||||
| Male (%) | 63.6 | 52.3 | 0.28 | 61 | 70 | 0.54 | |
| Female (%) | 36.4 | 47.7 | 39 | 30 | |||
| Race | Chi-square test | ||||||
| Caucasian | 95.5 | 95.5 | 1.0 | 91.3 | 91.3 | 1.0 | |
| Comorbidities | |||||||
| Diabetes (%) | 40.9 | 43.2 | 0.83 | 30.4 | 39.1 | 0.54 | Chi-square test |
| Hypertension (%) | 43.2 | 43.2 | 1.00 | 43.5 | 52.2 | 0.56 | Chi-square test |
| Chronic kidney disease (%) | 31.8 | 25 | 0.48 | 30.4 | 22.0 | 0.50 | Chi-square test |
| Congestive heart failure (%) | 11.4 | 6.8 | 0.46 | 4.3 | 0.0 | 0.31 | Chi-square test |
| Hepatic encephalopathy (%) | 6.8 | 6.8 | 1.00 | 13 | 13 | 1.00 | Fisher’s exact test |
| Ascites (%) | 22.7 | 27.3 | 0.62 | 17.4 | 21.7 | 0.71 | Chi-square test |
| Laboratory values | |||||||
| Sodium (mean) | 140 mEq/L | 141 mEq/L | 0.44 | 140 mEq/L | 138 mEq/L | 0.43 | t-test |
| Blood urea nitrogen (mean) | 41.39 mg/dL | 39.73 mg/dL | 0.33 | 37 mg/dL | 36 mg/dL | 0.56 | Mann-Whitney U test |
| Creatinine (mean) | 1.86 mg/dL | 1.82 mg/dL | 0.51 | 1.7 mg/dL | 1.8 mg/dL | 0.90 | Mann-Whitney U test |
| Hemoglobin (mean) | 7.8 mg/dL | 8.0 mg/dL | 0.65 | 7.8 mg/dL | 8.2 mg/dL | 0.95 | t-test |
| Platelet (mean) | 1.22 × 10⁵/µL | 1.27 × 10⁵/µL | 0.71 | 7.4 × 10⁴/µL | 8.8 × 10⁴/µL | 0.95 | Mann-Whitney U test |
| INR (mean) | 2.12 | 2.01 | 0.98 | 2.4 | 2.3 | 0.92 | Mann-Whitney U test |
| aPTT (mean) | 44 s | 43 s | 0.93 | 47 s | 45 s | 0.92 | Mann-Whitney U test |
| Albumin (mean) | 2.0 g/dL | 2.0 g/dL | 0.98 | 2.1 g/dL | 2.1 g/dL | 0.52 | t-test |
| Bilirubin (mean) | 4.8 mg/dL | 3.9 mg/dL | 0.28 | 7.1 mg/dL | 6 mg/dL | 0.38 | Mann-Whitney U test |
| Hospital anticoagulation use | |||||||
| Anti-platelets (%) | 18.2 | 9.1 | 0.21 | 13 | 8.7 | 1.00 | Fisher’s exact test |
| Enoxaparin (%) | 27.3 | 29.5 | 0.81 | 4.3 | 4.3 | 1.00 | Chi-square test |
| Heparin drip (%) | 6.8 | 6.8 | 1.00 | 4.3 | 0.0 | 1.00 | Fisher’s exact test |
| Heparin subcutaneous (%) | 43.2 | 31.8 | 0.27 | 26 | 14 | 0.47 | Chi-square test |
| Home beta-blocker use | |||||||
| Propranolol (%) | 2.3 | 2.3 | 1.00 | 4.3 | 8.7 | 1.00 | Fisher’s exact test |
| Nadolol (%) | 6.8 | 9.1 | 1.00 | 13 | 4.3 | 0.61 | Fisher’s exact test |
| SOFA score (mean) | 11 | 10.8 | 0.66 | 12.6 | 12.6 | 0.96 | t-test |
| Proton pump inhibitor use | |||||||
| IV pantoprazole twice a day (%) | 70.5 | 61.4 | 0.37 | 52.2 | 52.2 | 1.00 | Chi-square test |
| Pantoprazole drip (%) | 77.3 | 65.9 | 0.24 | 87 | 83 | 1.00 | Fisher’s exact test |
| Octreotide drip use (%) | 77.3 | 65.9 | 0.60 | 91.3 | 100 | 0.50 | Fisher’s exact test |
| ICU LOS in days (mean) | 19 | 12 | 0.56 | 11.3 | 8.04 | 0.62 | Mann-Whitney U test |
| Hospital LOS in days (mean) | 29.64 | 18.89 | 0.56 | 18 | 15 | 0.76 | Mann-Whitney U test |
| Ventilator days (mean) | 16 | 9 | 0.81 | 10 | 7 | 0.73 | Mann-Whitney U test |
| Vasopressor use (%) | 86.4 | 79.5 | 0.40 | 91.3 | 82.6 | 0.38 | Chi-square test |
| TEG group (n = 44) | Non-TEG group (n = 44) | P-value | TEG cirrhosis sub-group (n = 23) | Non-TEG cirrhosis sub-group (n = 23) | P-value | Test of significance used | |
|---|---|---|---|---|---|---|---|
| GI: gastrointestinal; RBC: red blood cell; TEG: thromboelastography; TIPS: transjugular intrahepatic portosystemic shunt. | |||||||
| Primary outcomes | |||||||
| Total RBC transfused (mL) | 2,549 | 1,274 | 0.21 | 2,615 | 632 | 0.07 | Mann-Whitney U test |
| Total plasma transfused (mL) | 1,036 | 913 | 0.13 | 1,601 | 1,127 | 0.17 | Mann-Whitney U test |
| Total cryoprecipitate transfused (mL) | 80 | 55 | 0.03 | 136 | 162 | 0.17 | Mann-Whitney U test |
| Total platelets transfused (mL) | 543 | 327 | 0.02 | 791 | 327 | 0.07 | Mann-Whitney U test |
| Total blood volume transfused (mL) | 4,207 | 2,568 | 0.04 | 5,144 | 2,248 | 0.06 | Mann-Whitney U test |
| Secondary outcomes | |||||||
| Pre-intervention RBC transfused (mL) | 390 | 48 | 0.23 | 263 | 104 | 0.58 | Mann-Whitney U test |
| Pre-intervention plasma transfused | 247 | 124 | 0.94 | 436 | 189 | 0.75 | Mann-Whitney U test |
| Pre-intervention cryoprecipitate transfused (mL) | 8 | 32 | 0.56 | 15 | 63 | 0.56 | Mann-Whitney U test |
| Pre-intervention platelets transfused (mL) | 163 | 42 | 0.63 | 279 | 108 | 0.28 | Mann-Whitney U test |
| Pre-intervention blood volume transfused | 807 | 246 | 0.62 | 993 | 465 | 0.83 | Mann-Whitney U test |
| Total upper GI endoscopies | 0.75 | 0.89 | 0.10 | 0.61 | 0.87 | 0.05 | Mann-Whitney U test |
| Total colonoscopies | 0.11 | 0.05 | 0.24 | 0.04 | 0.13 | 0.3 | Mann-Whitney U test |
| Total embolization | 0.36 | 0.30 | 0.50 | 0.17 | 0.26 | 0.48 | Mann-Whitney U test |
| Total TIPS | 0.11 | 0.11 | 1.00 | 0.13 | 0.13 | 1.00 | Mann-Whitney U test |
| Total procedures for bleeding | 1.34 | 1.34 | 0.92 | 0.06 | 1.39 | 0.06 | Mann-Whitney U test |