Figures
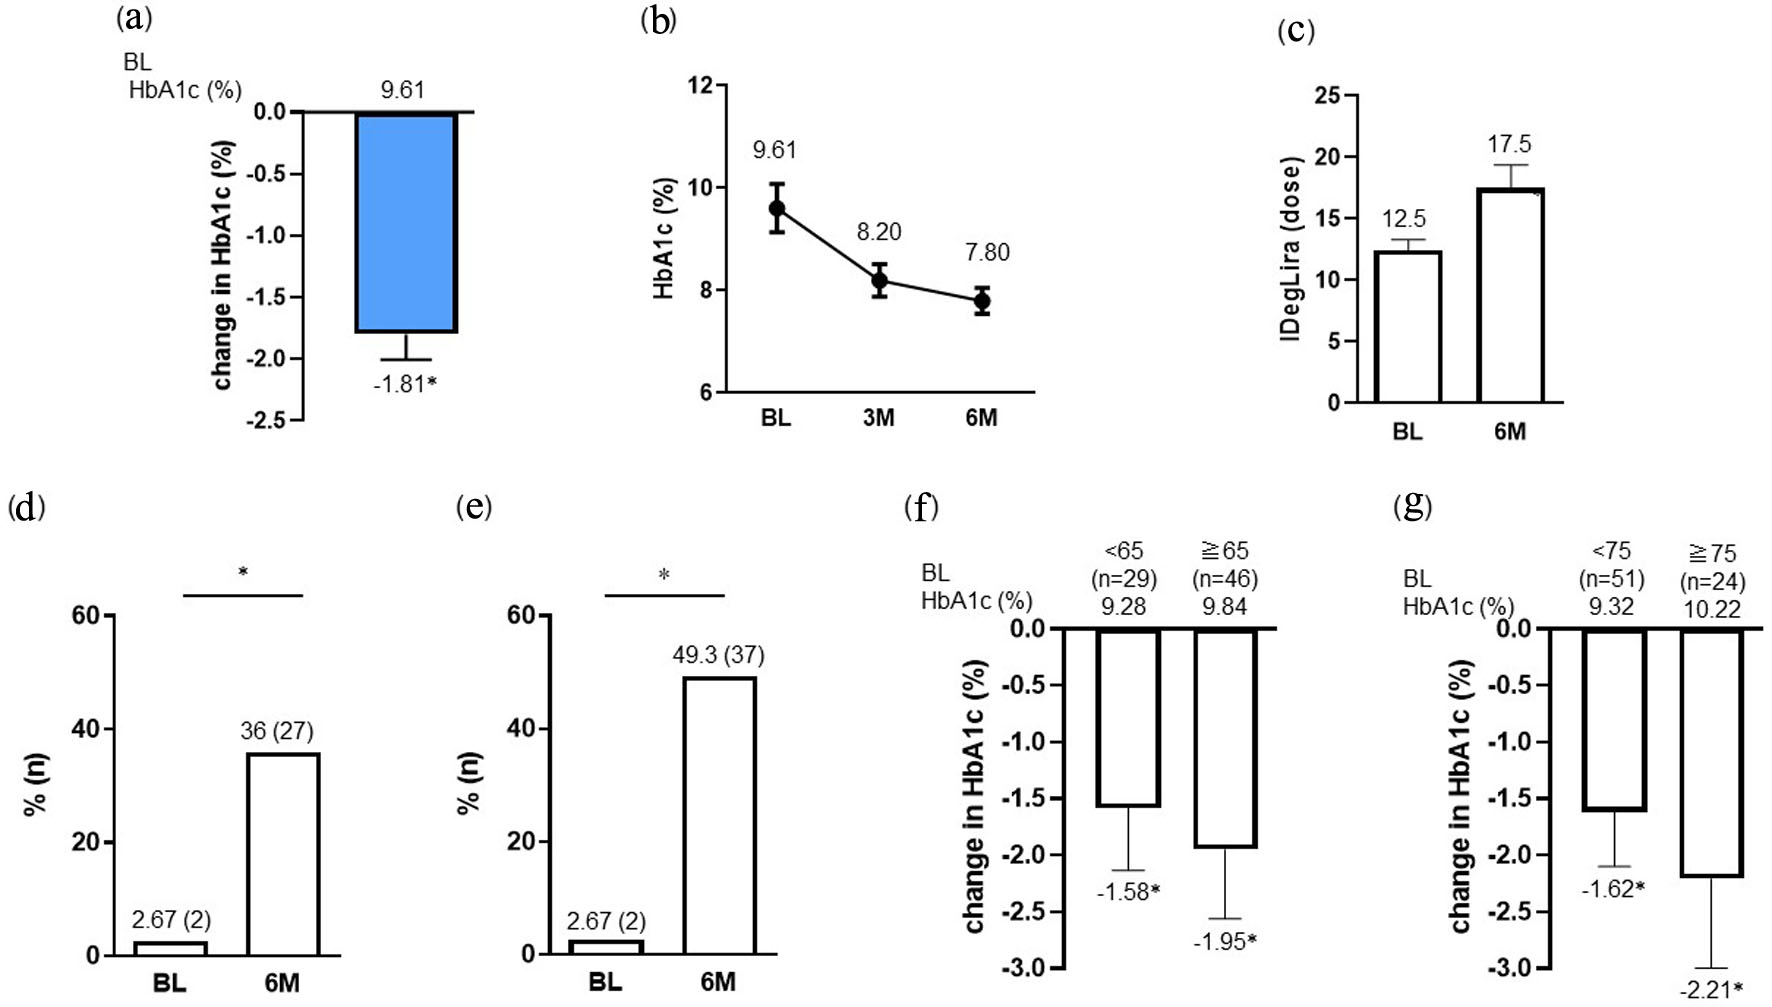
Figure 1. Change in HbA1c (a, b) and IDegLira dose (c) at 6 months after the initiation of IDegLira. Change in the proportion of patients achieving HbA1c < 7% (d) and the target HbA1c set according to the individual patient’s background (e) at 6 months after the initiation of IDegLira. Change in HbA1c from baseline by subgroups separated by age under 65 or over (f) and under 75 or over (g) years. Data are presented as mean with 95% CIs. *P < 0.01 by Wilcoxon signed-rank sum test (vs. BL HbA1c or dose of IDegLira in a, c, f and g). *P < 0.01 by McNemar’s test (in d and e) (vs. BL). HbA1c: glycated hemoglobin; IDegLira: insulin degludec/liraglutide; CIs: confidence intervals; BL: baseline.
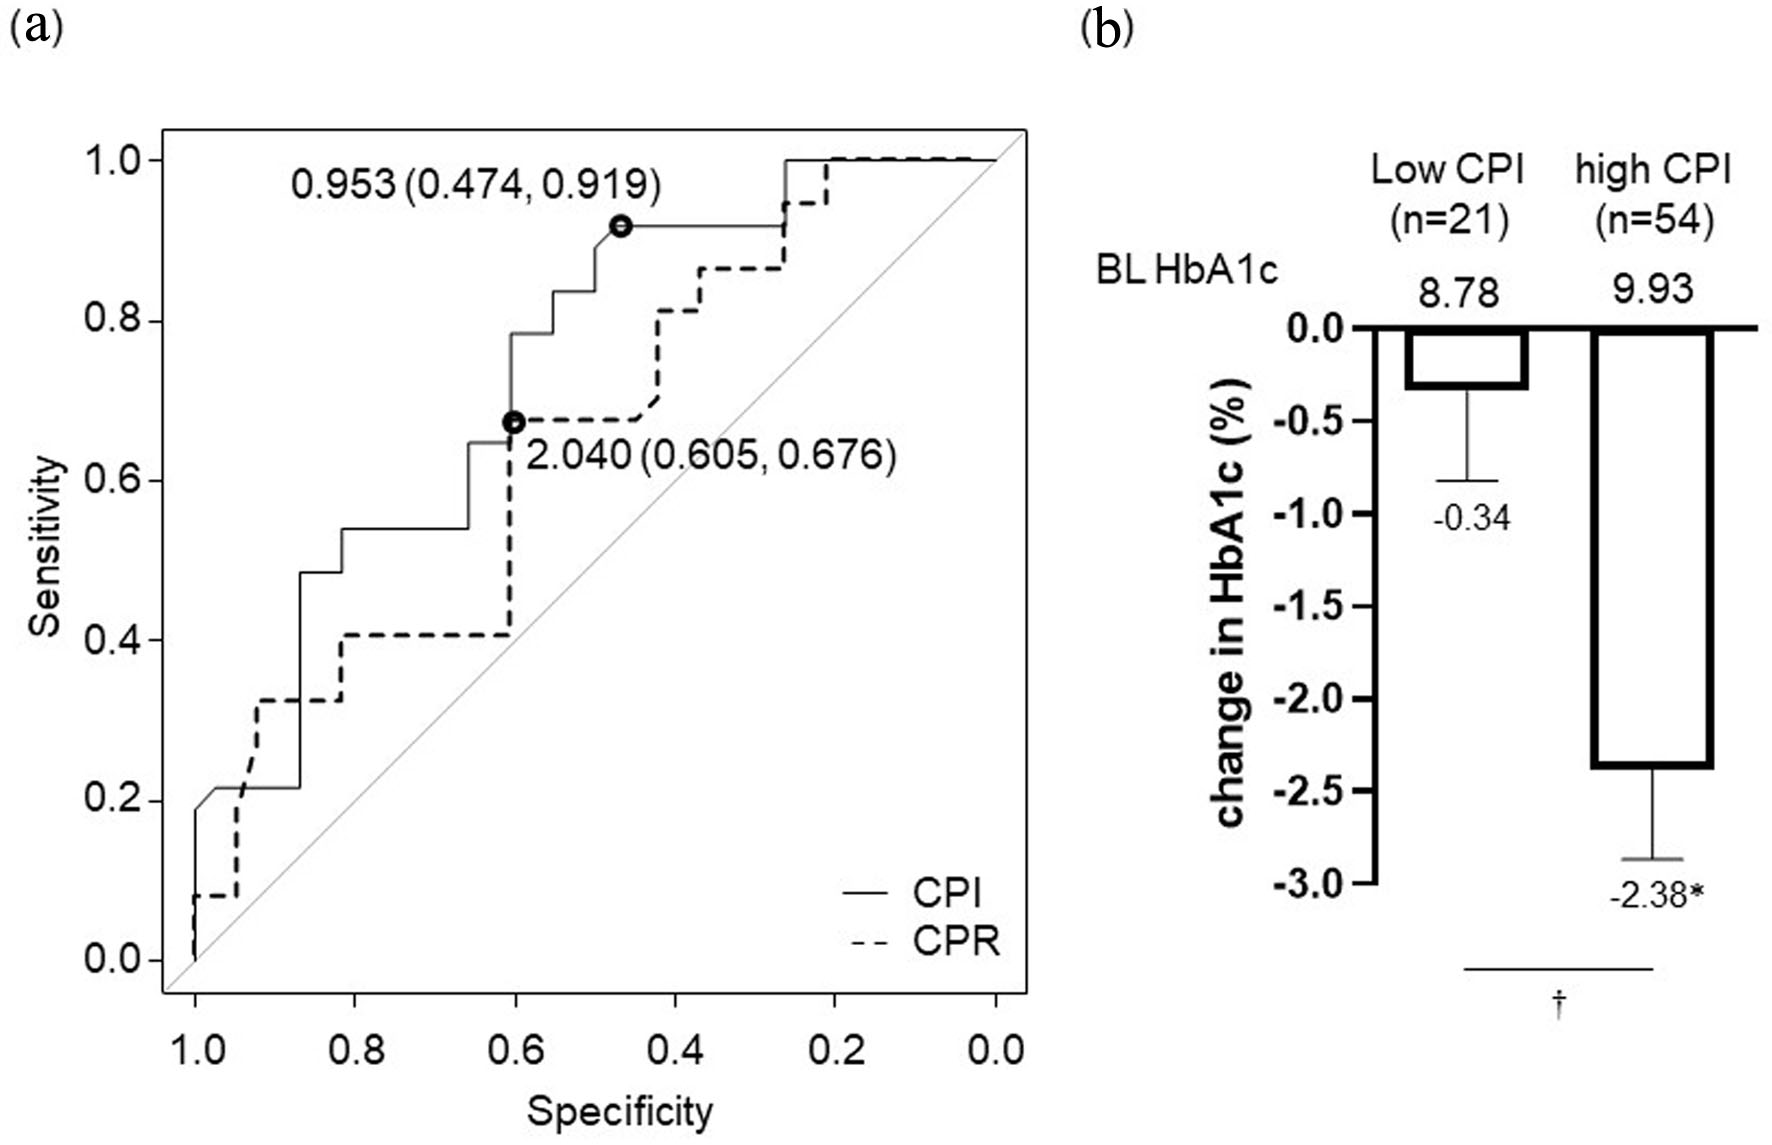
Figure 2. Pancreatic β-cell function for achieving HbA1c target set individually for each patient (a). Optimal CPI cut-off point: 0.953 ng/mL per mg/dL, area under the receiver-operating characteristic curve: 0.739, 95% CI: 0.627 - 0.851, specificity: 47.4%, sensitivity: 91.9%. Optimal CPR cut-off point: 2.04 ng/mL, AUC: 0.649, 95% CI: 0.524 - 0.774, specificity: 60.5%, sensitivity: 67.6%. Change in HbA1c at 6 months after initiation of IDegLira in high CPI group (CPI ≥ 0.953) and low CPI group (CPI < 0.953) based on the optimal cut-off value (b). Data are shown as mean with 95% CIs. *P < 0.01 by Wilcoxon signed-rank sum test (vs. BL HbA1c). †P < 0.01 for comparison of change in HbA1c between high CPI group vs. low CPI group by Mann-Whitney U-test. ROC: receiver-operating characteristic; CPR: C-peptide immunoreactivity; CPI: C-peptide index; HbA1c: glycated hemoglobin; AUC: area under the curve; CI: confidence interval; IDegLira: insulin degludec/liraglutide; CIs: confidence intervals; BL: baseline.
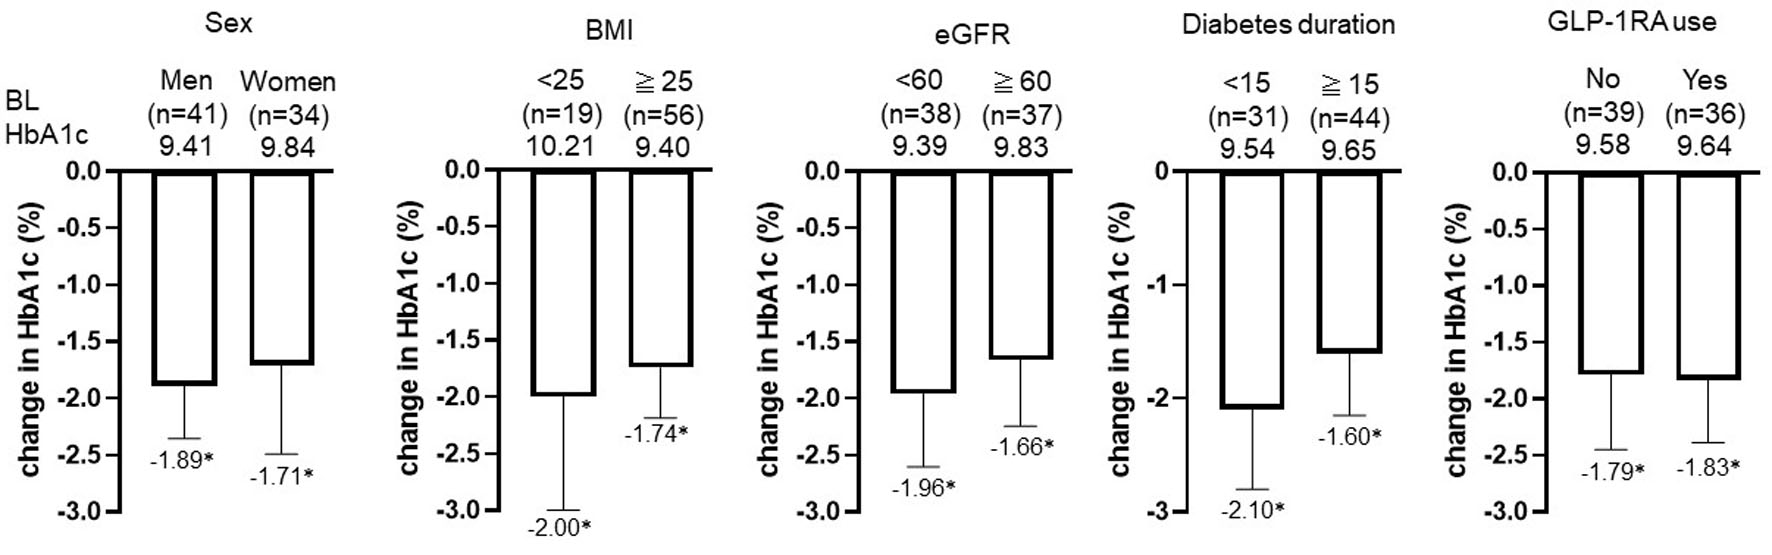
Figure 3. Change in HbA1c by subgroup: sex, BMI, eGFR, diabetes duration, and prior GLP-1RA use after initiation of IDegLira. *P < 0.01 by Wilcoxon signed-rank sum test (vs. BL HbA1c). Data are shown as mean with 95% CIs. HbA1c: glycated hemoglobin; BMI: body mass index; eGFR: estimated glomerular filtration rate; GLP-1RA: glucagon-like peptide-1 receptor agonist; IDegLira: insulin degludec/liraglutide; CIs: confidence intervals; BL: baseline.
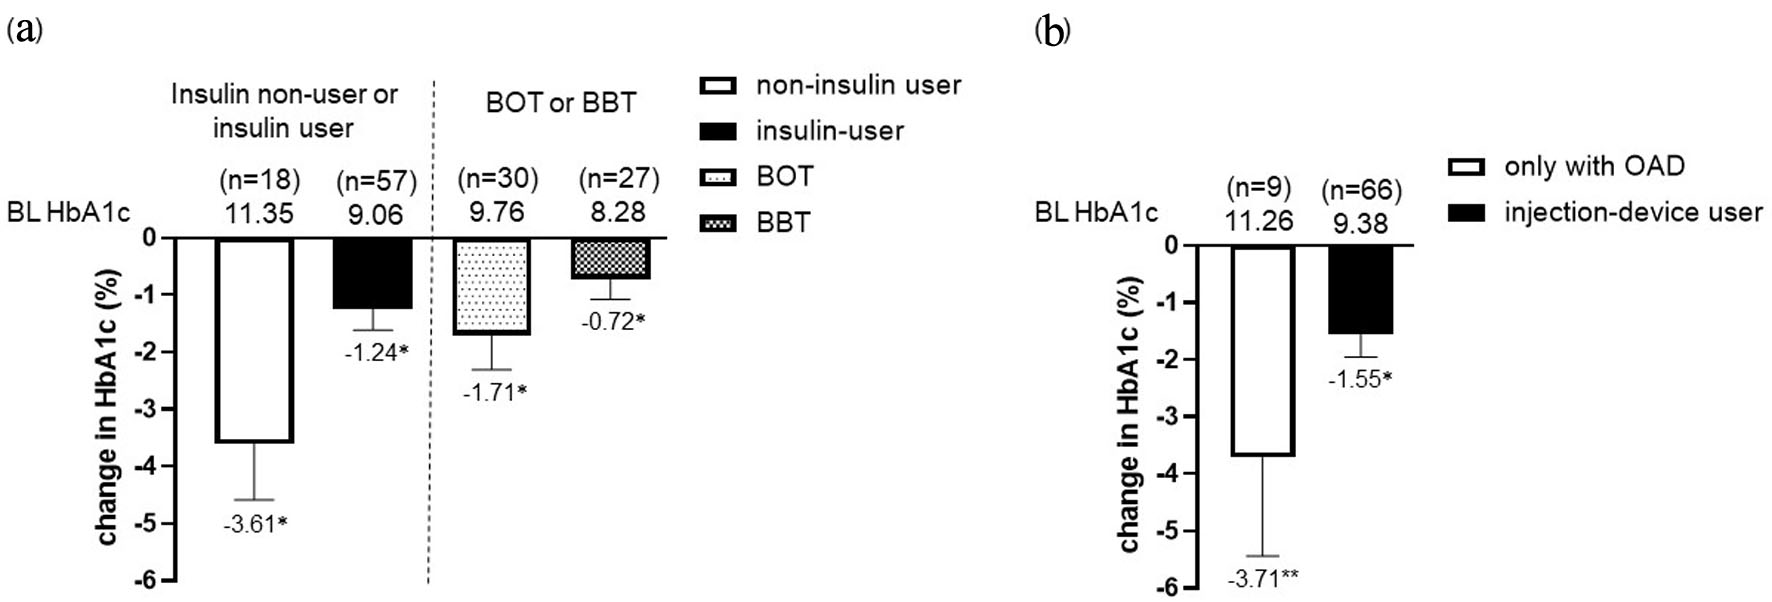
Figure 4. Change in HbA1c from baseline in the insulin non-user (n = 18) and user (n = 57) group (BOT; n = 30, BBT; n = 27) after the initiation of IDegLira (a). Change in HbA1c from baseline in only with OAD group and injection-device user group (insulin and GLP-1RA users) after the initiation of IDegLira (b). Data are presented as mean with 95% CIs. *P < 0.01 by Wilcoxon signed-rank sum test (vs. BL HbA1c). HbA1c: glycated hemoglobin; BOT: basal supported oral therapy; BBT: basal-bolus therapy; GLP-1RA: glucagon-like peptide-1 receptor agonist; OAD: oral antidiabetic drug; IDegLira: insulin degludec/liraglutide; CIs: confidence intervals; BL: baseline.
Tables
Table 1. Baseline Clinical Characteristics of the Study Population
| Clinical parameters | Overall (n = 75) |
|---|
| Data presented as frequency (%) for categorical variables and as mean (± standard deviation) for continuous variables. HbA1c: glycated hemoglobin; eGFR: estimated glomerular filtration rate; CPR: C-peptide immunoreactivity; CPI: C-peptide index; eGFR: estimated glomerular filtration rate; SGLT2: sodium-glucose cotransporter 2; DPP-4: dipeptidyl peptidase 4; OAD: oral antidiabetic drug, IDegAsp: insulin degludec/aspart; iGlarLixi: insulin glargine/lixisenatide; GLP-1RA: glucagon-like peptide-1 receptor agonist. |
| Sex, men, n (%) | 41 (54.7) |
| Age (years) | 65.7 (13.5) |
| Body mass index (kg/m2) | 28.0 (4.74) |
| Body weight (kg) | 72.8 (13.9) |
| Duration of diabetes (years) | 16.3 (10.3) |
| Smoking, n (%) | 9 (12.0) |
| HbA1c (%) | 9.61 (2.1) |
| eGFR (mL/min/1.73 m2) | 62.0 (30.4) |
| Fasting plasma glucose (mg/dL) | 171.6 (74.4) |
| Fasting CPR (ng/mL) | 2.43 (1.55) |
| CPI (ng/mL per mg/dL) | 1.47 (0.95) |
| Complications | |
| Dyslipidemia, yes, n (%) | 23 (30.7) |
| Hypertension, yes, n (%) | 34 (45.3) |
| Ischemic heart disease, yes, n (%) | 9 (12.0) |
| Diabetic Retinopathy, yes, n (%) | 16 (21.3) |
| Diabetic nephropathy, yes, n (%) | 43 (57.3) |
| Medications | |
| Sulfonylurea, n (%) | 2 (2.7) |
| Biguanide, n (%) | 27 (36.0) |
| Glinide, n (%) | 15 (20.0) |
| α-Glucosidase inhibitor, n (%) | 8 (10.7) |
| Thiazolidinedione, n (%) | 2 (2.7) |
| SGLT2 inhibitor, n (%) | 33 (44) |
| DPP-4 inhibitor, n (%) | 25 (33.3) |
| OAD only, n (%) | 9 (12.0) |
| Insulin therapy, n (%) | 57 (76.0) |
| IDegAsp, n (%) | 2 (2.7) |
| GLP-1 receptor agonist, n (%) | 36 (48.0) |
| Liraglutide, n (%) | 9 (12.0) |
| Duraglutide, n (%) | 21 (28.0) |
| Lixisenatide, n (%) | 6 (8.0) |
Table 2. Correlation Between Change in HbA1c (%) and Baseline Clinical Parameters
| Parameters | r | P-value |
|---|
| HbA1c: glycated hemoglobin; eGFR: estimated glomerular filtration rate; CPR: C-peptide immunoreactivity; CPI: C-peptide index; IDegLira: insulin degludec/liraglutide. |
| Age (years) | -0.066 | 0.575 |
| Body mass index (kg/m2) | -0.024 | 0.837 |
| Duration of diabetes (years) | 0.187 | 0.109 |
| Baseline HbA1c (%) | -0.725 | < 0.001 |
| eGFR (mL/min/1.73 m2) | -0.013 | 0.912 |
| Fasting plasma glucose (mg/dL) | -0.221 | 0.057 |
| Fasting CPR (ng/mL) | -0.582 | < 0.001 |
| CPI (ng/mL per mg/dL) | -0.468 | < 0.001 |
| IDegLira at 6 months (dose) | 0.110 | 0.345 |
| IDegLira at 6 months (dose/kg) | 0.107 | 0.359 |