
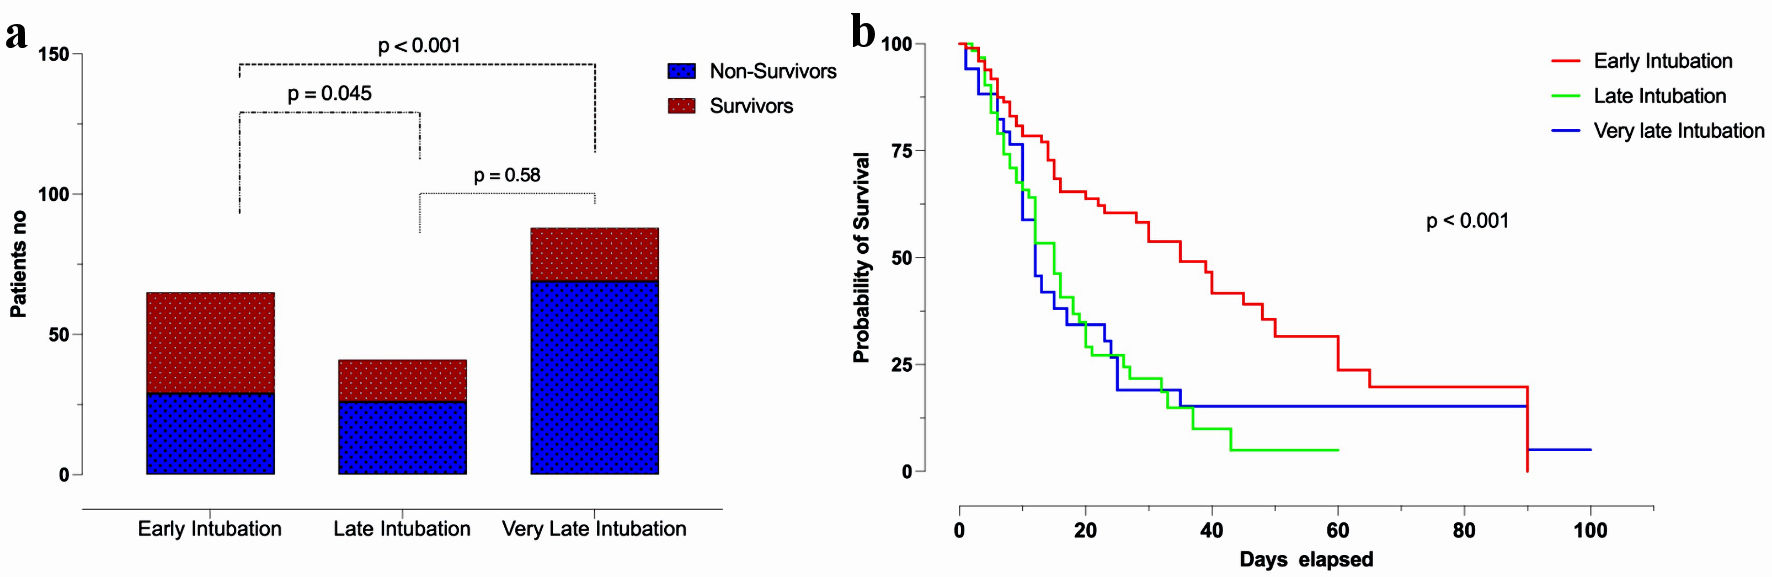
Figure 1. Mortality differences in early vs. late intubation group of patients (a), differences in intubation timing (days) in survivors vs. non-survivors (b) and probability of survival between the two groups of patients (c).
| Journal of Clinical Medicine Research, ISSN 1918-3003 print, 1918-3011 online, Open Access |
| Article copyright, the authors; Journal compilation copyright, J Clin Med Res and Elmer Press Inc |
| Journal website https://www.jocmr.org |
Original Article
Volume 16, Number 1, January 2024, pages 15-23
Intubation Time, Lung Mechanics and Outcome in COVID-19 Patients Suffering Acute Respiratory Distress Syndrome: A Single-Center Study
Figures
Tables
| All patients | Early intubation (≤ 2 days from hospital admission) | Late intubation (> 2 days from hospital admission) | P value | |
|---|---|---|---|---|
| aStatistically significant differences between early and late intubated patients. SOFA: sequential organ failure assessment; BMI: body mass index; CPAP: continuous positive airway pressure; Ppl: plateau pressure; PEEP: positive end expiratory pressure; Compliancestat,rs: respiratory system static compliance; WBCs: white blood cells; CRP: C-reactive protein; LDH: lactate dehydrogenase; IQR: interquartile range. | ||||
| Patients’ characteristics | ||||
| Number (%) | 194 | 58 (29.9) | 136 (70.1) | |
| Age (years) | 65 (57 - 72) | 60 (52 - 69) | 67 (60 - 73) | 0.002a |
| Gender male, n (%) | 129 (66.5) | 37 (63.8) | 93 (68) | 0.670 |
| SOFA, median (IQR) | 7 (7 - 9) | 6 (5 - 8) | 8 (6 - 9) | 0.002a |
| BMI, median (IQR) | 28 (26 - 34) | 30 (26 - 35) | 28 (26 - 33) | 0.554 |
| PO2/FiO2 before intubation, median (IQR) | 90 (78 - 110) | 90 (77.7 - 115.7) | 90 (78 - 110) | 0.938 |
| PO2/FiO2 after intubation, median (IQR) | 120 (90 - 140) | 120 (90 - 140) | 110 (89 - 140) | 0.295 |
| CPAP use, n (%) | 164 (84.5) | 42 (72.4) | 122 (89.7) | 0.004a |
| CPAP (days), median (IQR) | 3 (1 - 6) | 1 (0 - 2) | 4.5 (3 - 6) | < 0.001a |
| Mechanical ventilation mechanics, median (IQR) | ||||
| Ppl (cm H2O) | 26 (24 - 28) | 26 (24 - 28) | 26 (24 - 28) | 0.104 |
| PEEP (cm H2O) | 12 (11 - 14) | 12.5 (12 - 14) | 12 (10 - 14) | 0.016a |
| Compliancestat, rs (mL/cm H2O), day 1 | 37.5 (32 - 45) | 42 (35 - 49) | 36 (30 - 44) | 0.006a |
| Compliancestat, rs (mL/cm H2O), day 6 | 35 (29 - 44) | 40 (33 - 45) | 33 (27 - 42) | < 0.001a |
| Compliancestat, rs (mL/cm H2O), day 12 | 33 (26 - 41) | 37.5 (32.7 - 44) | 32 (25 - 41) | < 0.001a |
| Driving pressure (cm H2O) | 14 (12 - 16) | 13.5 (12 - 16) | 14 (12 - 16) | 0.081 |
| Laboratory values, median (IQR) | ||||
| WBCs (absolute number/mm3) | 17,800 (14,000 - 21,832) | 16,000 (12,945 - 18,567) | 18,485 (14,892 - 22,975) | 0.004a |
| D-dimmer (µg/L) | 2,569 (1,340 - 5,600) | 2,554 (1,370 - 5,450) | 2,650 (1,300 - 5,600) | 0.747 |
| CRP (mg/dL) | 9 (6 - 15) | 9 (5.2 - 13.2) | 8.9 (5.9 - 16) | 0.592 |
| Ferritin (ng/mL) | 1,790 (937 - 3,538) | 1,466 (935 - 2,905) | 1,900 (920 - 3,771) | 0.276 |
| LDH (U/L) | 502 (320 - 789) | 478 (320 - 683) | 533 (320 - 858) | 0.336 |
| Comorbidities, n (%) | ||||
| Hypertension | 111 (57.2) | 31 (53.4) | 80 (58.8) | 0.528 |
| Heart failure | 28 (14.4) | 7 (12) | 21 (15.4) | 0.658 |
| Coronary artery disease | 34 (17.5) | 7 (12) | 27 (20) | 0.221 |
| Lung disease | 16 (8.2) | 3 (5.2) | 13 (9.6) | 0.401 |
| Kidney injury | 22 (11.3) | 3 (5.2) | 19 (14) | 0.09 |
| Diabetes | 53 (27.3) | 18 (31) | 35 (25.7) | 0.484 |
| Cancer | 10 (5.2) | 3 (5.2) | 7 (5.1) | 1.00 |
| Outcomes | ||||
| Mortality n (%) | 124 (64) | 26 (44.8) | 98 (72) | < 0.001a |
| ICU LOS, median (IQR) | 13 (8 - 25) | 14.5 (8.7 - 27) | 12 (8 - 24.7) | 0.344 |
| Mechanical ventilation days, median (IQR) | 12 (6 - 23) | 12 (6 - 24) | 12 (6 - 22) | 0.992 |
| Variable | Vital status | Univariate regression | Multivariable regression | |||
|---|---|---|---|---|---|---|
| Non-survivors | Survivors | OR (95% CI) | P value | aOR (95% CI) | P value | |
| aFactors that were included in the multivariable regression. bFactor Independently associated with mortality in the multivariable regression. OR: odds ratio; CI: confidence interval; aOR: adjusted odds ratio; WBCs: white blood cells; CRP: C-reactive protein; IQR: interquartile range; SOFA: sequential organ failure assessment; BMI: body mass index; Ppl: plateau pressure; PEEP: positive end expiratory pressure; Compliance stat, rs: respiratory system static compliance; LDH: lactate dehydrogenase. | ||||||
| Age, mean (SD) | 69.5 (62 - 75) | 57 (46 - 64) | 1.12 (1.08 - 1.16) | < 0.001a | 1.15 (1.08 - 1.23) | < 0.001b |
| Gender (male) | 81 (65.3) | 48 (68.6) | 1.24 (0.66 - 2.33) | 0.340 | ||
| BMI | 28 (26 - 33) | 28 (26 - 35) | 0.99 (0.96 - 1.02) | 0.497 | ||
| SOFA score, median (IQR) | 8 (7 - 9) | 6 (5.0 - 6.5) | 2.28 (1.76 - 2.95) | < 0.001a | 1.81 (1.27 - 2.58) | < 0.001b |
| Group (early intubation), n (%) | 26 (21) | 32 (45.7) | 3.3 (3.00 - 3.30) | < 0.001a | ||
| Time to intubation (days) | 7 (4 - 10) | 3 (2 - 7) | 1.17 (1.08 - 1.26) | < 0.001a | 1.15 (1.05 - 1.27) | 0.004b |
| ICU LOS (days), median (IQR) | 12 (6.25 - 21.75) | 15 (10 - 17.7) | 0.98 (0.97 - 1.00) | 0.060 | ||
| Mechanical ventilation days, median (IQR) | 10.5 (6 - 20) | 13 (7.75 - 25.25) | 0.99 (0.98 - 1.01) | 0.353 | ||
| CPAP duration before intubation (days), median (IQR) | 4 (2 - 6) | 2 (1 - 4) | 1.26 (1.12 - 1.42) | < 0.001a | ||
| Comorbidities, n (%) | ||||||
| Hypertension | 84 (67.7) | 27 (38.6) | 3.3 (1.80 - 6.10) | < 0.001a | ||
| Heart failure | 24 (19.4) | 4 (5.7) | 3.9 (1.31 - 11.90) | 0.01a | ||
| Coronary artery disease | 31 (25) | 3 (4.3) | 7.4 (2.18 - 25.36) | < 0.001a | ||
| Lung disease | 13 (10.5) | 3 (4.3) | 2.6 (0.72 - 9.50) | 0.17 | ||
| Kidney injury | 18 (14.5) | 4 (5.7) | 2.8 (0.91 - 8.64) | 0.97 | ||
| Diabetes | 36 (29) | 17 (24.3) | 1.2 (0.65 - 2.49) | 0.50 | ||
| Cancer | 9 (7.3) | 1 (1.4) | 5.4 (0.67 - 43.54) | 0.10 | ||
| Clinical laboratory data | ||||||
| PO2/FiO2 ratio before intubation, median (IQR) | 86 (77 - 110) | 100 (80 - 116) | 0.98 (0.97 - 0.99) | 0.022 | ||
| PO2/FiO2 ratio after intubation, median (IQR) | 95 (80 - 120) | 130 (115 - 150) | 0.98 (0.97 - 0.99) | < 0.001a | 0.96 (0.94 - 0.98) | 0.001b |
| Ppl (cm H2O), median (IQR) | 27 (25 - 28) | 25 (23 - 27) | 1.14 (1.04 - 1.25) | 0.004a | ||
| PEEP (cm H2O), median (IQR) | 12 (10 - 14) | 12 (12 - 14) | 0.94 (0.80 - 1.10) | 0.487 | ||
| Compliancestat, rs (mL/cm H2O), day 1, median (IQR) | 34 (28 - 42) | 44 (37 - 52) | 0.92 (0.90 - 0.95) | < 0.001a | 1.12 (1.02 - 1.22) | 0.012b |
| Compliancestat, rs (mL/cm H2O), day 6, median (IQR) | 31 (25 - 38) | 42 (37 - 47) | 0.89 (0.86 - 0.93) | < 0.001a | ||
| Compliancestat, rs (mL/cm H2O), day 12, median (IQR) | 28 (22 - 35) | 42 (37 - 47) | 0.85 (0.81 - 0.89) | < 0.001a | 1.14 (1.05 - 1.24) | < 0.001b |
| Driving pressure (cm H2O), median (IQR) | 14 (12 - 17) | 13 (12 - 15) | 1.18 (1.06 - 1.33) | 0.003a | ||
| Lung CT severity, n (%) | 38 (60.3) | 11 (35.5) | 2.7 (1.13 - 6.74) | 0.03 | ||
| WBCs (absolute number/mm3), median (IQR) | 18,850 (15,687 - 23,367) | 15,900 (12,255 - 18,135) | 1.01 (1.00 - 1.02) | < 0.001a | 1.00 (1.00 - 1.00) | 0.001b |
| CRP (mg/dL), median (IQR) | 9 (6 - 17) | 8.36 (5 - 13) | 1.03 (0.99 - 1.07) | 0.066 | ||
| Ferritin (ng/mL), median (IQR) | 2,180 (1,107 - 3,700) | 1,300 (828 - 2,674) | 1.00 (1.00 - 1.00) | 0.101 | ||
| D-dimers (µg/L), median (IQR) | 2,340 (1,330 - 5,720) | 2,920 (1,375 - 5,407) | 1.00 (1.00 - 1.00) | 0.360 | ||
| LDH (U/L), median (IQR) | 533 (340 - 889) | 465 (277 - 656) | 1.00 (1.00 - 1.00) | 0.43 | ||