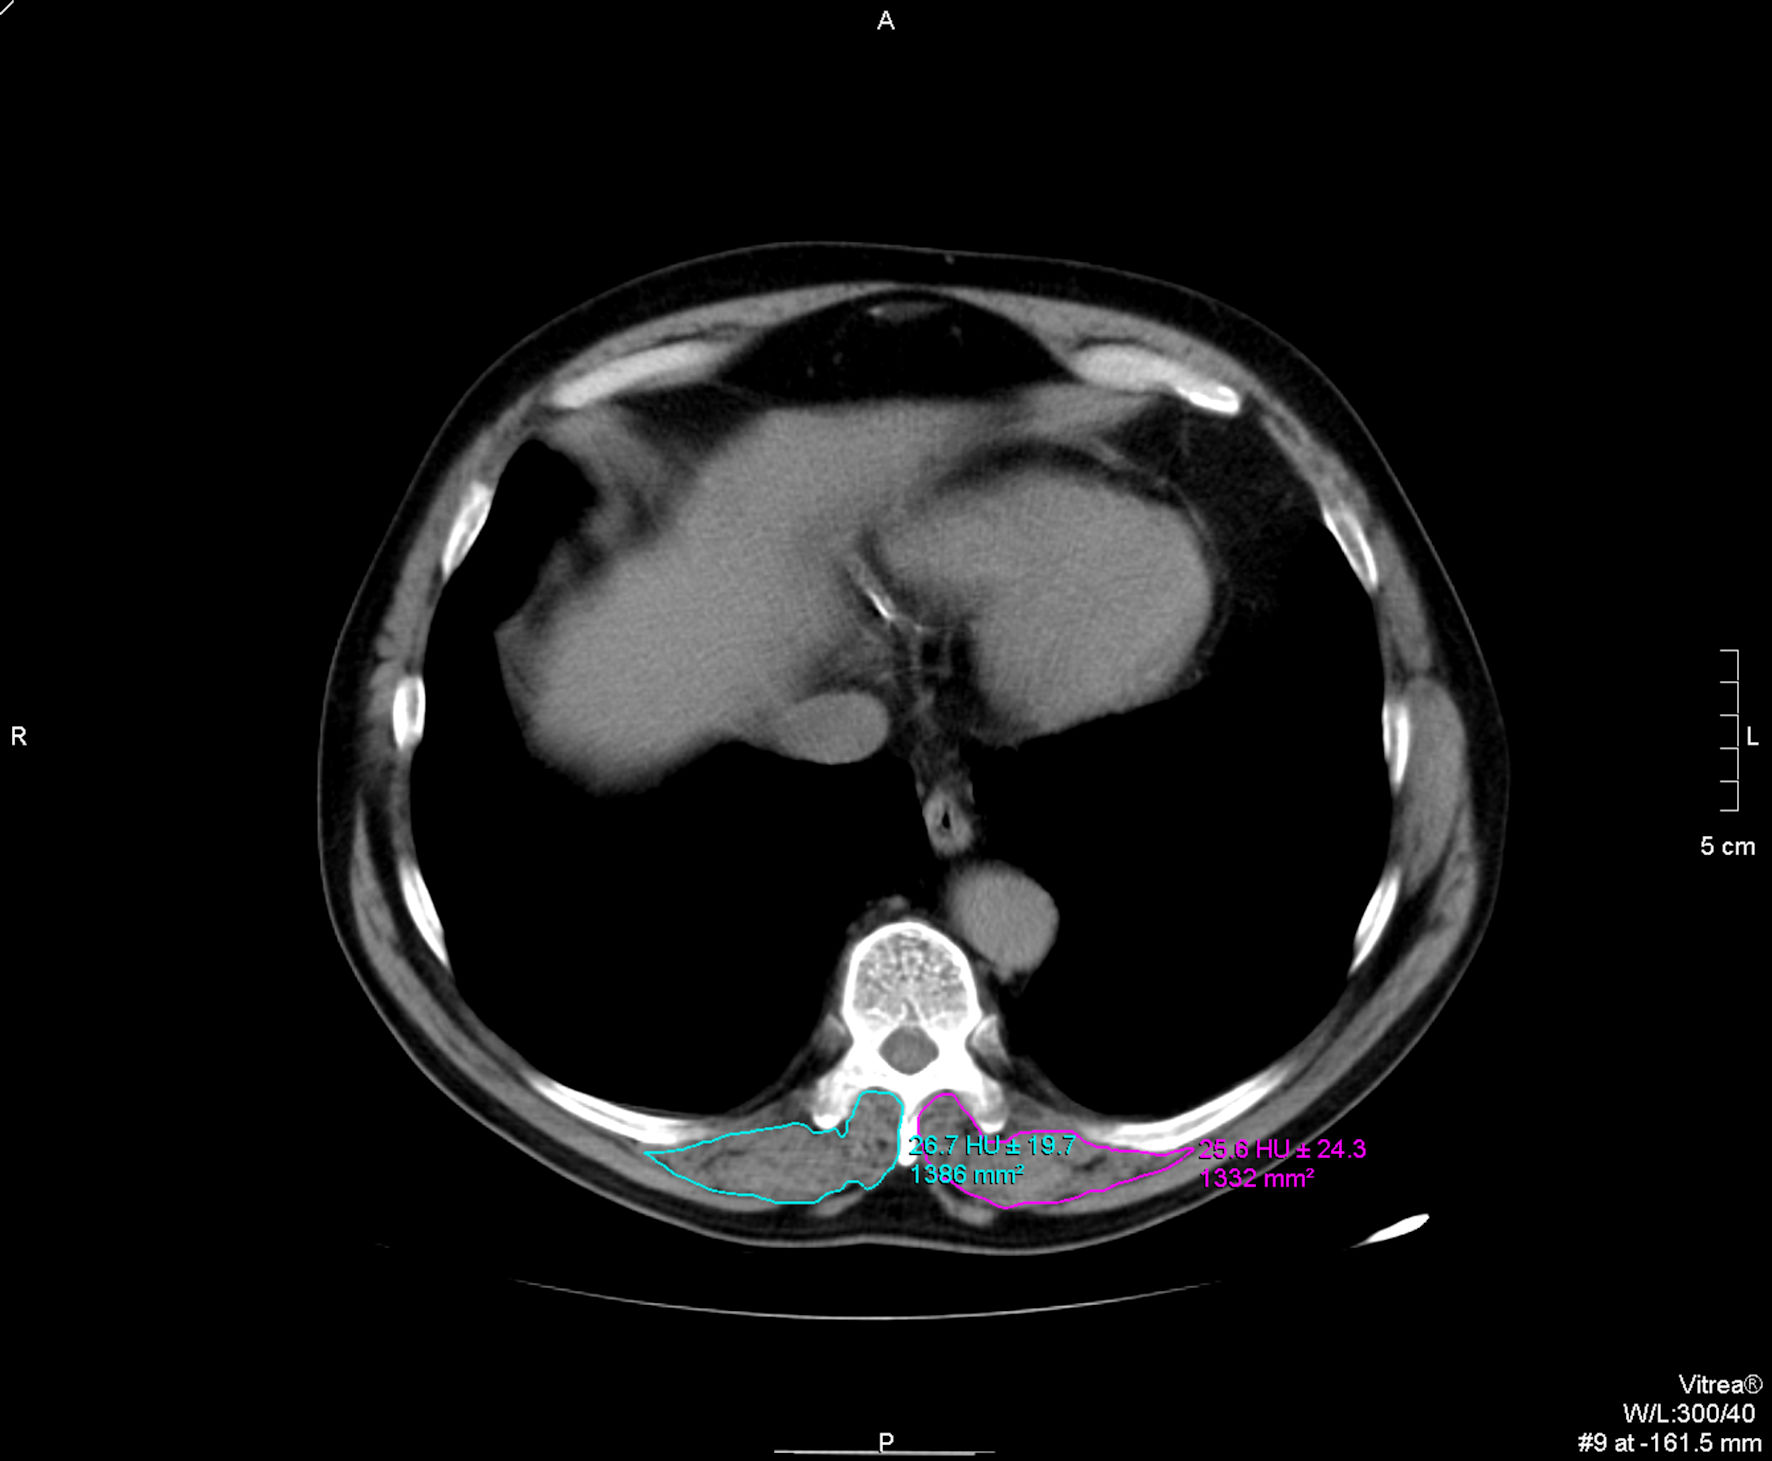
Figure 1. T10 paravertebral muscle group cross-sectional area (CSA) and skeletal muscle density (SMD) measurements.
| Journal of Clinical Medicine Research, ISSN 1918-3003 print, 1918-3011 online, Open Access |
| Article copyright, the authors; Journal compilation copyright, J Clin Med Res and Elmer Press Inc |
| Journal website https://www.jocmr.org |
Original Article
Volume 15, Number 7, July 2023, pages 368-376
Radiologic Features of T10 Paravertebral Muscle Sarcopenia: Prognostic Factors in COVID-19
Figures
Tables
| All (n = 84) | Survivors (n = 66) | Deceased (n = 18) | P value | |
|---|---|---|---|---|
| IQR: interquartile range; CSA: cross-sectional area; SMD: skeletal muscle density; WBC white blood cell; PLTs: platelets; AST: aspartate aminotransferase; ALT: alanine aminotransferase; CRP: C-reactive protein; LDH: lactate dehydrogenase. | ||||
| Male, n (%) | 59 (70.2) | 48 (72.7) | 11 (61.1) | 0.38 |
| Age, median (IQR) | 60 (47 - 71) | 53 (41.5 - 68) | 69 (60 - 77) | 0.001 |
| Symptoms onset (days) | 7 (4 - 8) | 7 (4 - 8) | 5 (3 - 9) | 0.58 |
| CT severity score, median (IQR) | 10 (6.25 - 15) | 10 (5 - 13) | 14 (9 - 19.5) | < 0.001 |
| CT category, n (%) | < 0.001 | |||
| Mild | 22 (26.2) | 21 (31.8) | 1 (5.6) | |
| Moderate | 51 (60.7) | 41 (62.1) | 10 (55.6) | |
| Severe | 11 (13.1) | 4 (6.1) | 7 (38.9) | |
| Sarcopenia radiologic features median (IQR) | ||||
| T10-CSA (cm2) | 16.705 (11.722 - 23.305) | 18.24 (12.845 - 25.445) | 11.91 (8.85 - 14.498) | <0.001 |
| T10-SMD (HU) | 29.750 (16.750 - 43.500) | 29.375 (17.35 - 45.713) | 34.1 (13.55 - 42.35) | 0.82 |
| Comorbidities (%) | ||||
| CAD | 4 (4.8) | 3 (4.5) | 1 (5.6) | 0.88 |
| Hypertension | 20 (23.8) | 15 (22.7) | 5 (27.8) | 0.75 |
| Diabetes mellitus type 2 | 6 (7.1) | 4 (6.1) | 2 (11.1) | 0.60 |
| Dyslipidemia | 10 (11.9) | 7 (10.6) | 3 (16.7) | 0.68 |
| Other metabolic comorbidity | 8 (9.5) | 6 (9.1) | 2 (11.1) | 1 |
| Laboratory values median (IQR) | ||||
| WBC (× 103/µL) | 5.265 (4.232 - 7.750) | 5.085 (4.2 - 7.2) | 7.42 (4.368 - 11.685) | 0.08 |
| PLTs (× 103/µL) | 188 (136 - 254.5) | 190 (140 - 253.75) | 183 (120 - 307) | 0.96 |
| Fibrinogen (mg/dL) | 463 (363 - 539.5) | 433.5 (349.25 - 540.25) | 508 (456 - 532.5) | 0.08 |
| D-dimers (µg/mL) | 0.465 (0.298 - 1.103) | 0.465 (0.297 - 1.214) | 0.465 (0.344 - 0.853) | 0.86 |
| Ferritin (mg/L) | 364.5 (151.9 - 731.9) | 367.5 (151.9 - 722.4) | 336.5 (147.25 - 1,050.5) | 0.92 |
| AST (U/L) | 25 (20 - 37.5) | 25 (17.4 - 25) | 25 (17.6 - 25) | 0.45 |
| ALT (U/L) | 23 (15 - 41.23) | 23.5 (16 - 41.9) | 17 (12 - 41) | 0.25 |
| CRP (mg/L) | 3.415 (1.11 - 10.92) | 2.67 (1.03 - 8.45) | 5.7 (2.7 - 14.1) | 0.05 |
| Creatinine (mg/dL) | 0.9 (0.79 - 1.035) | 0.92 (0.8 - 1.02) | 0.9 (0.66 - 1.25) | 0.84 |
| Urea (mg/mL) | 34 (25.7 - 40.05) | 33.4 (24.5 - 39) | 38 (33 - 56) | 0.38 |
| LDH (U/L) | 265.5 (195.75 - 356.25) | 260 (181 - 338) | 319 (255 - 377) | 0.022 |
| Albumin (g/dL) | 4.3 (3.87 - 4.6) | 4.4 (3.99 - 4.62) | 3.3 (2.95 - 3.98) | 0.005 |
| Invasive mechanical ventilation n (%) | 15 (17.9) | 5 (7.6) | 10 (55.6) | < 0.001 |
| Length of stay (days), median (IQR) | 13.5 (8 - 21.25) | 13 (7.5 - 19.5) | 20 (10 - 28) | 0.11 |
| OR (95% CI) | P | Adjusted OR (95% CI) | P | |
|---|---|---|---|---|
| Logistic regression coefficients with 95% CIs in parentheses (P < 0.05, two-tailed). The dependent variable is hospital discharge, i.e., survival. Univariate ORs are displayed on the first column. Variables with a P < 0.02 were included in the multivariate analysis. Adjusted ORs for all variables are displayed on the second column. OR: odds ratio; CI: confidence interval; CSA: cross-sectional area; MV: mechanical ventilation; CT-SS: computed tomography severity score; LDH: lactate dehydrogenase. | ||||
| T10-CSA | 1.195 (1.07 - 1.33) | 0.002 | 1.207 (1.004 - 1.450) | 0.045 |
| MV | 0.066 (0.018 - 0.241) | < 0.001 | 0.042 (0.004 - 0.403) | 0.006 |
| Age | 0.934 (0.89 - 0.97) | 0.003 | 0.896 (0.817 - 0.982) | 0.019 |
| CT-SS | 0.836 (0.75 - 0.93) | < 0.001 | 0.844 (0.693 - 1.027) | 0.089 |
| LDH | 0.993 (0.98 - 0.99) | 0.016 | 0.997 (0.986 - 1.007) | 0.546 |