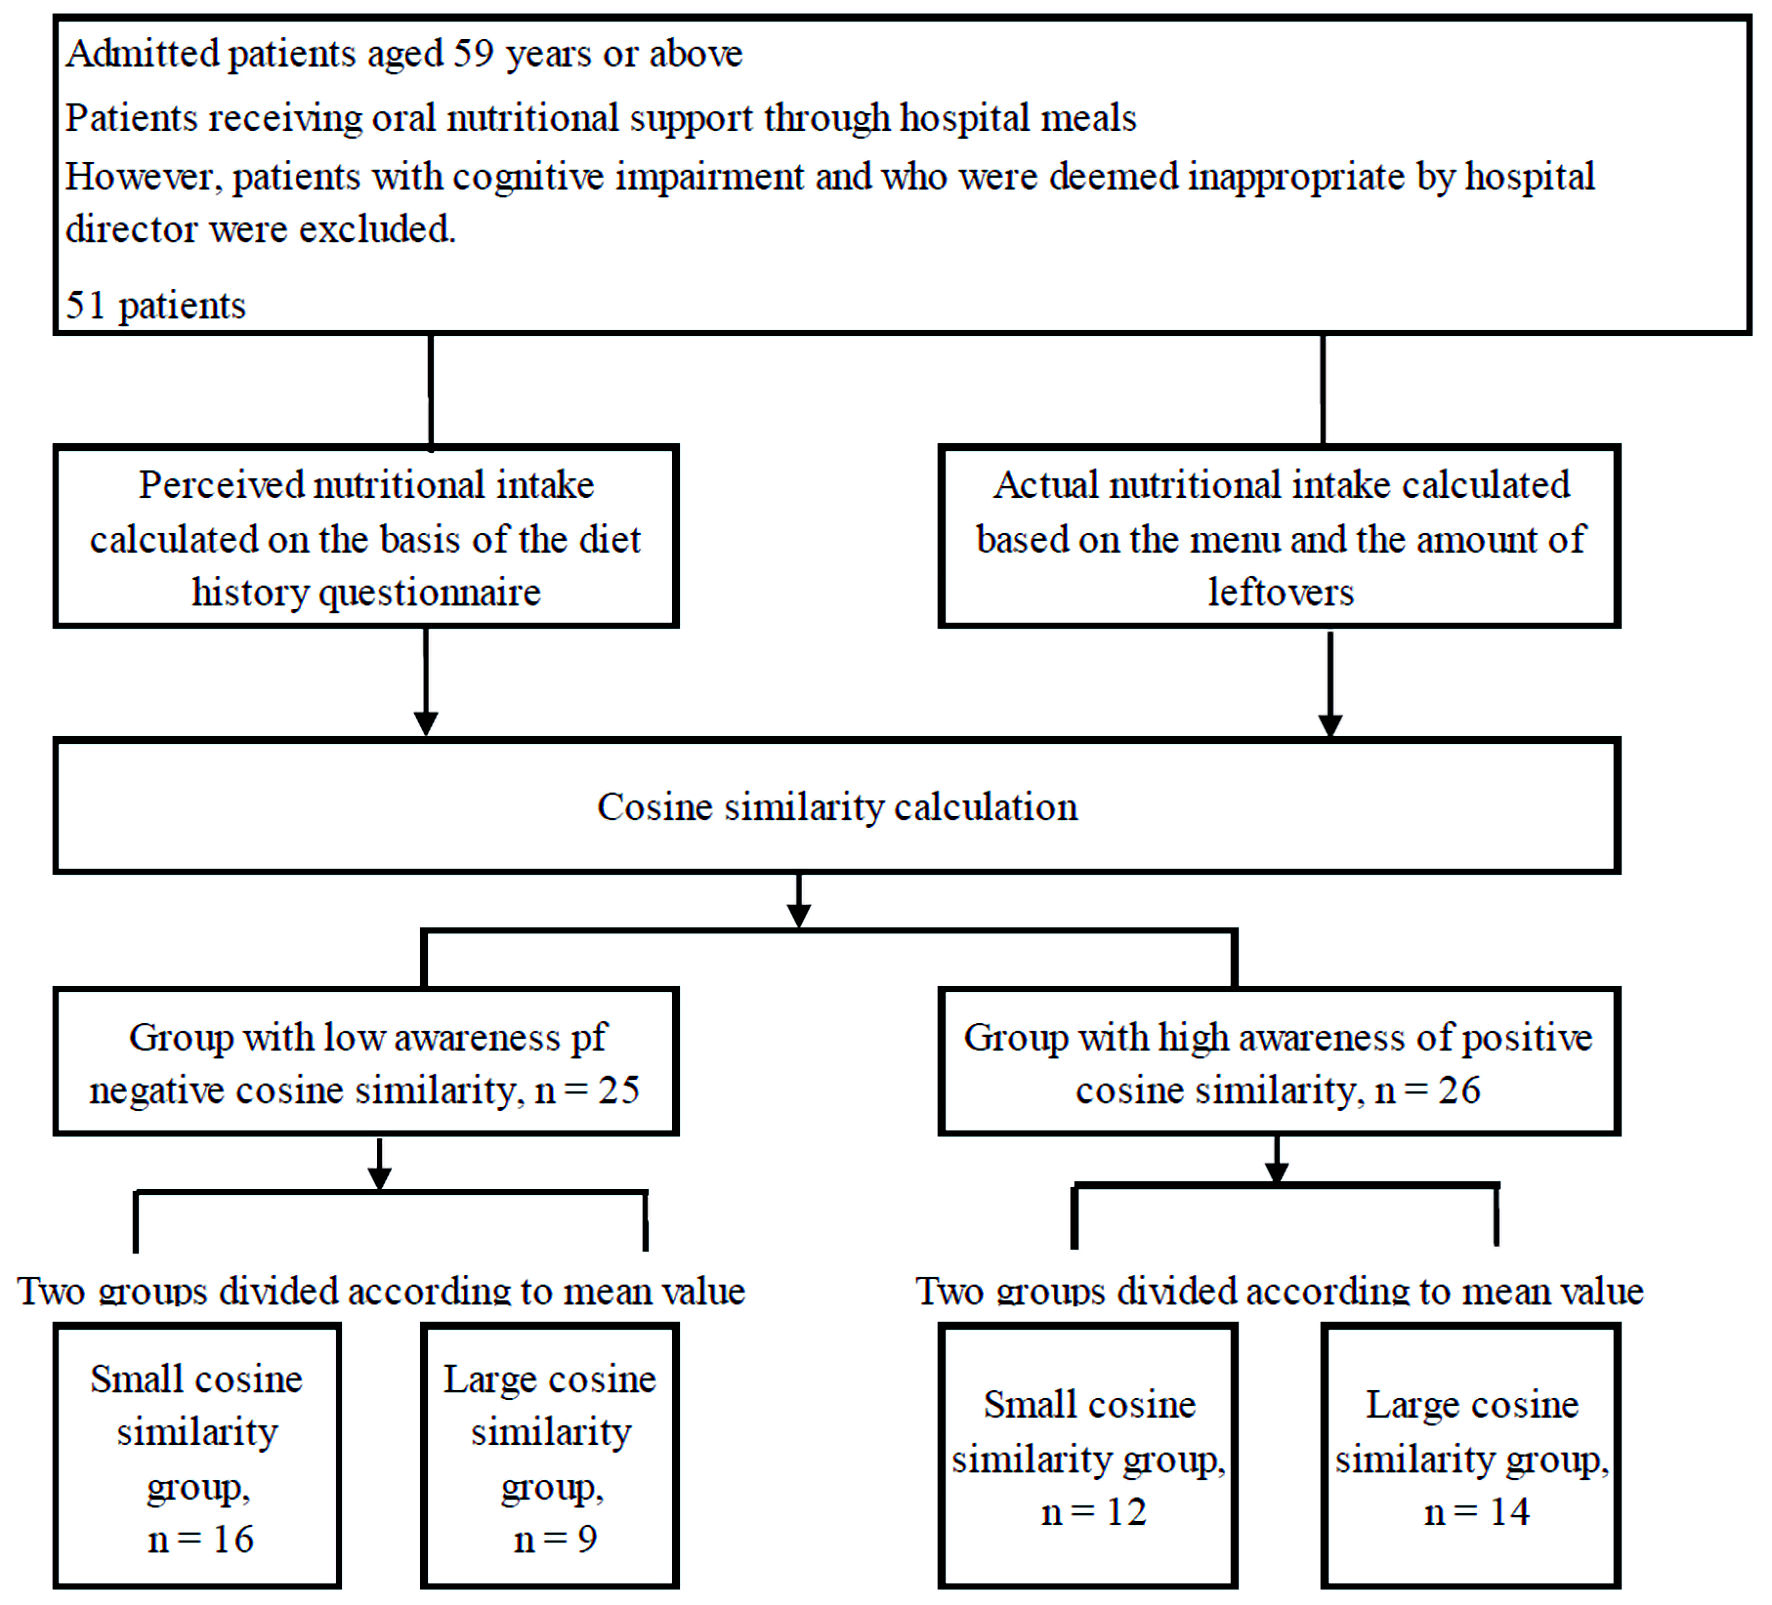
Figure 1. Scheme for subject recruitment and study workflow.
| Journal of Clinical Medicine Research, ISSN 1918-3003 print, 1918-3011 online, Open Access |
| Article copyright, the authors; Journal compilation copyright, J Clin Med Res and Elmer Press Inc |
| Journal website https://www.jocmr.org |
Original Article
Volume 15, Number 6, June 2023, pages 321-327
Nutritional Interpretation of Hospital Diets for Elderly Patients With Chronic Diseases and Analysis of Factors Influencing Actual Intakes
Figure
Tables
| Demographics | ||
|---|---|---|
| Data are expressed as mean ± standard deviation. Inside is quartile. The main causes for admission included chronic heart failure, bronchial pneumonia, chronic obstructive pulmonary disease, and type 2 diabetes; however, these conditions had been treated in the acute care hospital. Thus, patients’ conditions became stable. The perceived nutritional intake is calculated basis of the diet history questionnaire. aρ < -0.001, P = 0.999. bρ = 0.089, P = 0.535. cρ = 0.056, P = 0.709 (Spearman rank correlation). Alb: serum albumin; NPC/N: nonprotein calorie/nitrogen. | ||
| Number of patients (male/female) | 51 (36/15) | |
| Age (years) | 77.7 ± 9.5 | (68.5 - 85.0) |
| Body mass index (kg/m2) | 20.6 ± 4.4 | (16.9 - 23.9) |
| Alb (g/dL) | 3.3 ± 0.6 | (2.9 - 3.8) |
| Perceived nutritional intake | ||
| Energy (kcal) | 1,157 ± 344a | (959 - 1,316) |
| Protein (g) | 47.2 ± 16.9b | (36.6 - 53.8) |
| NPC/N | 132.6 ± 29.3c | (109.3 - 149.4) |
| Actual nutritional intake | ||
| Energy (kcal) | 1,402 ± 281a | (1,269 - 1,631) |
| Protein (g) | 60.2 ± 9.3b | (55.8 - 66.0) |
| NPC/N | 121.1 ± 25.2c | (107.4 - 140.0) |
| ρ value | P value | |
|---|---|---|
| N = 51 (Spearman’s rank correlation coefficient). aThe relationship according to whether there is a difference with a normal diet or special therapeutic diet. | ||
| Sex | 0.225 | 0.112 |
| Age | 0.063 | 0.662 |
| Type of hospital meala | 0.149 | 0.296 |
| Body mass index | 0.085 | 0.553 |
| Alb | -0.032 | 0.827 |
| Intake (staple food) | -0.242 | 0.087 |
| Intake (side dish) | -0.212 | 0.135 |
| Group with low awareness of negative cosine similarity | Group with high awareness of positive cosine similarity | |||||
|---|---|---|---|---|---|---|
| Small cosine similarity group | Large cosine similarity group | P value | Small cosine similarity group | Large cosine similarity group | P value | |
| Intake is defined as 1.00 when the whole meal is eaten. Inside is quartile. *P < 0.05 (Chi-squared test). ***P < 0.001 (Welch’s t test). Alb: serum albumin. | ||||||
| Number of patients (male/female) | 16 (14/2) | 9 (5/4) | 0.142 | 12 (11/1) | 14 (6/8) | 0.014* |
| Age (years) | 80.0 (62 - 88) | 80.0 (63 - 90) | 0.777 | 73.0 (59 - 92) | 80.5 (65 - 95) | 0.135 |
| Body mass index (kg/m2) | 19.7 (15.2 - 25.8) | 20.9 (14.4 - 26.1) | 0.821 | 20.3 (13.2 - 29.2) | 20.5 (13.4 - 31.8) | 0.662 |
| Alb (g/dL) | 3.4 (2.0 - 4.1) | 3.5 (2.0 - 4.7) | 0.332 | 3.4 (2.4 - 4.1) | 3.1 (2.4 - 4.1) | 0.245 |
| Cosine similarity | -0.84 (-0.98 - -0.76) | -0.49 (-0.69 - -0.16) | < 0.001*** | 0.41 (0.14 - 0.62) | 0.90 (0.65 - 1.00) | < 0.001*** |
| Type of hospital meal (a normal diet or special therapeutic diet) (normal/special) | 16 (7/9) | 9 (0/9) | 0.027* | 12 (5/7) | 14 (3/11) | 0.401 |
| Intake (staple food) | 1.00 (0.93 - 1.00) | 1.00 (0.58 - 1.00) | 0.199 | 1.00 (0.66 - 1.00) | 0.99 (0.40 - 1.00) | 0.053 |
| Intake (side dish) | 1.00 (0.86 - 1.00) | 0.96 (0.66 - 1.00) | 0.096 | 1.00 (0.81 - 1.00) | 0.98 (0.54 - 1.00) | 0.074 |