
Figure 1. PRISMA flow diagram. PRISMA: Preferred Reporting Items for Systematic Reviews and Meta-Analyses.
| Journal of Clinical Medicine Research, ISSN 1918-3003 print, 1918-3011 online, Open Access |
| Article copyright, the authors; Journal compilation copyright, J Clin Med Res and Elmer Press Inc |
| Journal website https://www.jocmr.org |
Original Article
Volume 15, Number 7, July 2023, pages 343-359
Protein Induced by Vitamin K Absence or Antagonist-II Versus Alpha-Fetoprotein in the Diagnosis of Hepatocellular Carcinoma: A Systematic Review With Meta-Analysis
Figures


Tables
| Study and year of publication | Country | Sample size of HCCs/controls | Type of controls | Median or mean age of HCC/control (years) | Cut-off value of PIVKA-II | Cut-off value of AFP | Etiology of HCC | Sensitivity of PIVKA-II/AFP | Specificity of PIVKA-II/AFP |
|---|---|---|---|---|---|---|---|---|---|
| AFP: α-fetoprotein; AIH: autoimmune hepatitis; HBV: hepatitis B virus; HCC: hepatocellular carcinoma; HCV: hepatitis C virus; NASH: nonalcoholic steatohepatitis; PIVKA-II: protein induced by vitamin K absence or antagonist-II. | |||||||||
| Abd El Gawad et al 2014 [17] | Egypt | 40/20 | Cirrhosis + healthy controls | 59/57 | 1.2 ng/mL | 40.5 ng/mL | Mixed | 97.5%/82.5% | 90%/85% |
| Beneduce et al 2008 [18] | Italy | 33/31 | Healthy controls | 61/55 | 2 ng/mL | 20 ng/mL | HCV | 39%/48% | 100%/100% |
| Caviglia et al 2020 [19] | Italy | 149/200 | Cirrhosis | 67/61 | > 73 mAU/mL | > 9.7 ng/mL | Mixed | 68%/72% | 84%/66% |
| Cerban et al 2019 [20] | Romania | 101/52 | Cirrhosis | 60.3/59.4 | > 63 mAU/mL | > 18.9 ng/mL | Mixed | 81.36%/52.54% | 60.61%/93.94% |
| Chan et al 2022 [21] | China | 168/208 | Disease controls | 62.86/52.18 | 28.4 ng/mL | 20 ng/mL | Mixed | 86.9%/51.8% | 83.7%/98.1% |
| Chen et al 2020 [22] | China | 110/250 | Chronic hepatitis B + cirrhosis + healthy controls | 55.62/54.29 | 51 mAU/mL | 5.65 ng/mL | HBV | 85%/84.1% | 93.3%/70.90% |
| Choi 2013 [13] | South Korea | 90/78 | Benign liver disease | 59.7/55.6 | 40 AU/L | 10 ng/mL | Mixed | 62.2%/78.9% | 94.9%/84.6% |
| Cui et al 2003 [23] | China | 120/90 | Cirrhosis | 59/56 | 40 mAU/mL | 20 ng/mL | Mixed | 53.3%/58.3% | 85.6%/63.3% |
| Durazo et al 2008 [24] | USA | 144/96 | Cirrhosis + chronic hepatitis | 54.2/45.85 | 84 mAU/mL | 25 ng/mL | Mixed | 87%/69% | 85%/87% |
| Ekmen et al 2020 [25] | Turkey | 66/46 | Cirrhosis | 54.53/54.45 | 2.63 ng/mL | 6.08 ng/mL | Mixed | 71%/77% | 83%/77% |
| Ertle et al 2012 [26] | Germany | 164/422 | Viral hepatitis, cirrhosis, other chronic liver diseases such as NASH, AIH and others | 64/48.8 | 5 ng/mL | 10 ng/mL | Mixed | 63.4%/54.9% | 94.5%/94.5% |
| Feng et al 2021 [27] | China | 168/153 | Healthy controls | ND | 35.60 mAU/mL | 17.76 ng/mL | Mixed | 83.93%/64.29% | 91.50%/90.20% |
| Fujiyama et al 1992 [28] | Japan | 200/197 | Cirrhosis + chronic hepatitis + hemangioma + liver cysts | 60.7/52.6 | 0.11 AU/mL | 150 ng/mL | Mixed | 54%/54% | 98%/95.9% |
| Gentile et al 2017 [29] | Italy | 56/104 | HCV without HCC | 70/66 | > 36 mAU/mL | > 12 ng/mL | HCV | 78.6%/60% | 66.3%/77.2% |
| Grazi et al 1995 [30] | Italy | 111/116 | Postnecrotic cirrhosis + liver metastases from colorectal cancer + benign liver lesions + tumors not affecting the liver without hepatic metastases, and other diseases | 60.9/49.9 | 0.09 AU/mL | 20 ng/dL | Mixed | 53.3%/54.9% | 88.1%/97.4% |
| Guan et al 2022 [31] | China | 139/345 | ND | 60.6/56.2 | 40 mAU/mL | 20 ng/mL | Nonalcoholic fatty liver | 74.8%/52.5% | 91.0%/97.4% |
| Hadi et al 2022 [32] | Malaysia | 40/123 | Liver cirrhosis + non-cirrhotic high-risk patients | 64.5/56.5 | 36.7 mAU/mL | 14.2 ng/mL | Mixed | 90%/75% | 82.1%/93.5% |
| Huang et al 2017 [33] | China | 132/450 | Viral hepatitis + liver cirrhosis + metastatic hepatic carcinoma + other benign liver diseases + healthy individuals | 53.7/47.45 | ≥ 40 mAU/mL | ≥ 20 ng/mL | Mixed | 80%/68% | 89%/91% |
| Ismail et al 2017 [34] | Egypt | 66/83 | Malignant tumors or benign liver lesions | 59/46 | 28 ng/mL | 20 ng/mL | Mixed | 90.9%/68.2% | 97.6%/91.6% |
| Jang et al 2016 [35] | France | 208/193 | Cirrhosis | 61.02/57.85 | > 10 ng/mL | > 20 ng/mL | Mixed | 51%/62% | 91.2%/90.2% |
| Ji et al 2016 [36] | China | 236/285 | Hemangiomas of liver, metastatic hepatic carcinoma and liver cirrhosis + healthy control | 51/50.22 | 40 mAU/mL | 20 ng/mL | Mixed | 82.63%/67.80% | 89.12%/91.23% |
| King et al 1989 [37] | South Africa | 98/120 | Hepatic metastases + amoebic hepatic abscesses + chronic hepatic parenchymal disease | 46.7/54.77 | > 1.5 mU/mL | > 20 ng/mL | Mixed | 67.3%/83.7% | 84.2%/90.8% |
| Lee et al 2021 [38] | China | 158/62 | Chronic hepatitis B | ND | ND | ND | HBV | 68.4%/57.6% | 98.4%/93.5% |
| Lim et al 2015 [39] | South Korea | 361/276 | Cirrhosis | 58/55 | 40 mAU/mL | 20 ng/mL | Mixed | 62.9%/56.8% | 90.8%/82.8% |
| Liu et al 2022 [40] | China | 105/172 | HCV-infected patients | 60.8/55.8 | 40 mAU/mL | 20 ng/mL | HCV | 78.1%/56.2% | 89.0%/90.1% |
| Loglio et al 2020 [41] | Italy | 64/148 | HBV-infected patients | 66/60 | > 48 mAU/mL | > 4.2 ng/mL | HBV | 64%/56% | 91%/94% |
| Marrero et al 2003 [42] | USA | 55/104 | Cirrhosis and chronic hepatitis | 56.2/51 | 125 mAU/mL | 11 ng/mL | Mixed | 89%/77% | 95%/79% |
| Marrero et al 2009 [43] | USA | 419/417 | Cirrhosis | 60.5/55 | 150 mAU/mL | 20 ng/mL | Mixed | 74%/59% | 70%/90% |
| Morota et al 2011 [44] | USA | 70/156 | Cirrhosis + hepatitis + normal | ND | 123.9 AU/L | 15.3 mg/L | Mixed | 84.3%/62.9% | 88.1%/92.3% |
| Nomura et al 1999 [45] | Japan | 36/49 | Cirrhosis | ND | ND | 20 ng/mL | Mixed | 27.8%/58.3% | 95.9%/75.5% |
| Park et al 2016 [46] | South Korea | 79/77 | Cirrhosis | 62.33/55.59 | > 40 mAU/mL | >10 ng/mL | Mixed | 70.89%/68.35% | 70.13%/81.82% |
| Peng et al 2022 [47] | China | 148/143 | Cirrhosis | 55/51 | > 199.9 mAU/mL | > 619.3 ng/mL | HBV | 78.65%/49.44% | 99.30%/98.60% |
| Pote et al 2014 [48] | France | 85/43 | Cirrhosis | 57.8/54.8 | 42 mAU/mL | 5.5 ng/mL | Mixed | 73%/61% | 81%/50% |
| Qi et al 2019 [49] | China | 120/89 | Chronic liver disease | 56/47 | 33.080 mAu/mL | 11.880 ng/mL | Mixed | 83.5%/73.6% | 71.6%/80.7% |
| Seo et al 2015 [50] | South Korea | 157/879 | Chronic hepatitis B | 57/45 | 40 mAU/mL | 10 ng/mL | HBV | 73.9%/67.5% | 89.7%/90.3% |
| Sharma et al 2010 [12] | India | 70/38 | Cirrhosis | 58.84/47.92 | 9.2 ng/mL | 13.02 ng/mL | Mixed | 80%/72.9% | 92.1%/65.8% |
| Shimizu et al 2022 [51] | Japan | 56/34 | Cirrhosis | 62/61 | 40 mAU/mL | 20 ng/mL | Mixed | 46.4%/58.9% | 97.1%/85.3% |
| Si et al 2020 [52] | China | 266/167 | Benign liver disease and healthy individuals | ND | 41.74 mAU/mL | 21.8 ng/mL | HBV | 81.2%/51.5% | 88.5%/89.7% |
| Song et al 2014 [53] | China | 550/604 | Malignant disease + chronic liver disease + benign disease + healthy participants | 51/41.5 | 86 mAU/mL | 21 ng/mL | Mixed | 71.50%/68.00% | 86.30%/93.20% |
| Song et al 2020 [54] | China | 88/112 | Chronic HBV + cirrhosis | ND | 44 mAU/mL | 5 ng/mL | Mixed | 55.7%/65.9% | 94.6%/88.4% |
| Sterling et al 2009 [55] | Canada | 74/298 | Healthy participants | 54.9/52.1 | > 200 ng/mL | 20 ng/mL | HCV | 56.3%/60.8% | 100%/71.1% |
| Suehiro et al 1993 [56] | Japan | 185/90 | Cholangiocellular carcinoma + cirrhosis | ND | ND | ND | Mixed | 35.1%/65.4% | 95.3%/71.8% |
| Takikawa et al 1992 [57] | Japan | 116/253 | Cirrhosis | ND | 0.1 AU/mL | 20 ng/mL | Mixed | 52.8%/70.1% | 98.8%/75.5% |
| Tian et al 2022 [58] | China | 145/57 | Benign liver disease | 58.9/48.1 | 38.91 mAU/mL | 5.6 ng/mL | Mixed | 92.4%/88.3% | 96.5%/98.2% |
| Viggiani et al 2016 [59] | Italy | 60/60 | Benign liver disease | 39 - 86/26 - 84 | 47 mAU/mL | 20 mAU/mL | Mixed | 60%/55% | 90%/55% |
| Volk et al 2007 [60] | USA | 84/169 | Cirrhosis | 59/53 | 150 mAU/mL | 23 ng/mL | Mixed | 86%/69% | 93%/91% |
| Wang et al 2005 [61] | Taiwan | 61/66 | Chronic hepatitis and cirrhosis | 63/54.5 | 40 mAU/mL | 20 ng/mL | Mixed | 77%/59% | 86.4%/77.3% |
| Wang et al 2019 [62] | China | 176/359 | Chronic hepatitis B | 53/49 | 162.22 mAU/mL | 145.65 ng/mL | HBV | 51.3%/64.8% | 93.6%/77.2% |
| Wang et al 2020 [63] | China | 234/396 | Chronic hepatitis B | 54/48 | 87.63 mAU/mL | 499.80 ng/mL | HBV | 86.80%/52.10% | 90.20%/91.40% |
| Xu et al 2021 [64] | China | 308/120 | Benign liver disease + cirrhosis | 51.4/44.56 | 40 mAU/mL | 25 ng/mL | Mixed | 89.0%/86.8% | 91.7%/87.6% |
| Yoon et al 2009 [65] | South Korea | 106/100 | Non-HCC | 54.5/ND | 40 mAU/mL | 20 ng/mL | Mixed | 51.9%/57.5% | 97%/88% |
| Yu et al 2015 [66] | China | 134/505 | Liver diseases + other cancers + healthy controls | 49.6/50.93 | 200 mAU/mL | 195.2 ng/mL | Mixed | 64.2%/60.4% | 90.8%/89.6% |
| Zhang and Huang 2022 [67] | China | 228/103 | Cirrhosis | 56/58 | 25.3 ng/mL | 7 ng/mL | Mixed | 70.18%/63.16% | 82.50%/85.44% |
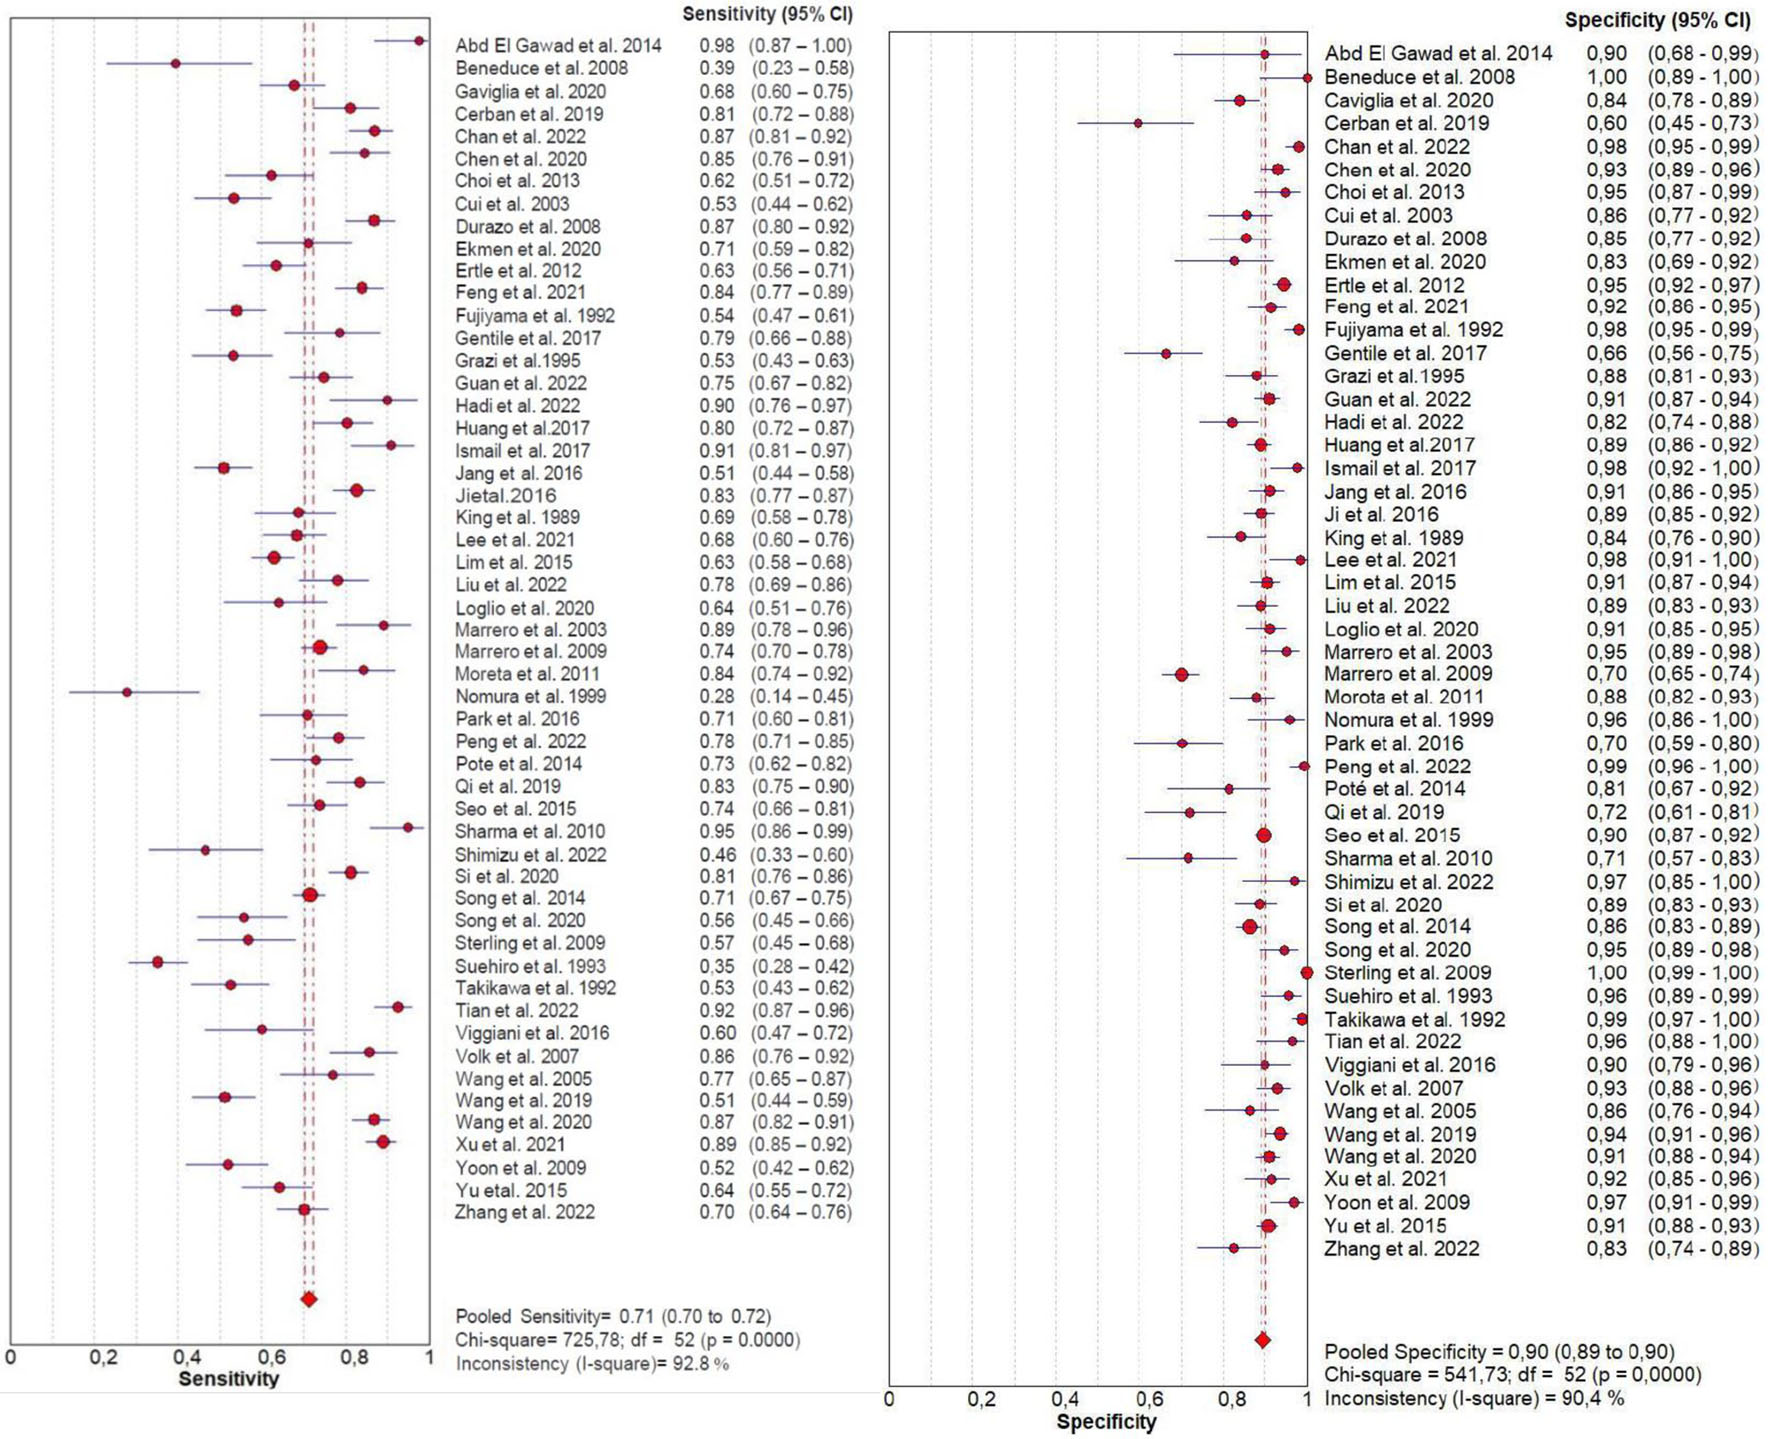
| Marker | Sensitivity (95% CI) | Specificity (95% CI) | NLR (95% CI) | PLR (95% CI) | DOR (95% CI) | AUC (95% CI) |
|---|---|---|---|---|---|---|
| AFP: α-fetoprotein; AUC: area under the ROC curve; CI: confidence interval; DOR: diagnostic odds ratio; NLR: negative likelihood ratio; PIVKA-II: protein induced by vitamin K absence or antagonist-II; PLR: positive likelihood ratio. | ||||||
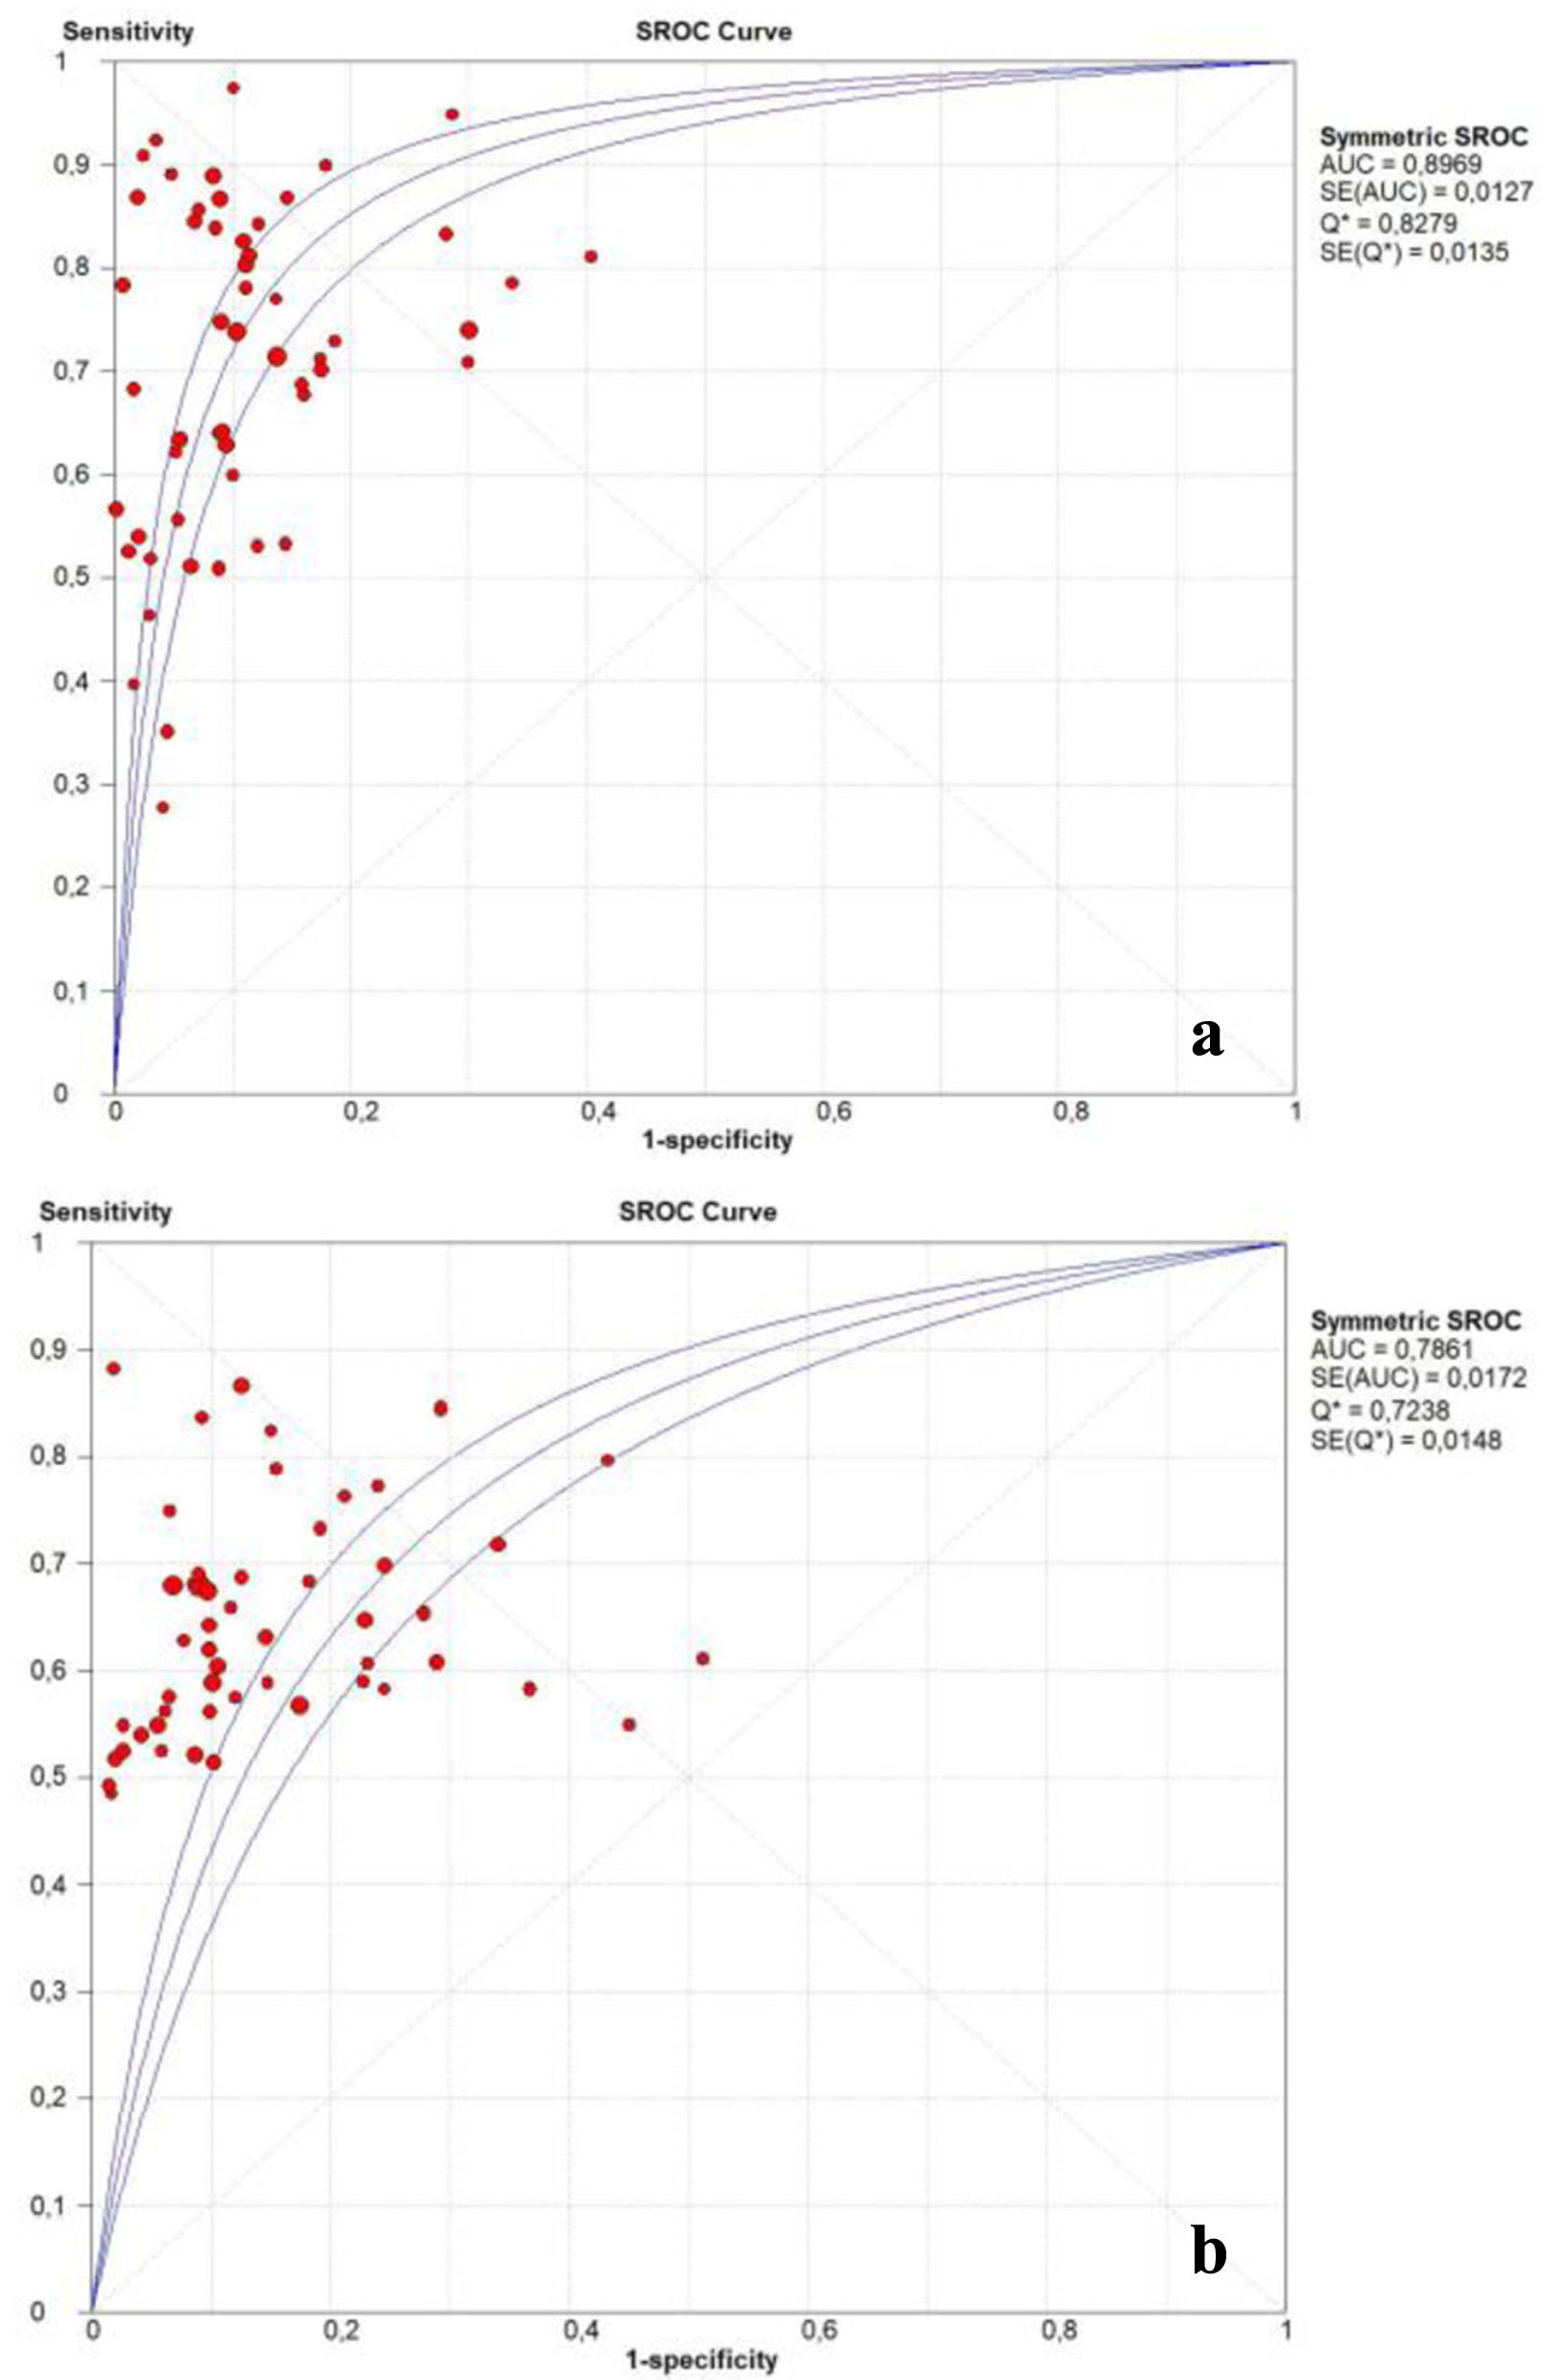
| PIVKA-II | 0.71 (0.70 - 0.72) | 0.90 (0.89 - 0.90) | 0.30 (0.27 - 0.35) | 7.18 (5.96 - 8.66) | 27.12 (21.14 - 37.79) | 0.89 (0.88 - 0.90) |
| AFP | 0.64 (0.63 - 0.65) | 0.87 (0.87 - 0.88) | 0.42 (0.39 - 0.45) | 5.08 (4.20 - 6.15) | 12.94 (10.35 - 16.18) | 0.78 (0.77 - 0.79) |
| Factor | PIVKA-II | AFP | ||
|---|---|---|---|---|
| Coefficient | P value | Coefficient | P value | |
| AFP: α-fetoprotein; PIVKA-II: protein induced by vitamin K absence or antagonist-II. | ||||
| Ethnicity | 0.335 | 0.105 | -0.061 | 0.673 |
| Etiology | 0.185 | 0.287 | -0.084 | 0.500 |
| Sample size | -0.026 | 0.930 | 0.014 | 0.949 |
| Moderator | Subgroups | PIVKA-II | AFP | ||||||
|---|---|---|---|---|---|---|---|---|---|
| Sensitivity (95% CI) | Specificity (95% CI) | DOR (95% CI) | AUC (95% CI) | Sensitivity (95% CI) | Specificity (95% CI) | DOR (95% CI) | AUC (95% CI) | ||
| AFP: α-fetoprotein; AUC: area under the ROC curve; CI: confidence interval; DOR: diagnostic odds ratio; HBV: hepatitis B virus; HCV: hepatitis C virus; PIVKA-II: protein induced by vitamin K absence or antagonist-II. | |||||||||
| Ethnicity | Africa | 0.817 (0.756 - 0.868) | 0.897 (0.849 - 0.933) | 10,415 (6,314 - 17,179) | 0.968 (0.945 - 0.986) | 0.784 (0.721 - 0.839) | 0.906 (0.860 - 0.941) | 34,544 (19,580 - 60,945) | 0.940 (0.934 - 0.946) |
| Europe | 0.634 (0.604 - 0.662) | 0.875 (0.857 - 0.892) | 12,082 (8,798 - 16,591) | 0.812 (0.804 - 0.824) | 0.603 (0.574 - 0.633) | 0.852 (0.833 - 0.870) | 9,145 (4,753 - 17,595) | 0.706 (0.697 - 0.714) | |
| Asia | 0.716 (0.703 - 0.728) | 0.906 (0.899 - 0.913) | 30,759 (23,184 - 40,809) | 0.910 (0.045 - 0.921) | 0.643 (0.629 - 0.655) | 0.879 (0.872 - 0.887) | 13,858 (10,441 - 17,676) | 0.799 (0.784 - 0.808) | |
| America | 0.777 (0.747 - 0.804) | 0.859 (0.838 - 0.878) | 53,251 (15,058 - 188,31) | 0.912 (0.903 - 0.923) | 0.632 (0.599 - 0.665) | 0.848 (0.826 - 0.867) | 12,366 (7,213 - 21,202) | 0.733 (0.721 - 0.749) | |
| Etiology | Mixed | 0.706 (0.694 - 0.718) | 0.885 (0.887 - 0.893) | 24,933 (18,697 - 33,250) | 0.901 (0.897 - 0.911) | 0.657 (0.645 - 0.669) | 0.874 (0.866 - 0.882) | 12,967 (9,893 - 16,995) | 0.785 (0.778 - 0.796) |
| HCV | 0.675 (0.616 - 0.731) | 0.911 (0.885 - 0.932) | 31,639 (7,453 - 134,31) | 0.845 (0.831 - 0.853) | 0.575 (0.513 - 0.635) | 0.790 (0.755 - 0.822) | 6,865 (3,346 - 14,083) | 0.665 (0.650 - 0.670) | |
| HBV | 0.749 (0.724 - 0.772) | 0.917 (0.905 - 0.927) | 40,281 (23,256 - 69,770) | 0.912 (0.904 - 0.924) | 0.588 (0.561 - 0.615) | 0.873 (0.859 - 0.886) | 13,718 (9,209 - 20,434) | 0.820 (0.809 - 0.831) | |
| Sample size | ≤ 100 | 0.711 (0.686 - 0.735) | 0.893 (0.879 - 0.907) | 27,398 (17,183 - 43,685) | 0.903 (0.891 - 0,910) | 0.678 (0.652 - 0.702) | 0.823 (0.806 - 0.840) | 10,350 (6,626 - 16,169) | 0.773 (0.764 - 0,779) |
| > 100 | 0.714 (0.702 - 0.725) | 0.896 (0.889 - 0.902) | 27,279 (20,162 - 36,907) | 0.890 (0.881 - 0.896) | 0.631 (0.619 - 0.643) | 0.844 (0.877 - 0.891) | 14,678 (11,381 - 19,930) | 0.796 (0.789 - 0.802) | |