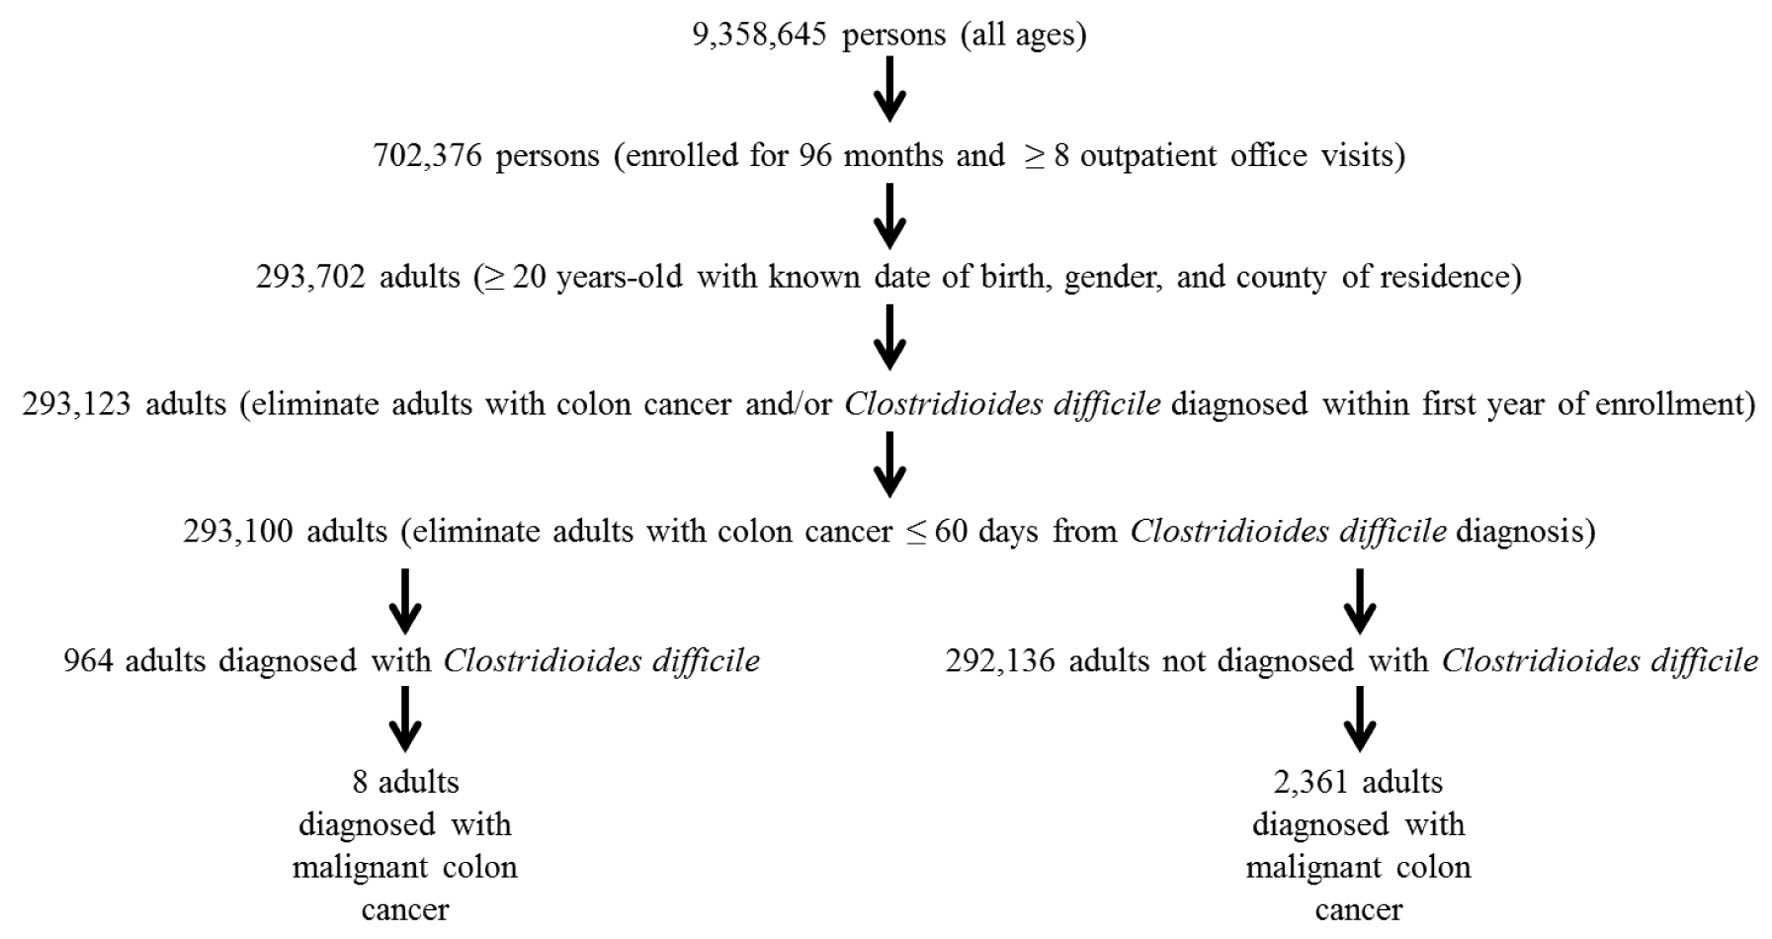
Figure 1. A schematic flowchart of the data examined in the present study.
| Journal of Clinical Medicine Research, ISSN 1918-3003 print, 1918-3011 online, Open Access |
| Article copyright, the authors; Journal compilation copyright, J Clin Med Res and Elmer Press Inc |
| Journal website https://www.jocmr.org |
Original Article
Volume 15, Number 6, June 2023, pages 310-320
Colon Cancer Risk Following Intestinal Clostridioides difficile Infection: A Longitudinal Cohort Study
Figures
Tables
| Parameter examined | Non-Cdiff cohort (n = 292,136) | Cdiff cohort (n = 964) |
|---|---|---|
| aAll adults were enrolled for 96 consecutive months. All adults had ≥ 8 outpatient office visits during their enrollment period. All adults diagnosed with Cdiff and/or colon cancer within the first year of enrollment were excluded. bAll adults were specified to have a county of residence at the time of initial enrollment and at the end of the enrollment period. There are a total of 67 counties in the state of Florida, which are grouped by the state of Florida based upon geographical areas into 11 districts. cPersonal history of tobacco abuse (ICD-9 code: 305.1x). dPersonal history of alcohol abuse/dependence (ICD-9 code: 303.xx or 305.0x). ePersonal history of drug abuse/dependence (ICD-9 code: 304.xx, 305.2x, 305.3x, 305.34, 305.5x, 305.6x, 305.7x, 305.8x or 305.9x). fPersonal history of overweight/obesity (ICD9 code: 278.00, 278.01, or 278.02). gFamily history of any type of cancer (ICD-9 code: V16.xx). Cdiff: Clostridioides (formerly known as Clostridium) difficile; CI: confidence interval; SD: standard deviation. | ||
| Gender (%) | ||
| Male | 83,473 (28.57%) | 337 (34.96%) |
| Female | 208,663 (71.43%) | 627 (64.97%) |
| Date of birth in years, mean ± SD (range) | 1942 ± 18.27 (1,898 - 1,984) | 1947 ± 14.47 (1,901 - 1,982) |
| Age in years at initial study enrollment, mean ± SD (range) | 51.24 ± 17.96 (20 - 96) | 50.11 ± 14.18 (20 - 91) |
| Residency at initial enrollment (%)b | ||
| District 1 | 13,356 (4.57%) | 39 (4.05%) |
| District 2 | 18,296 (6.26%) | 60 (6.22%) |
| District 3 | 27,652 (9.47%) | 111 (11.52%) |
| District 4 | 23,551 (8.06%) | 105 (10.89%) |
| District 5 | 17,663 (6.05%) | 89 (9.23%) |
| District 6 | 31,024 (10.62%) | 82 (8.51%) |
| District 7 | 23,647 (8.09%) | 91 (9.44%) |
| District 8 | 11,817 (4.04%) | 51 (5.29%) |
| District 9 | 15,682 (5.37%) | 49 (5.08%) |
| District 10 | 14,522 (4.97%) | 52 (5.39%) |
| District 11 | 94,926 (32.50%) | 235 (24.38%) |
| Residency at the end enrollment (%)b | ||
| District 1 | 13,352 (4.57%) | 41 (4.25%) |
| District 2 | 18,359 (6.28%) | 58 (6.02%) |
| District 3 | 28,369 (9.71%) | 118 (12.24%) |
| District 4 | 23,740 (8.13%) | 103 (10.69%) |
| District 5 | 17,919 (6.13%) | 91 (9.44%) |
| District 6 | 30,980 (10.60%) | 86 (8.92%) |
| District 7 | 23,843 (8.16%) | 89 (9.23%) |
| District 8 | 12,030 (4.12%) | 51 (5.29%) |
| District 9 | 15,714 (5.38%) | 46 (4.77%) |
| District 10 | 14,853 (5.08%) | 47 (4.88%) |
| District 11 | 92,977 (31.83%) | 234 (24.27%) |
| Personal history | ||
| Tobacco abuse (%)c | 1,938 (0.66%) | 11 (1.14%) |
| Alcohol abuse/dependence (%)d | 17,475 (5.98%) | 153 (15.87%) |
| Drug abuse/dependence (%)e | 17,088 (5.85%) | 159 (16.49%) |
| Overweight/obesity (%)f | 15,287 (5.23%) | 162 (16.80%) |
| Family history | ||
| Cancer (%)g | 2,684 (0.92%) | 24 (2.49%) |
| Person-years | ||
| Total | 2,036,767 | 2,575 |
| Mean ± SD (range) | 6.97 ± 0.37 (0.008 - 7.00) | 2.67 ± 1.98 (0.003 - 7.00) |
| Cohort examined (n) | Gender (%) | Date of birth, mean ± SD (range) | Age of initial diagnosis, mean ± SD (range) | Incidence rate per 1,000 person-years (n) |
|---|---|---|---|---|
| aAdults diagnosed with colon cancer were diagnosed according to the International Code for Disease 9th revision with the code 153.xx. bAll adults were enrolled for 96 consecutive months. All adults had ≥ 8 outpatient office visits during their enrollment period. All adults diagnosed with Cdiff and/or colon cancer within the first year of enrollment were excluded. Cdiff: Clostridioides (formerly known as Clostridium) difficile; SD: standard deviation. | ||||
| All adults (n = 293,100) | Male: 753 (31.79%) | 1933 ± 15.3 (1,899 - 1,980) | 61.76 ± 13.77 (21 - 92) | 1.16 (2,369) |
| Female: 1,616 (68.21%) | ||||
| Non-Cdiff cohort (n = 292,136) | Male: 751 (31.81%) | 1933 ± 15.1 (1,899 - 1,979) | 61.78 ± 13.77 (21 - 92) | 1.16 (2,361) |
| Female: 1,610 (68.19%) | ||||
| Cidff cohort (n = 964) | Male: 2 (25.00%) | 1943 ± 10.5 (1,924 - 1,955) | 61.9 ± 12.9 (47 - 85) | 3.11 (8) |
| Female: 6 (75.00%) | ||||
| Parameter examined | Cdiff cohort (n = 964) | Non-Cdiff cohort (n = 292,136) | Risk ratio (95% CI) |
|---|---|---|---|
| Attributable rate per 1,000 person-years (95% CI) | |||
| *P < 0.05. aAdults diagnosed with colon cancer were diagnosed according to the International Code for Disease 9th revision with the code 153.xx. bAll adults were enrolled for 96 consecutive months. All adults had ≥ 8 outpatient office visits during their enrollment period. All adults diagnosed with Cdiff and/or colon cancer within the first year of enrollment were excluded. Cdiff: Clostridioides (formerly known as Clostridium) difficile; CI: confidence interval. | |||
| Colon cancer (n) | 8 | 2,361 | |
| Incidence rate per 1,000 person-years | 3.11 | 1.16 | 2.68 (1.16 to 5.29)* |
| 1.95 (0.63 to 3.26) | |||
| Model type | Variable | Hazards ratio (95% CI) |
|---|---|---|
| *P < 0.01. **P < 0.001. aAdults diagnosed with colon cancer. bAll adults were enrolled for 96 consecutive months. All adults had ≥ 8 outpatient office visits during their enrollment period. All adults diagnosed with Cdiff and/or colon cancer within the first year of enrollment were excluded. Cdiff: Clostridioides (formerly known as Clostridium) difficile; CI: confidence interval. | ||
| Unadjusted model | ||
| Cdiff (diagnosed vs. not diagnosed) | 2.646 (1.321 to 5.301)* | |
| Adjusted model I | ||
| Cdiff (diagnosed vs. not diagnosed) | 2.657 (1.325 to 5.330)* | |
| Gender (female vs. male) | 0.840 (0.770 to 0.917)** | |
| Date of birth in years | 1.034 (1.024 to 1.043)** | |
| Residency at initial enrollment | 1.000 (0.995 to 1.006) | |
| Residency at end of enrollment | 0.997 (0.991 to 1.003) | |
| Age in years at initial enrollment | 1.072 (1.062 to 1.082)** | |
| Model type | Variable | Hazards ratio (95% CI) |
|---|---|---|
| *P < 0.05. **P < 0.01. ***P < 0.001. aAdults diagnosed with colon cancer. bAll adults were enrolled for 96 consecutive months. All adults had ≥ 8 outpatient office visits during their enrollment period. cAdults were assessed to determine whether at least one colonoscopy screening procedure was undertaken within the appropriate study period. dAdults were assessed to determine the total number of colonoscopy screening procedures undertaken within the appropriate study period. eAdults diagnosed with ulcerative colitis, infectious colitis, immunodeficiency, or any type of cancer before a Cdiff diagnosis were excluded. Adults diagnosed with ulcerative colitis, infectious colitis, immunodeficiency, or any types of cancer before a colon cancer diagnosis were excluded. Cdiff: Clostridioides (formerly known as Clostridium) difficile; CI: confidence interval. | ||
| Adjusted model II | ||
| Cdiff (diagnosed vs. not diagnosed) | 2.673 (1.333 to 5.360)** | |
| Gender (female vs. male) | 0.836 (0.767 to 0.913)*** | |
| Date of birth in years | 1.031 (1.022 to 1.041)*** | |
| Residency at initial enrollment | 1.000 (0.995 to 1.006) | |
| Residency at end of enrollment | 0.997 (0.991 to 1.003) | |
| Age in Years at Initial Enrollment | 1.069 (1.059 to 1.080)*** | |
| ≥ 1 colonoscopy screening procedurec (yes vs. no) | 1.210 (1.059 to 1.381)** | |
| Adjusted model III | ||
| Cdiff (diagnosed vs. not diagnosed) | 2.667 (1.3330 to 5.348)** | |
| Gender (female vs. male) | 0.836 (0.767 to 0.913)*** | |
| Date of birth in years | 1.031 (1.022 to 1.041)*** | |
| Residency at initial enrollment | 1.000 (0.995 to 1.006) | |
| Residency at end of enrollment | 0.997 (0.991 to 1.003) | |
| Age in years at initial enrollment | 1.069 (1.059 to 1.080)*** | |
| Total colonoscopy screening proceduresd | 1.161 (1.048 to 1.285)** | |
| Adjusted model IV | ||
| Cdiff (diagnosed vs. not diagnosed) | 2.471 (1.232 to 4.958)* | |
| Gender (female vs. male) | 0.821 (0.752 to 0.897)*** | |
| Date of birth in years | 1.024 (1.015 to 1.034)*** | |
| Residency at initial enrollment | 1.000 (0.994 to 1.006) | |
| Residency at end of enrollment | 0.997 (0.991 to 1.003) | |
| Age in years at initial enrollment | 1.064 (1.054 to 1.075)*** | |
| Total colonoscopy screening proceduresd | 1.105 (0.996 to 1.226) | |
| Family history of any type of cancer | 3.547 (3.589 to 5.534)*** | |
| Personal history of tobacco abuse | 0.996 (0.516 to 1.923) | |
| Personal history of alcohol abuse/dependence | 1.195 (0.975 to 1.466) | |
| Personal history of drug abuse/dependence | 1.121 (0.892 to 1.409) | |
| Personal history of overweight/obesity | 1.251 (1.043 to 1.500)3* | |
| Adjusted model Ve | ||
| Cdiff (diagnosed vs. not diagnosed) | 2.970 (1.478 to 5.970)** | |
| Gender (female vs. male) | 0.758 (0.681 to 0.844)*** | |
| Date of birth in years | 1.027 (1.015 to 1.039)*** | |
| Residency at initial enrollment | 1.000 (0.993 to 1.007) | |
| Residency at end of enrollment | 0.997 (0.990 to 1.004) | |
| Age in years at initial enrollment | 1.071 (1.058 to 1.084)*** | |
| Total colonoscopy screening proceduresd | 1.082 (0.946 to 1.237) | |
| Family history of any type of cancer | 5.242 (3.975 to 6.913)*** | |
| Personal history of tobacco abuse | 1.075 (0.480 to 2.405) | |
| Personal history of alcohol abuse/dependence | 1.217 (0.944 to 1.570) | |
| Personal history of drug abuse/dependence | 1.153 (0.866 to 1.535) | |
| Personal history of overweight/obesity | 1.242 (0.990 to 1.560) | |
| Model type | Variable | Hazards ratio (95% CI) |
|---|---|---|
| *P < 0.05. **P < 0.01. ***P < 0.001. aAdults diagnosed with colon cancer. b All adults were enrolled for 96 consecutive months. All adults had ≥ 8 outpatient office visits during their enrollment period. cAdults were assessed to determine whether at least one colonoscopy screening procedure was undertaken within the appropriate study period. dAdults were assessed to determine the total number of colonoscopy screening procedures undertaken within the appropriate study period. eAdults diagnosed with ulcerative colitis, infectious colitis, immunodeficiency, or any type of cancer before a Cdiff diagnosis were excluded. Adults diagnosed with ulcerative colitis, infectious colitis, immunodeficiency, or any types of cancer before a colon cancer diagnosis were excluded. Cdiff: Clostridioides (formerly known as Clostridium) difficile; CI: confidence interval. | ||
| Adjusted model II | ||
| Cdiff (diagnosed vs. not diagnosed) | 4.064 (1.686 to 9.800)** | |
| Gender (female vs. male) | 0.790 (0.705 to 0.885)*** | |
| Date of birth in years | 1.023 (1.011 to 1.035)*** | |
| Residency at initial enrollment | 1.001 (0.994 to 1.009) | |
| Residency at end of enrollment | 0.995 (0.988 to 1.003) | |
| Age in years at initial enrollment | 1.062 (1.048 to 1.076)*** | |
| ≥ 1 colonoscopy screening procedurec (yes vs. no) | 1.468 (1.189 to 1.811)*** | |
| Adjusted model III | ||
| Cdiff (diagnosed vs. not diagnosed) | 4.039 (1.675 to 9.739)** | |
| Gender (female vs. male) | 0.790 (0.705 to 0.885)*** | |
| Date of birth in years | 1.023 (1.010 to 1.035)*** | |
| Residency at initial enrollment | 1.001 (0.994 to 1.009) | |
| Residency at end of enrollment | 0.995 (0.988 to 1.003) | |
| Age in years at initial enrollment | 1.062 (1.048 to 1.075)*** | |
| Total colonoscopy screening proceduresd | 1.353 (1.140 to 1.605)*** | |
| Adjusted model IV | ||
| Cdiff (diagnosed vs. not diagnosed) | 3.761 (1.559 to 9.078)** | |
| Gender (female vs. male) | 0.786 (0.700 to 0.881)*** | |
| Date of birth in years | 1.016 (1.004 to 1.029)* | |
| Residency at initial enrollment | 1.001 (0.994 to 1.009) | |
| Residency at end of enrollment | 0.995 (0.988 to 1.003) | |
| Age in years at initial enrollment | 1.057 (1.043 to 1.071)*** | |
| Total colonoscopy screening proceduresd | 1.302 (1.095 to 1.547)** | |
| Family history of any type of cancer | 3.387 (2.427 to 4.725)*** | |
| Personal history of tobacco abuse | 0.929 (0.384 to 2.243) | |
| Personal history of alcohol abuse/dependence | 1.369 (1.060 to 1.770)* | |
| Personal history of drug abuse/dependence | 1.082 (0.799 to 1.465) | |
| Personal history of overweight/obesity | 1.329 (1.047 to 1.686)* | |
| Adjusted model Ve | ||
| Cdiff (diagnosed vs. not diagnosed) | 4.562 (1.885 to 11.041)*** | |
| Gender (female vs. male) | 0.735 (0.638 to 0.848)*** | |
| Date of birth in years | 1.019 (1.004 to 1.035)* | |
| Residency at initial enrollment | 0.999 (0.990 to 1.008) | |
| Residency at end of enrollment | 0.997 (0.988 to 1.007) | |
| Age in years at initial enrollment | 1.064 (1.047 to 1.081)*** | |
| Total colonoscopy screening proceduresd | 1.320 (1.061 to 1.644)* | |
| Family history of any type of cancer | 4.402 (2.954 to 6.559)*** | |
| Personal history of tobacco abuse | 1.231 (0.458 to 3.306) | |
| Personal history of alcohol abuse/dependence | 1.377 (0.995 to 1.905) | |
| Personal history of drug abuse/dependence | 1.086 (0.739 to 1.596) | |
| Personal history of overweight/obesity | 1.357 (1.010 to 1.825)* | |