Journal of Clinical Medicine Research, ISSN 1918-3003 print, 1918-3011 online, Open Access
Article copyright, the authors; Journal compilation copyright, J Clin Med Res and Elmer Press Inc
Journal website https://www.jocmr.org

Original Article

Volume 15, Number 1, January 2023, pages 23-30


Factors Influencing Sarcopenic Changes in YUBI-WAKKA Finger-Ring Test Results After One Year: A Retrospective Observational Study

Figure

Figure 1.
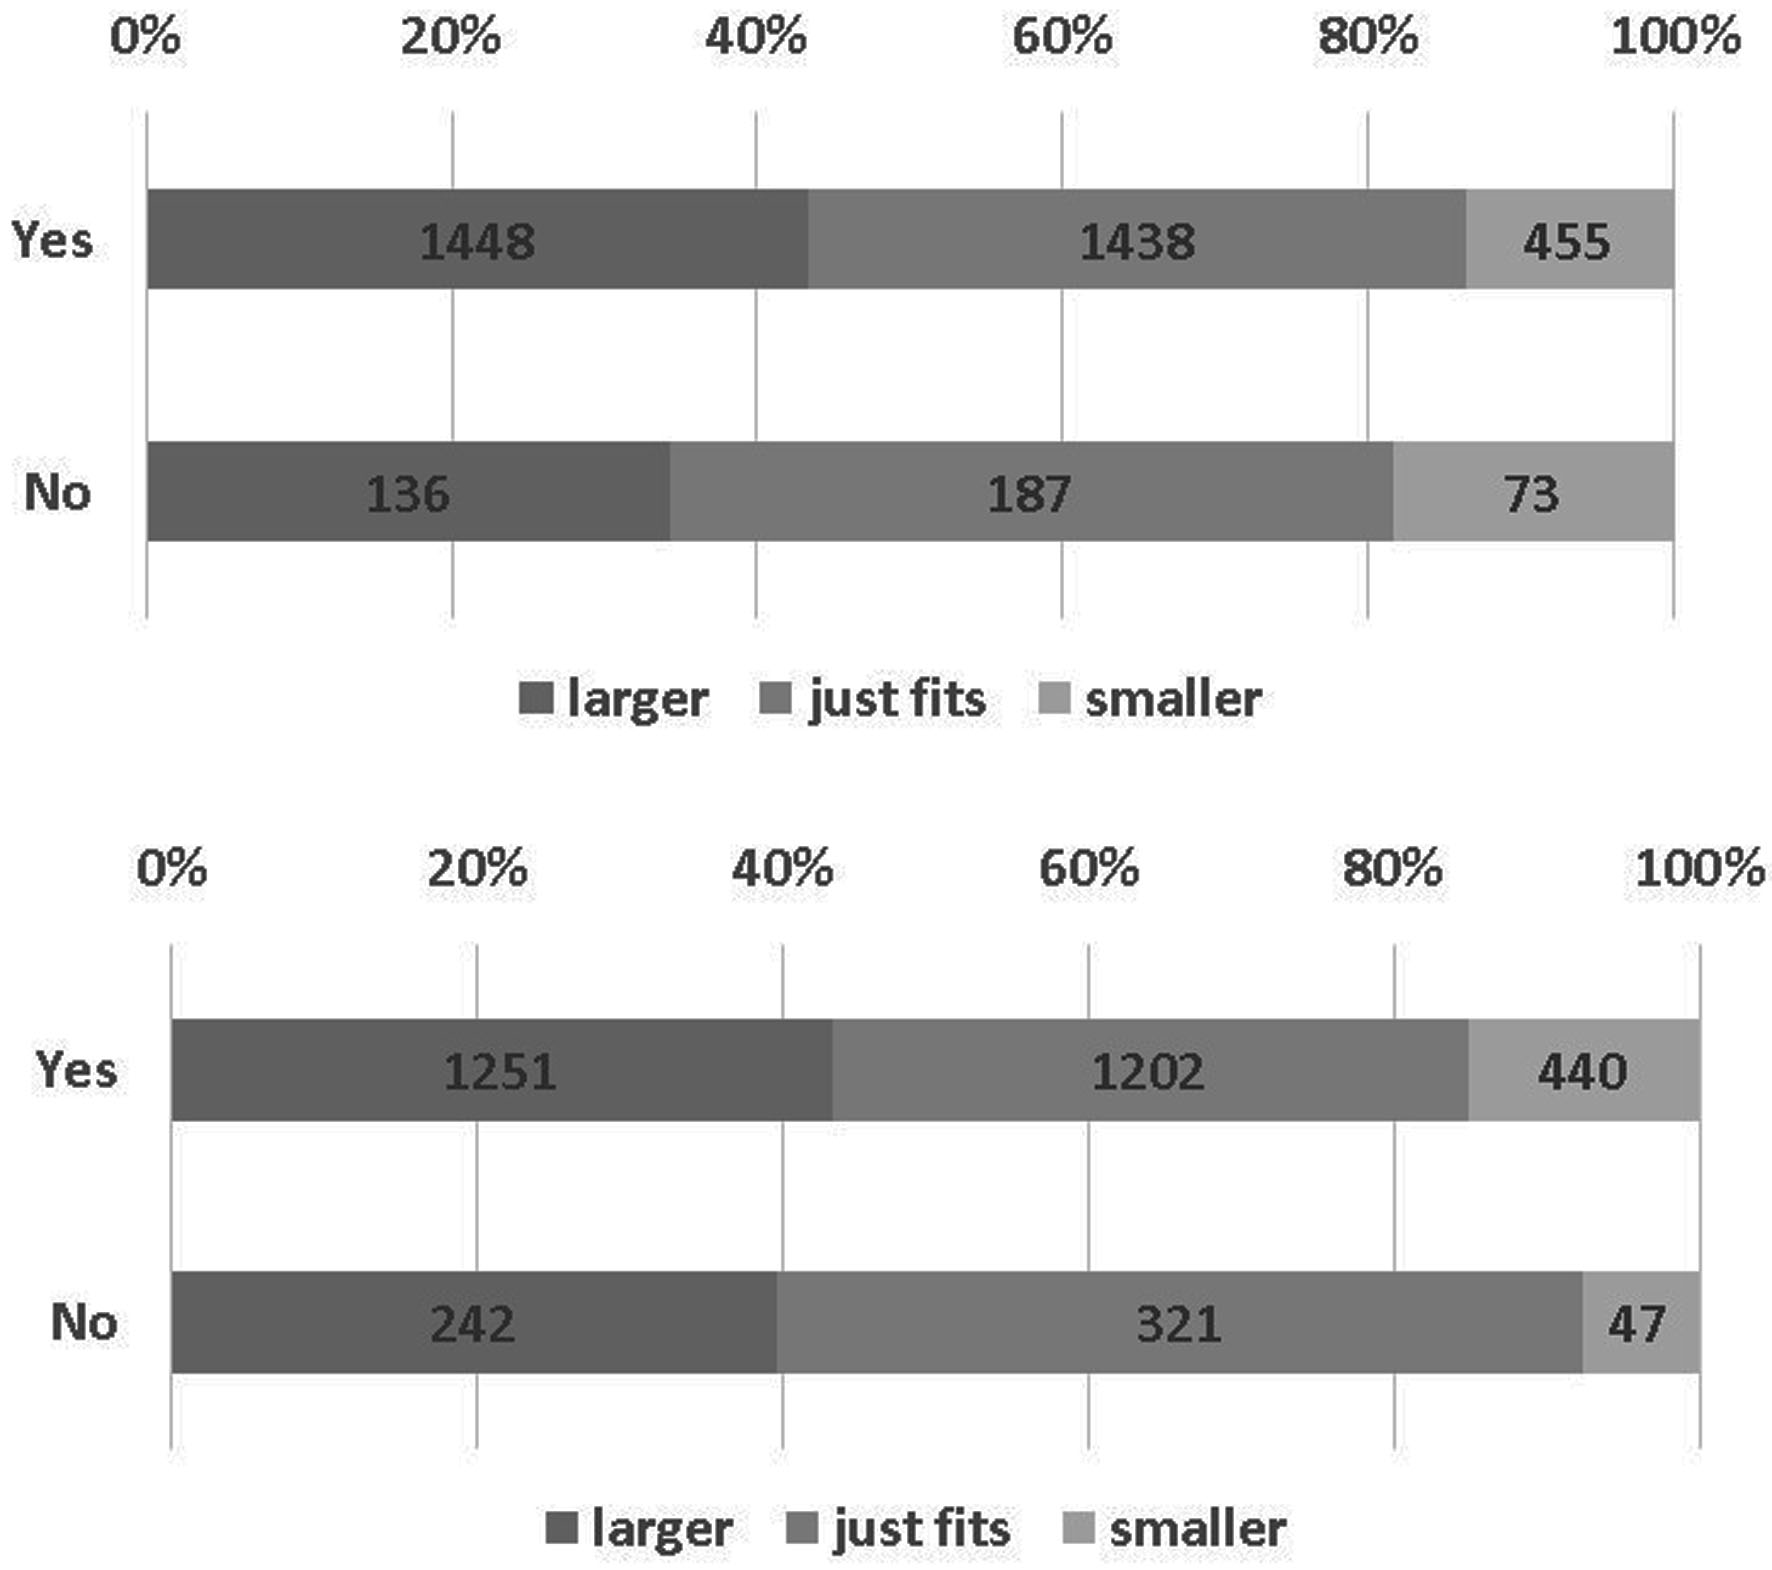
Figure 1. Answers to the questionnaire and the results of YUBI-WAKKA test (Chi-square test). Question 1 (upper): Did you explain your patients how to do the YUBI-WAKKA test? P < 0.001 by Chi-square test. Question 2 (lower): Did your patients do the YUBI-WAKKA test under observation of medical staff? P < 0.001 by Chi-square test. It indicates that the null hypothesis was rejected between the distributions of the two groups.

Tables

Table 1. The Distribution of the Results of the Finger-Ring Test in 2017 and 2018
 
Finger-ring testYearLargerJust fitsSmallerSum
Data are represented as n (%).
Men2017859 (40.3)975 (45.8)295 (13.9)2,129 (100)
2018736 (42.9)735 (42.8)245 (14.3)1,716 (100)
Women20171,237 (37.8)1,492 (45.5)547 (16.7)3,276 (100)
20181,084 (40.5)1,170 (43.7)421 (15.7)2,675 (100)
All20172,096 (38.8)2,467 (45.6)842 (15.6)5,405 (100)
20181,820 (41.4)1,905 (43.4)666 (15.2)4,391 (100)


Table 2. The Intra-Individual Concordance of the Results Between Baseline (2017) and the Second Year (2018)
 
2017Men2018n%Women2018n%Total2018n%
aThe number of concordant individuals between the 2 years. “Larger” means the examinees have larger calves than their own finger-ring. “Smaller” means they have smaller calves than their finger-ring.
Larger562Larger41173.1a808Larger58672.5a1,370Larger99772.8a
Just Fits12522.2Just Fits19724.4Just Fits32223.5
Smaller264.63Smaller253.09Smaller513.72
Just fits605Larger12721.0985Larger25425.81,590Larger38124.0
Just fits40867.4aJust Fits60161.0aJust Fits1,00963.5a
Smaller7011.6Smaller13013.2Smaller20012.6
Smaller181Larger2413.3340Larger3811.2521Larger6211.9
Just Fits6435.4Just Fits12436.5Just Fits18836.1
Smaller9351.4aSmaller17852.4aSmaller27152.0a


Table 3. The Comparison of the Baseline Data Between “Larger” and “Smaller” Groups
 
MenWomen
LargerSmallerP-valueLargerSmallerP-value
Data are presented as means and percentages. Metabolic syndrome (MetS) in Japanese definition is central obesity (85 cm for men and 90 cm for women) with any two of TG ≥ 150 mg/dL; HDL-C < 40 mg/dL; SBP ≥ 130 mm Hg and/or DBP ≥ 85 mm Hg; and fasting glucose ≥ 110 mg/dL. Pre-MetS: central obesity with one positive among others. BH: body height; BW: body weight; BMI: body mass index; SBP: systolic blood pressure; DBP: diastolic blood pressure; FPG: fasting plasma glucose; RBC: red blood cell; Hb: hemoglobin; ALB: albumin; HDL-C: high-density lipoprotein cholesterol; LDL-C: low-density lipoprotein cholesterol; TG: triglyceride; Cr: creatinine; eGFR: estimated glomerular filtration rate; CCr: creatinine clearance; CK: creatinine kinase; AST: asparagine aminotransferase; ALT: alanine transaminase; gGTP: gamma glutamyl transpeptidase; ALP: alkaline phosphatase; AMY: amylase; UA: uric acid; GPT: glutamic pyruvic transaminase; GOT: glutamic oxaloacetic transaminase.
N8592951,237547
Age (years)70.170.50.03670.170.20.289
BH (cm)165.8166.70.022151.9152.80.002
BW (kg)68.658.00.00055.446.00.000
BMI (kg/m2)24.920.80.00024.019.70.000
Waist circumference (cm)89.179.20.00085.475.10.000
SBP (mm Hg)130.7130.50.877129.3126.80.003
DBP (mm Hg)76.075.40.35673.572.00.004
No MetS (%)36.082.70.00073.396.30.000
Pre-MetS (%)22.97.18.71.5
MetS (%)41.110.217.92.2
HbA1c (%)5.95.80.0095.85.60.000
FPG (mg/dL)104.8101.70.090100.694.50.000
RBC (× 104/mm3)469.8457.50.000442.6437.20.004
Hb (g/dL)14.714.40.00013.413.30.262
ALB (mg/dL)4.34.20.0004.34.30.854
HDL-C (mg/dL)55.762.50.00065.772.30.000
LDL-C (mg/dL)116.8111.10.002125.9126.50.650
TG (mg/dL)135.6112.50.000112.499.20.000
Cr (mg/dL)0.90.90.6650.70.60.031
eGFR (mL/min/1.73 m2)67.972.00.00070.572.80.002
CCr (mL/min)77.668.40.00072.761.90.000
CK (mg/dL)146.5123.50.000110.4106.40.302
GOT/AST (IU/L)26.125.50.39125.824.00.331
GPT/ALT (IU/L)24.719.50.00021.617.80.000
gGTP (IU/L)45.051.80.00028.826.00.033
ALP (mg/dL)208.3230.10.000228.7221.20.026
AMY (mg/dL)85.194.00.00081.991.30.000
UA (mg/dL)6.05.80.0014.94.60.000


Table 4. Multivariate Logistic Regression Analysis of the Related Factors to the Change of “Larger” to “Smaller” Calves Than Finger-Rings From the Baseline to Second Year (Forced Entry Method)
 
Men (R2 = 0.548, n = 289)
Odds ratio (95% CI)
UA in 20170.219 (0.066 - 0.730)
Women (R2 = 0.478, n = 433)
Odds ratio (95% CI)
Only statistically significant factors were shown in the table. All variables of age, BMI, WC, SBP, DBP, no-, pre-, and MetS, HbA1c, FPG, RBC, Hb, ALB, HDL-C, LDL-C, TG, Cr, eGFR, CCr, CK, AST/GOT, ALT/GPT, gGTP, ALP, AMY, and UA are entered simultaneously. We also entered the change of the values in 2 years: dBMI, dHbA1c, dHb, dALB, dHDL-C, dLDL-C, dTG, dCr, deGFR, dCK, dAST/GOT, dALT/GPT, dgGTP, dALP, dAMY, and dUA. d (delta) means the subtraction from the value of 2018’s to 2017’s. ALB: albumin; HDL-C: high-density lipoprotein cholesterol; ALT: alanine transaminase; eGFR: estimated glomerular filtration rate; CCr: creatinine clearance; UA: uric acid; BH: body height; BW: body weight; BMI: body mass index.
dHb (2018-17)19.488 (1.298 - 292.692)
dGPT/ALT (2018-17)1.484 (1.069 - 2.059)
BMI in 20170.353 (0.177 - 0.702)
dBMI (2018-17)0.244 (0.065 - 0.925)