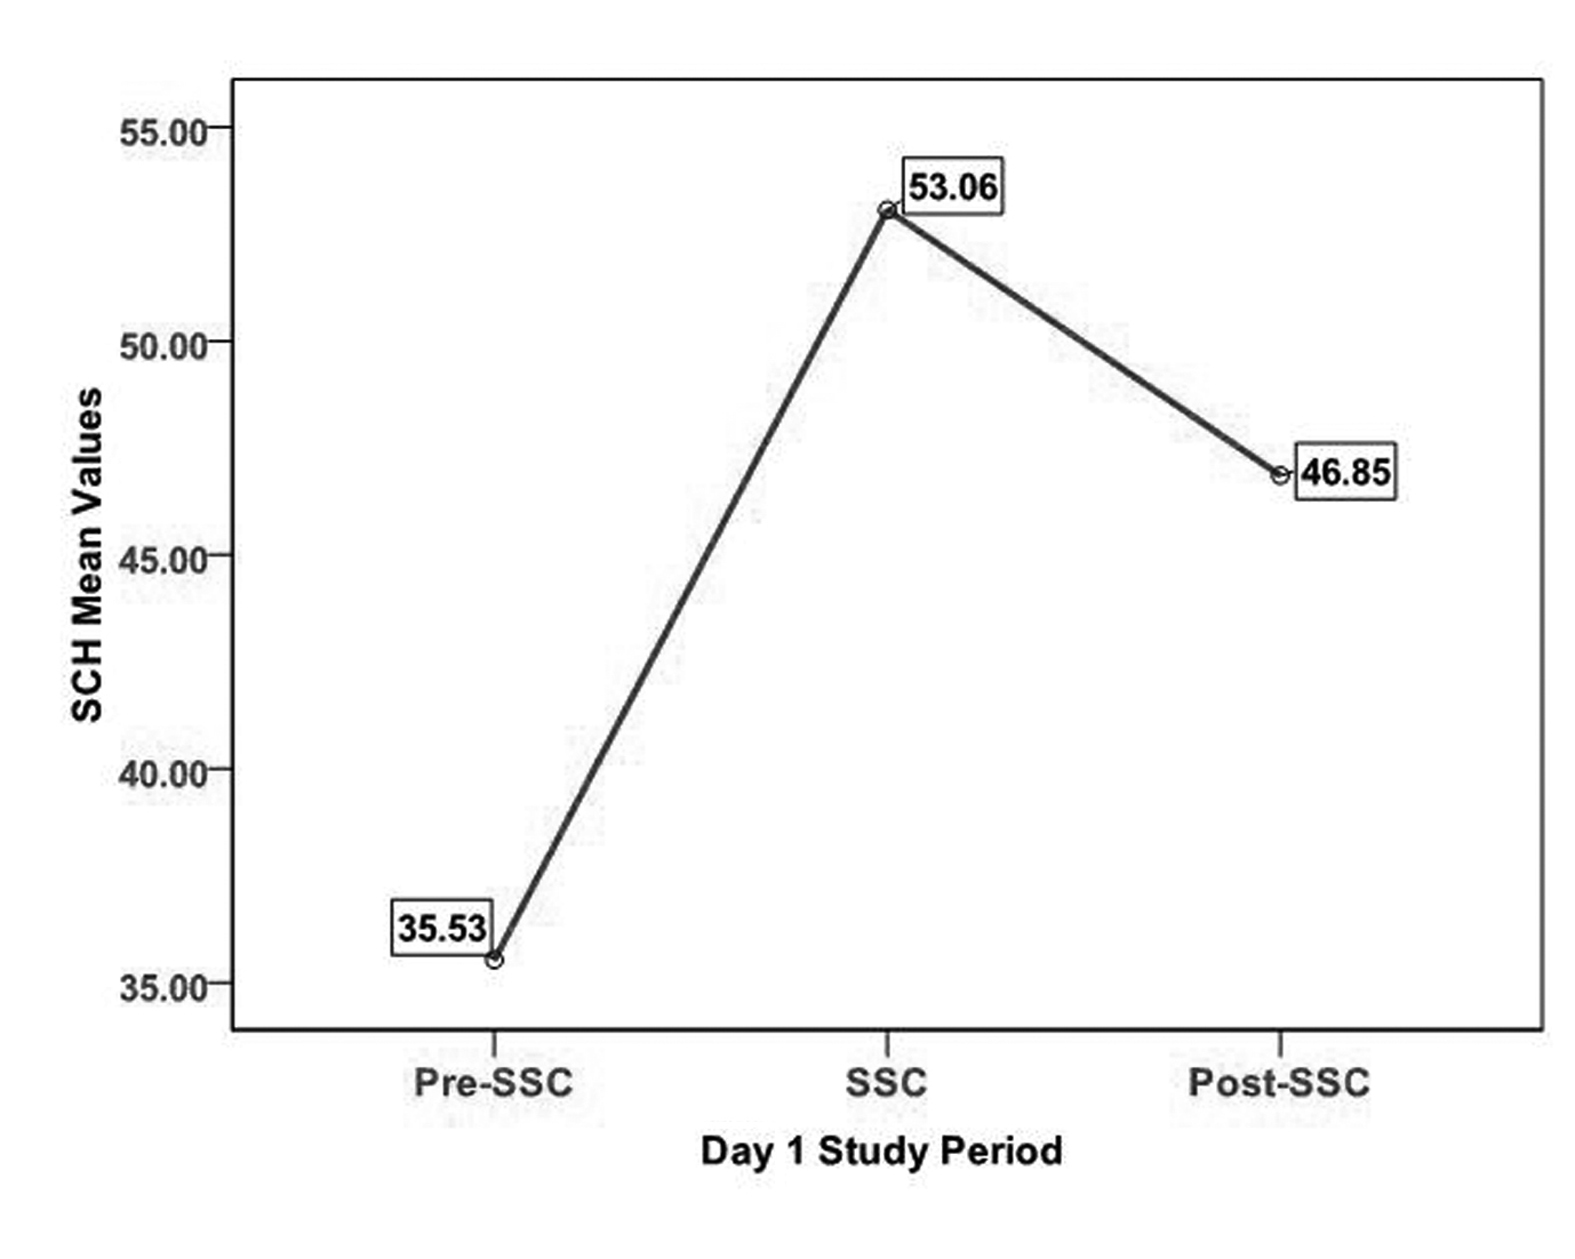
Figure 1.. SCH on Day 1 across study periods.
| Journal of Clinical Medicine Research, ISSN 1918-3003 print, 1918-3011 online, Open Access |
| Article copyright, the authors; Journal compilation copyright, J Clin Med Res and Elmer Press Inc |
| Journal website http://www.jocmr.org |
Original Article
Volume 3, Number 1, February 2011, pages 36-46
Effect of Skin-To-Skin Contact on Preterm Infant Skin Barrier Function and Hospital-Acquired Infection
Figures
Tables
| Characteristics | Mean ± SD | N |
|---|---|---|
| Mothers Age | 24.6 ± 4.03 | |
| Infants GA | 28.6 ± 1.26 | |
| Infants Age at Entry | 15.2 ± 7.19 | |
| Minutes of KC/day (Day 2 - 4) | 77.5 ± 12.5 | |
| Infants Birth Weight | 1228.4 ± 167.6 | |
| Infants Weight at day one | 1183.7 ± 331.8 | |
| Infants Weight at day five | 1348 ± 173.9 | |
| Male/Female | 8/2 | |
| AA/Caucasian | 9/1 | |
| Vaginal/Cesarean Delivery | 4/6 | |
| Breastfeeding/No Breastfeeding | 3/7 |
| Day 1 | Day 5 | |||||
|---|---|---|---|---|---|---|
| Pre-SSC | SSC | Post-SSC | Pre-SSC | SSC | Post-SSC | |
| * p < 0.001 across all periods during both days | ||||||
| Ambient Humidity | 44.9 ± 12.2 | 27.3 ± 7.1 | 38.6 ± 12.7 | 39.1 ± 11.7 | 28.8 ± 7.3 | 36.1 ± 9.0 |
| Ambient Temperature | 30.7 ± 0.7 | 27.2 ± 0.7 | 30.3 ± 0.9 | 30.2 ± 1.9 | 27.1 ± 1.3 | 29.9 ± 2.1 |
| Infant Skin Temperature | 36.7 ± 0.3 | 36.8 ± 0.2 | 36.7 ± 0.3 | 36.7 ± 0.4 | 37.0 ± 0.2 | 36.6 ± 0.2 |
| Pre-SSC | SSC | Post-SSC | |
|---|---|---|---|
| Mean ± SD | Mean ± SD | Mean ± SD | |
| Day one | 35.53 ± 14.69 | 53.06 ± 15.10 | 46.85 ± 12.67 |
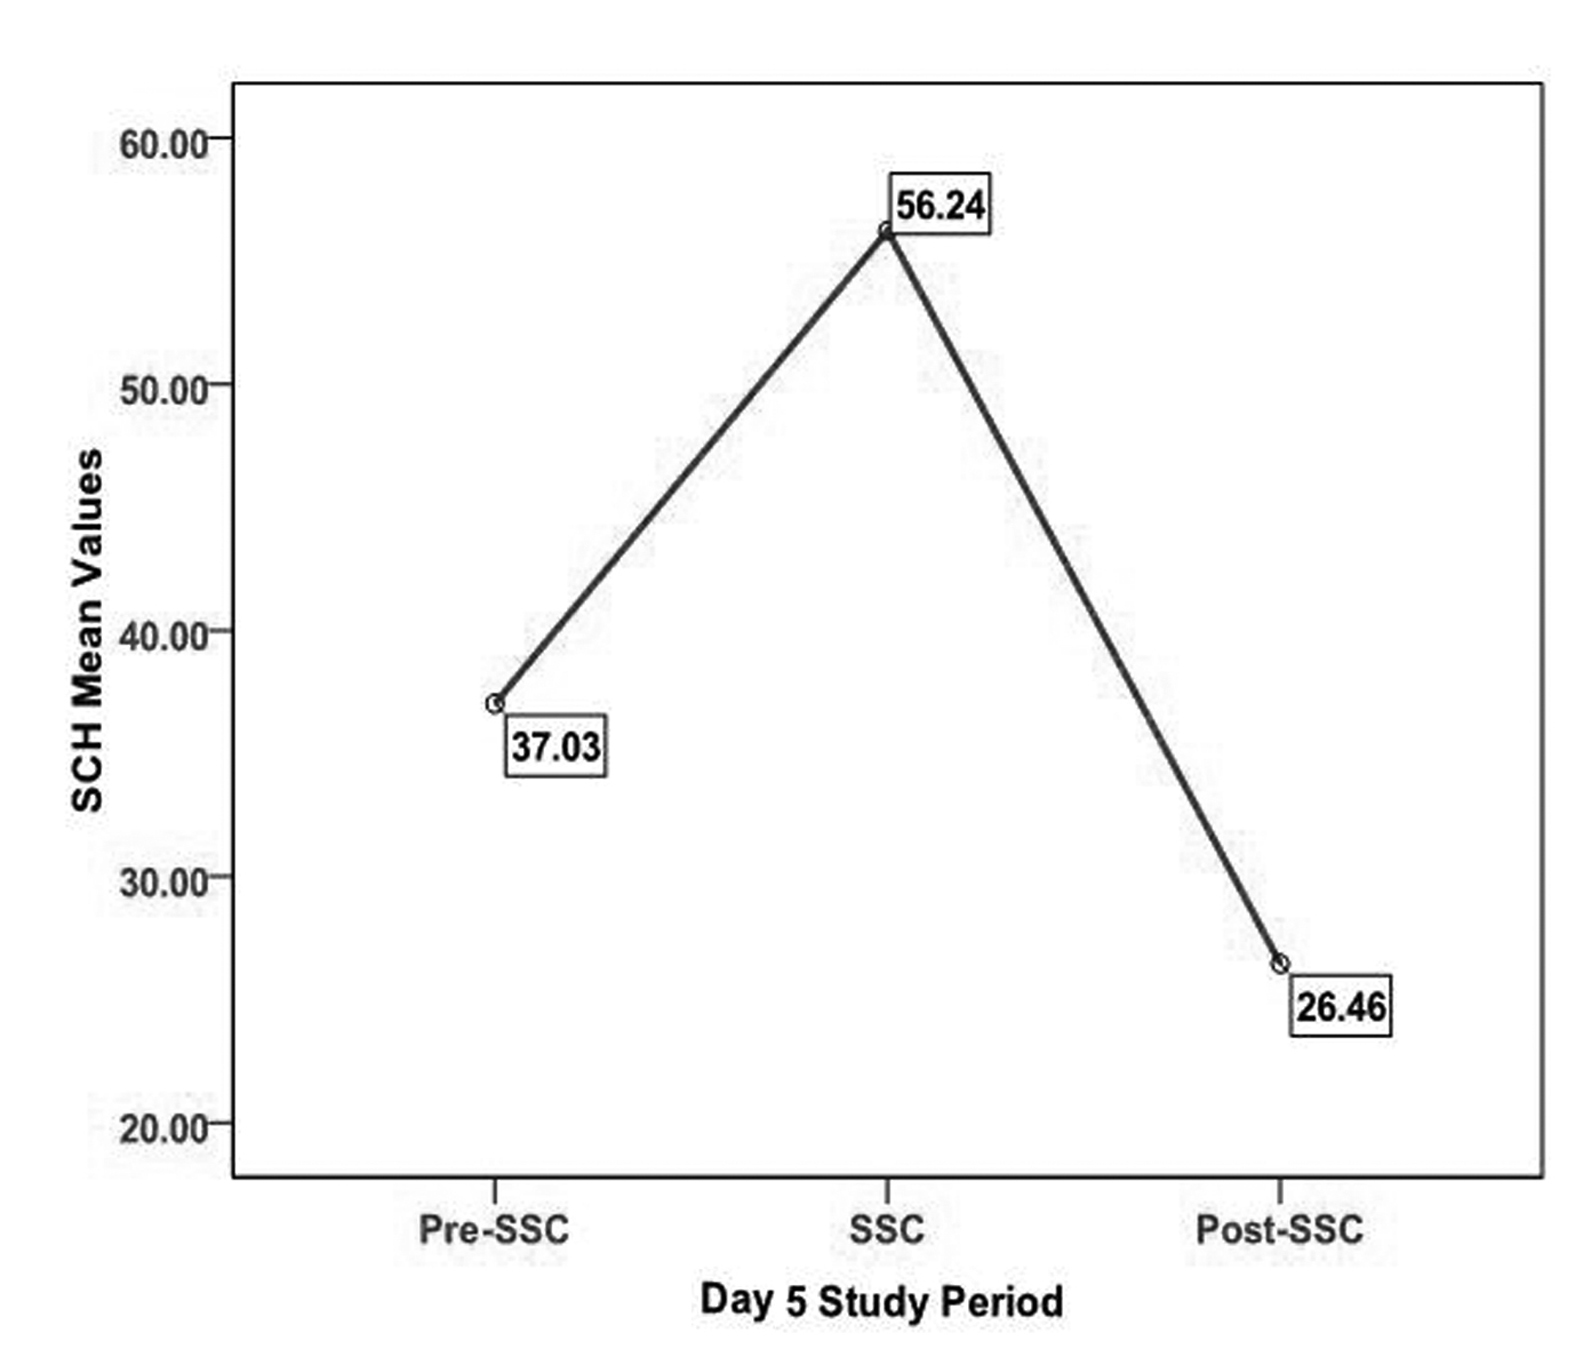
| Day five | 37.02 ± 7.56 | 56.24 ± 17.84 | 51.22 ± 13.86 |
| Pre-SSC Assessment 1 | Pre-SSC Assessment 2 | Pre-SSC Assessment 3 | ||
|---|---|---|---|---|
| LS Mean = 38.42 | LS Mean = 36.55 | LS Mean = 37.26 | ||
| SSC Assessment 1 | LS Mean = 49.56 | Ns | Ns | Ns |
| SSC Assessment 2 | LS Mean = 54.75 | P < 0.05 | P < 0.01 | P < 0.01 |
| SSC Assessment 3 | LS Mean = 57.30 | P < 0.01 | P < 0.001 | P < 0.001 |
| Post-SSC Assessment 1 | LS Mean = 53.82 | P < 0.05 | P < 0.01 | P < 0.01 |
| Post-SSC Assessment 2 | LS Mean = 49.52 | Ns | Ns | Ns |
| Post-SSC Assessment 3 | LS Mean = 42.72 | Ns | Ns | Ns |
| Pre-SSC Mean ± SD | SSC Mean ± SD | Post-SSC Mean ± SD | |
|---|---|---|---|
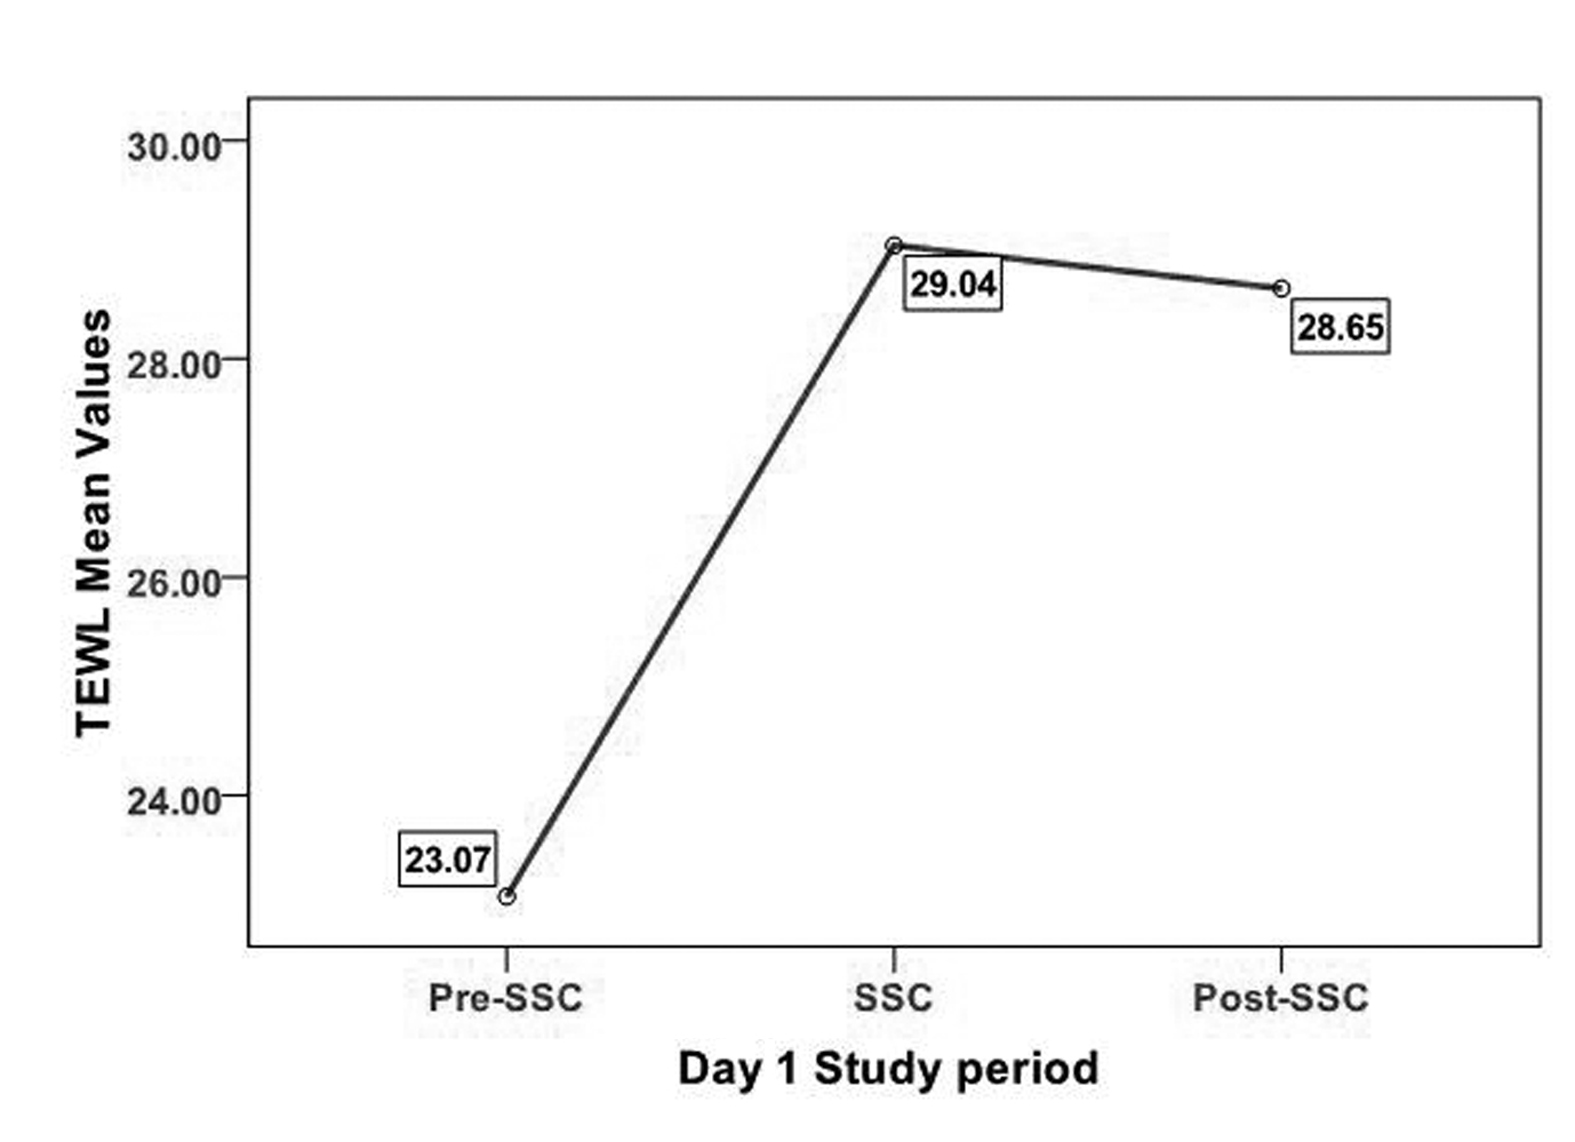
| Day one | 23.07 ± 6.5 | 29.04 ± 10.2 | 28.64 ± 10.3 |
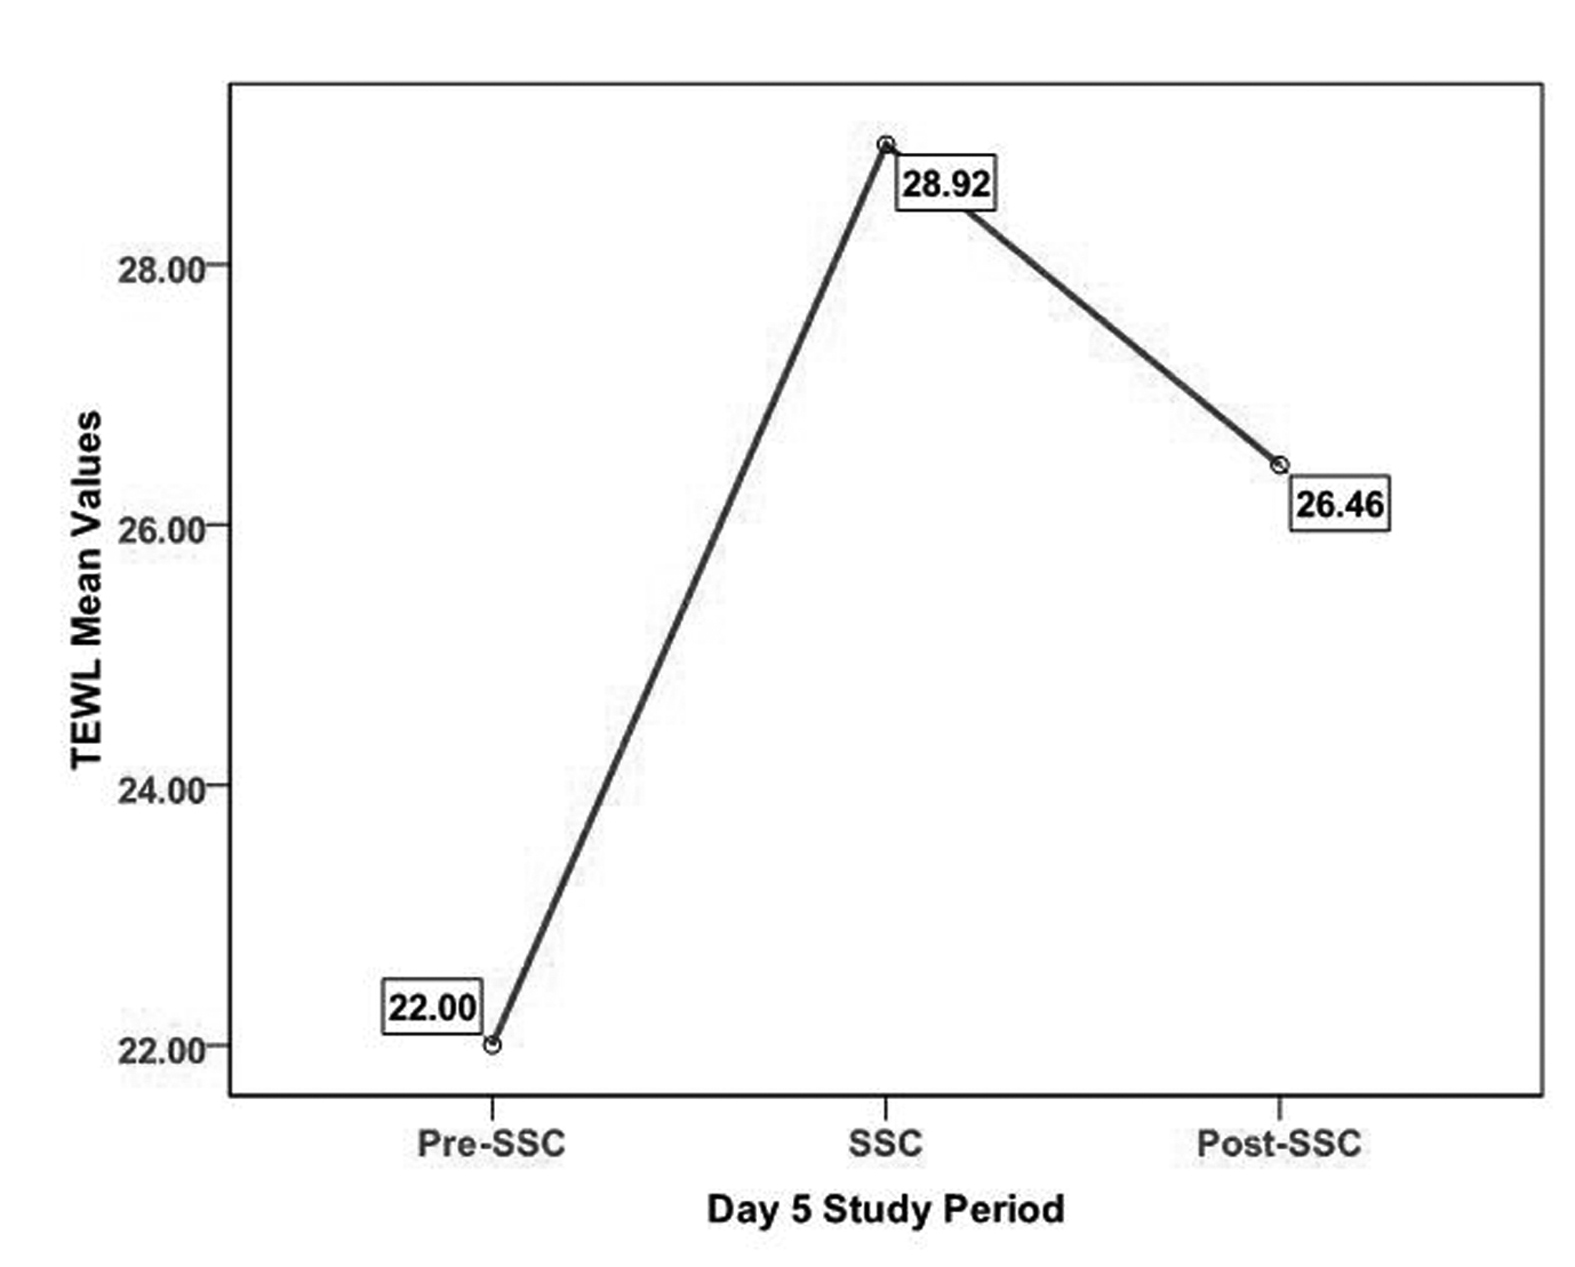
| Day five | 22.00 ± 4.73 | 28.92 ± 8.23 | 26.46 ± 6.51 |