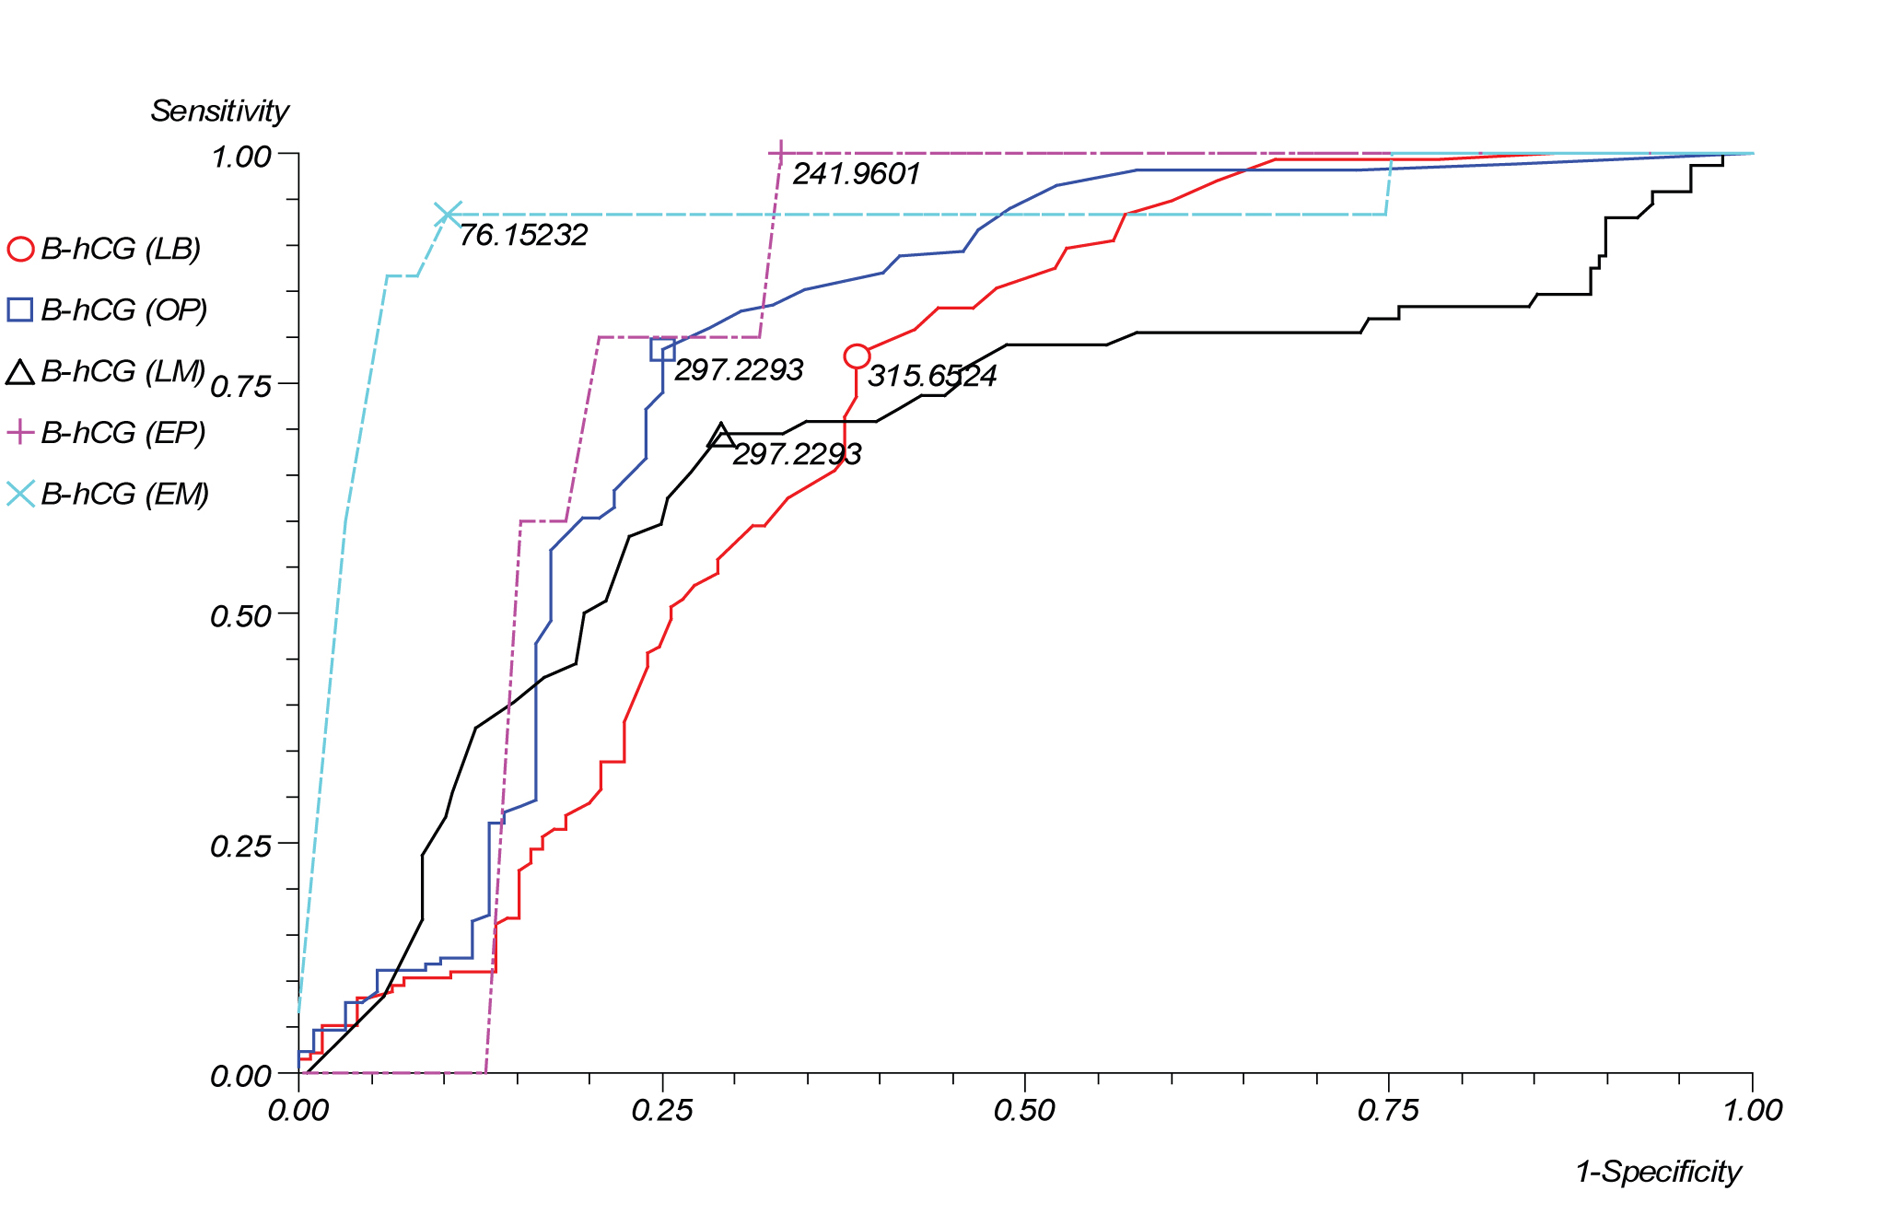
Figure 1.. β-hCG cut-off levels on receiver operating characteristic (ROC) curve that best discriminated between pregnancy outcomes.
| Journal of Clinical Medicine Research, ISSN 1918-3003 print, 1918-3011 online, Open Access |
| Article copyright, the authors; Journal compilation copyright, J Clin Med Res and Elmer Press Inc |
| Journal website http://www.jocmr.org |
Original Article
Volume 3, Number 1, February 2011, pages 30-35
Early Maternal Serum β-human Chorionic Gonadotropin Measurements After ICSI in the Prediction of Long-term Pregnancy Outcomes: A Retrospective Cohort Analysis
Figure
Tables
| Live-birth | Ongoing Pregnancy | Late Miscarriage | Ectopic Pregnancy | Early Miscarriage | |
|---|---|---|---|---|---|
| Age | 29.54 ± 5.05 | 29.61 ± 4.91 | 29.69 ± 5.29 | 30.4 ± 1.67 | 30.8 ± 4.83 |
| Infertility duration | 7.9 ± 3.97 | 8.34 ± 4.21 | 7.85 ± 4.43 | 10.4 ± 3.13 | 8.2 ± 5.23 |
| No. of ampoules | 51.59 ± 256.71 | 46.4 ± 230.91 | 27.87 ± 7.62 | 23 ± 7.42 | 29.71 ± 12.27 |
| Days of stimulation | 9.78 ± 1.86 | 9.78 ± 1.8 | 10.15 ± 2.92 | 9.2 ± 1.92 | 9.87 ± 1.73 |
| No. of oocytes retrieved | 12.48 ± 7.52 | 12.13 ± 7.33 | 13.25 ± 9.89 | 12 ± 6.44 | 11.8 ± 7.32 |
| No. of MII | 10.04 ± 6.47 | 9.76 ± 6.28 | 10.79 ± 8 | 10.6 ± 6.23 | 10.33 ± 6.77 |
| Injected | 10.12 ± 6.41 | 9.85 ± 6.22 | 10.71 ± 7.22 | 10.6 ± 6.23 | 10.33 ± 6.77 |
| Fertilized | 7.04 ± 4.51 | 6.78 ± 4.45 | 7.03 ± 5.48 | 5.4 ± 4.72 | 7.73 ± 5.57 |
| Good embryo G1 | 4.15 ± 3.4 | 4.01 ± 3.23 | 3.94 ± 3.75 | 3.6 ± 2.88 | 5.2 ± 5.73 |
| Fair embryo G2 | 2.43 ± 2.19 | 2.37 ± 2.07 | 2.49 ± 2.45 | 2.4 ± 2.61 | 2.33 ± 1.68 |
| Poor embryo G3, G4 | 1.22 ± 1.76 | 1.14 ± 1.66 | 1.29 ± 1.67 | 0 ± 0 | 0.6 ± 1.35 |
| No. of ET | 3.75 ± 0.81 | 3.74 ± 0.83 | 3.76 ± 0.83 | 3.2 ± 1.3 | 3.4 ± 1.06 |
| Live-birth* | Ongoing Pregnancy* | Late Miscarriage | Ectopic Pregnancy* | Early Miscarriage* | ||||||
|---|---|---|---|---|---|---|---|---|---|---|
| Present | Absent | Present | Absent | Present | Absent | Present | Absent | Present | Absent | |
| *Statistically significant | ||||||||||
| Number of pregnancies | 136 | 125 | 169 | 92 | 72 | 189 | 5 | 256 | 15 | 246 |
| Mean SD | 1070.02 ± 1505.79 | 686.6 ± 1269.69 | 1081.14 ± 1505.42 | 528.64 ± 1132.24 | 650.45 ± 1249.53 | 976.27 ± 1457.17 | 113.89 ± 65.42 | 901.48 ± 1417.7 | 82.21 ± 249.33 | 935.43 ± 1434.87 |
| Significance | P = 0.0277 | P < 0.0001 | P = 0.0948 | P = 0.0162 | P < 0.0001 | |||||
| Cut-off | Area Under ROC | Sensitivity | Specificity | |
|---|---|---|---|---|
| Live-birth | 315.65 | 58.14% | 77.94% | 61.60% |
| Ongoing pregnancy | 297.23 | 62.92% | 78.70% | 75.00% |
| Late miscarriage | 297.23 | 67.72% | 69.44% | 70.90% |
| Ectopic pregnancy | 241.96 | 81.17% | 100.00% | 66.80% |
| Early miscarriage | 76.15 | 91.19% | 93.33% | 89.84% |