Figures
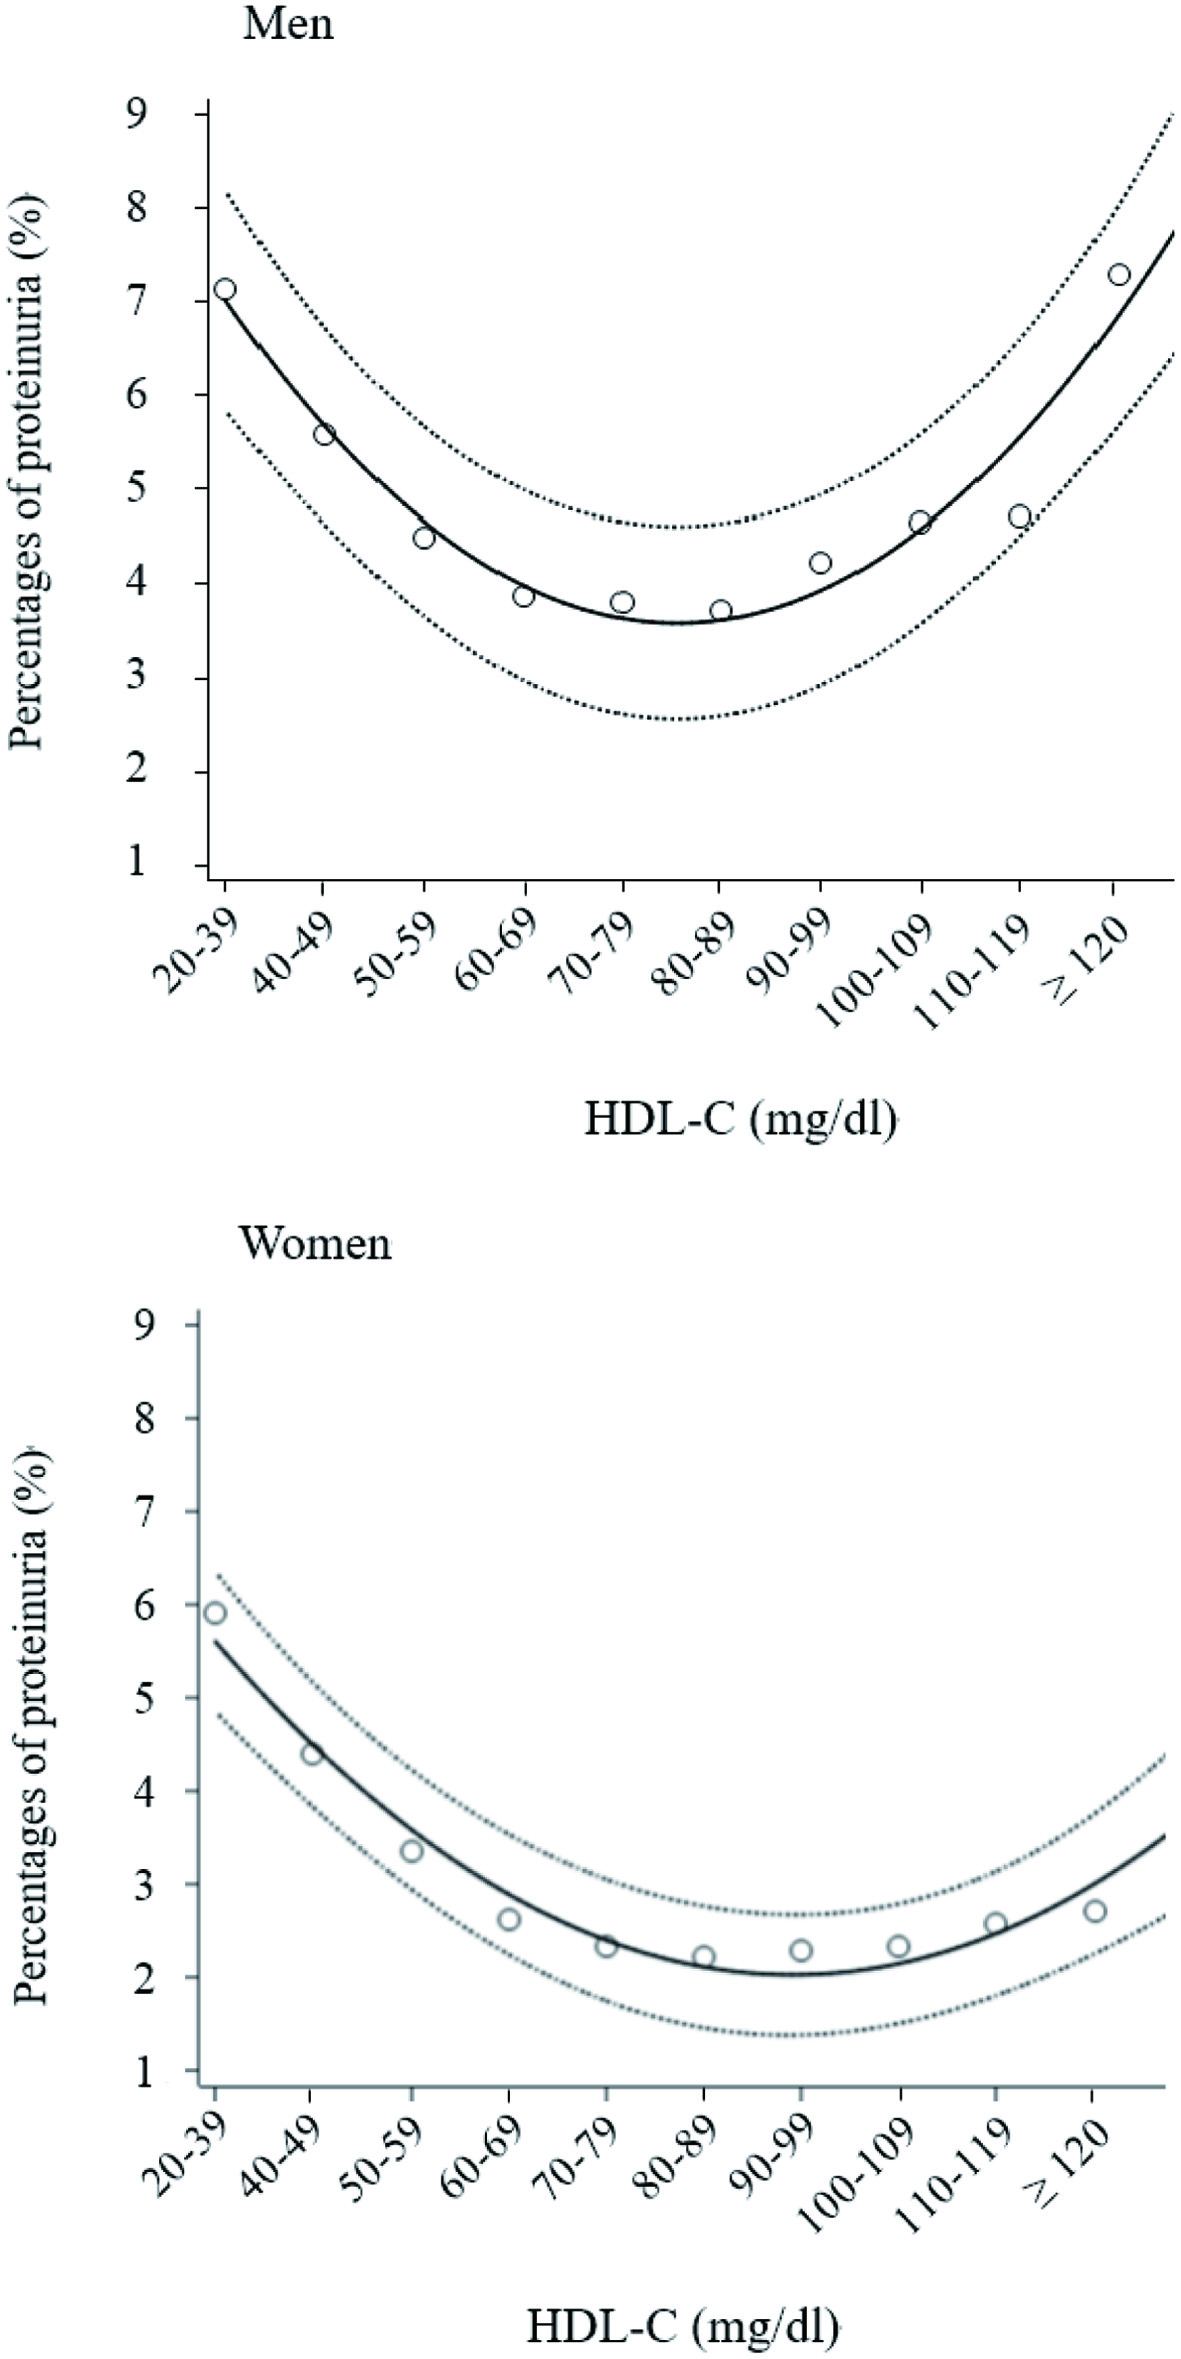
Figure 1. Percentages of proteinuria according to 10 high-density lipoprotein cholesterol (HDL-C) categories. Open circles indicate mean percentage of proteinuria in each HDL-C category, with proteinuria +1 and no proteinuria 0. Solid and dashed lines express quadratic regression curves and 95% confidence intervals, respectively.
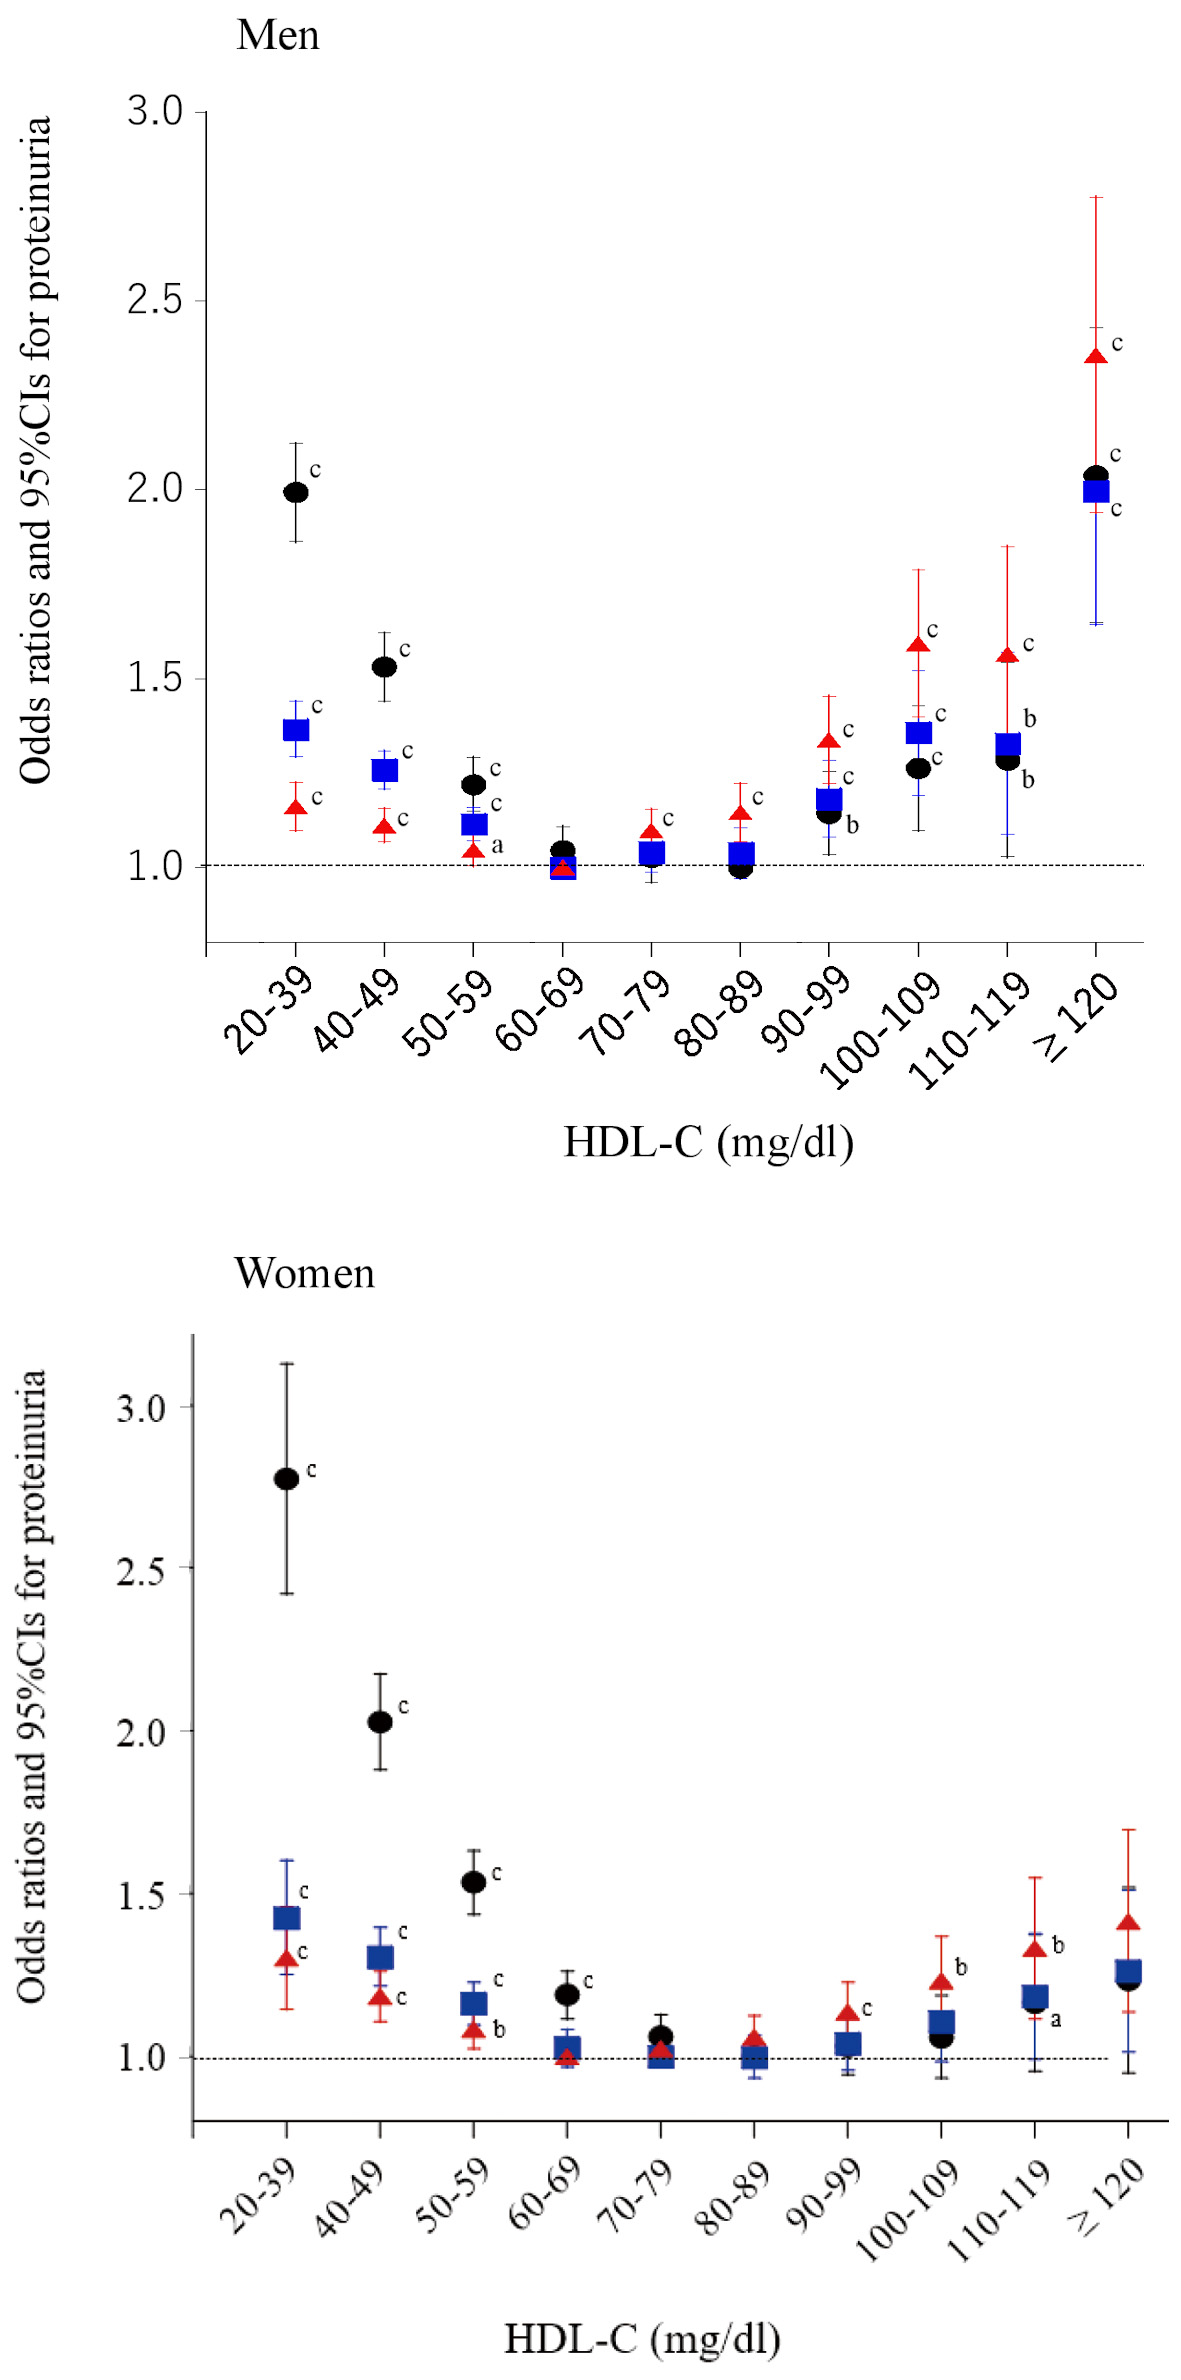
Figure 2. Odds ratios and 95% confidence intervals (CIs) for each category of high-density lipoprotein cholesterol (HDL-C) for proteinuria. Black circles: unadjusted; blue squares: adjusted for age, smoking, pharmacotherapy (hypertension, diabetes, and dyslipidemia), regular exercise, and serum triglyceride level; red triangles: further adjusted for body mass index. aP < 0.05, bP < 0.01, cP < 0.001.
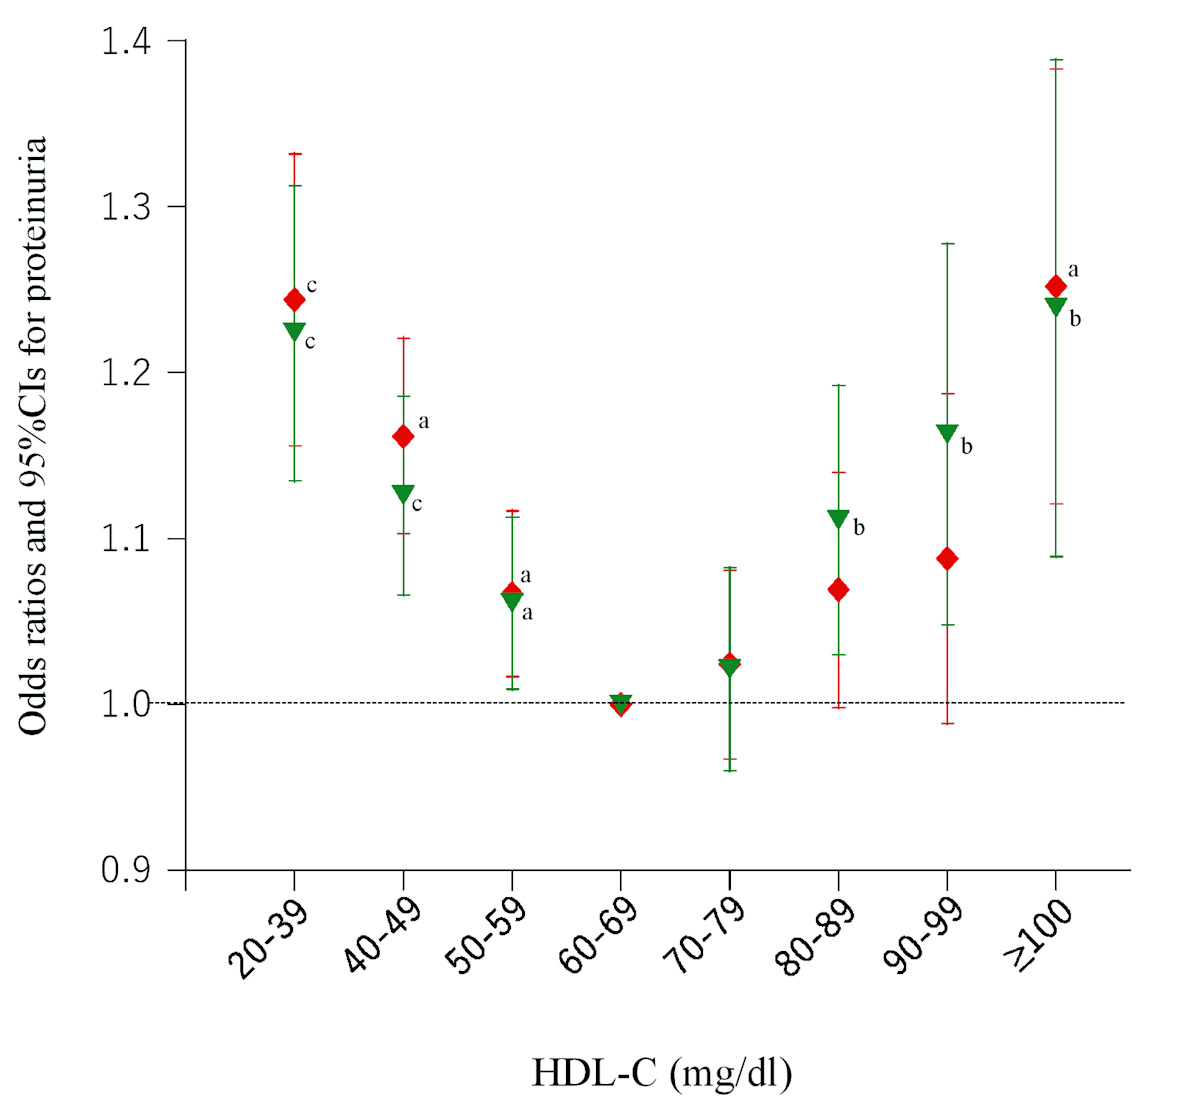
Figure 3. Odds ratios and 95% confidence intervals (CIs) for each category of high-density lipoprotein cholesterol (HDL-C) for proteinuria in participants without regular alcohol consumption. Red diamonds: participants who consumed low amounts of alcohol (< 23 g ethanol per session); green inverted triangles: participants who rarely or never drank alcohol. All odds ratios were adjusted for age, sex, smoking, pharmacotherapy (hypertension, diabetes, and dyslipidemia), regular exercise, serum triglyceride level, and body mass index. aP < 0.05, bP < 0.01, cP < 0.001.
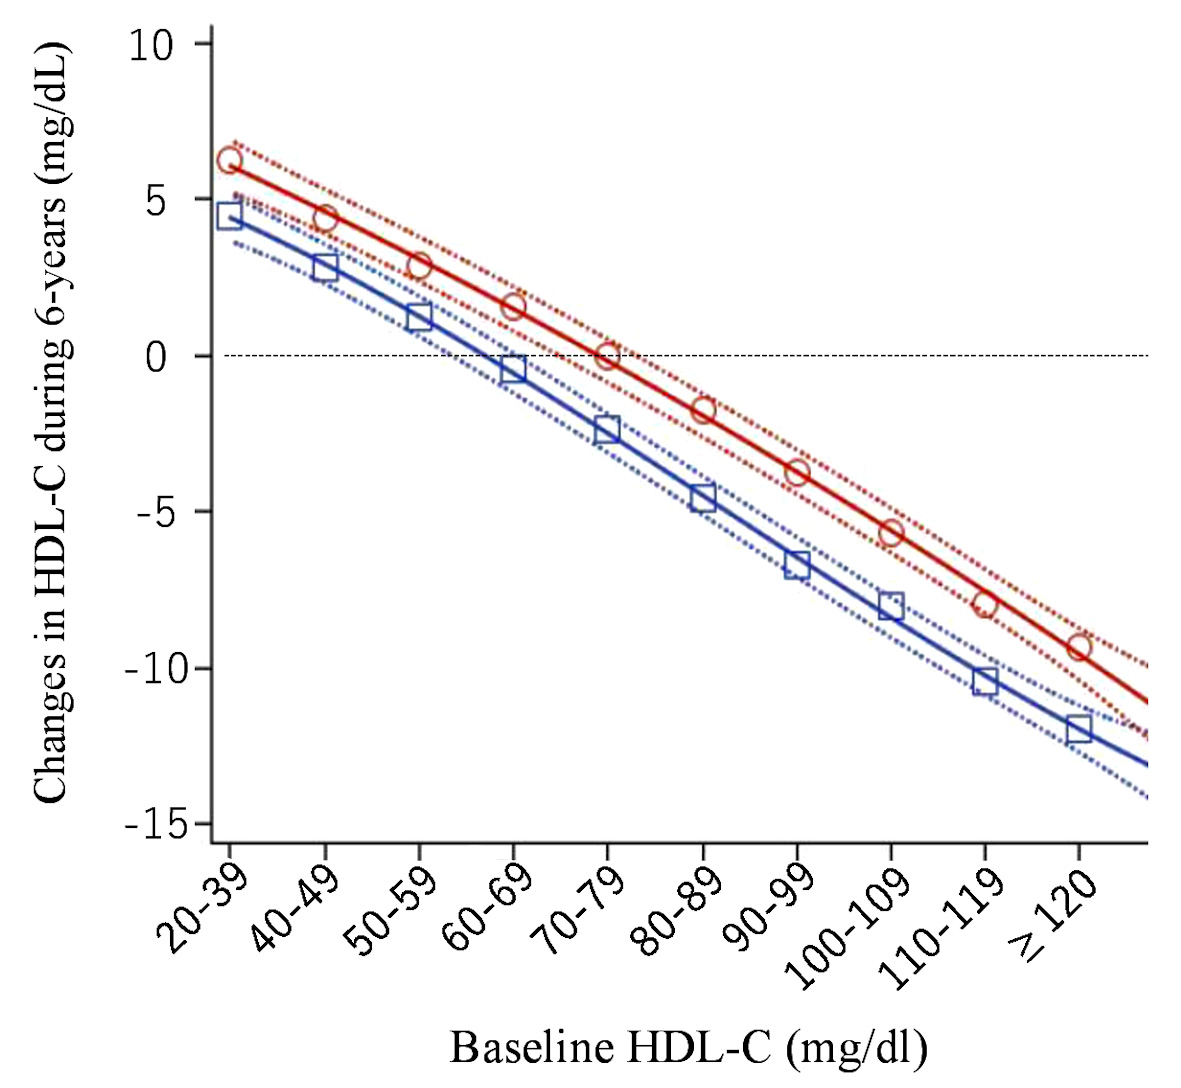
Figure 4. Changes in high-density lipoprotein cholesterol (HDL-C) over 6 years (mg/dL). Open red circles (women) and open blue squares (men) express mean change in HDL-C over 6 years in each baseline HDL-C category. Solid and dashed lines express quadratic regression curves and 95% confidence intervals for the averages, respectively.
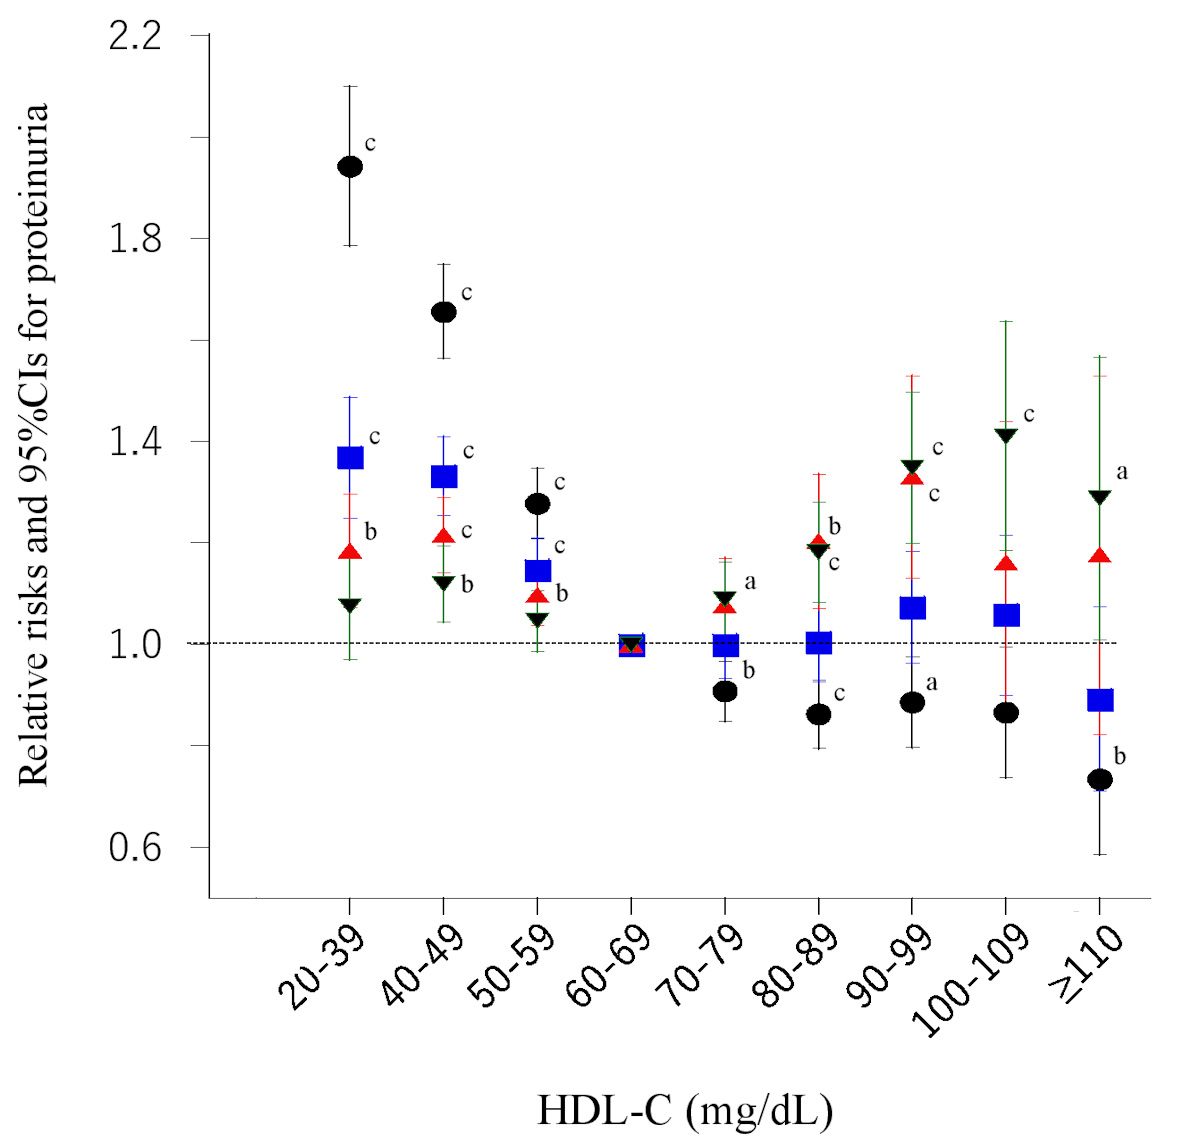
Figure 5. Risk ratios and 95% confidence intervals (CIs) for each category of baseline high-density lipoprotein cholesterol (HDL-C) for proteinuria. Black circles: unadjusted; blue squares: adjusted for age, smoking, pharmacotherapy (hypertension, diabetes, and dyslipidemia), regular exercise, and serum triglyceride level; red triangles: further adjusted for body mass index; green inverted triangles: further plus adjusted for HDL-C after 6 years. aP < 0.05, bP < 0.01, cP < 0.001.
Tables
Table 1. Clinical Characteristics of Participants
| HDL-C categories (mg/dL) | 30 - 39 | 40 - 49 | 50 - 59 | 60 - 69 | 70 - 79 | 80 - 89 | 90 - 99 | 100 - 109 | 110 - 119 | ≥ 120 |
|---|
| Data are presented as mean ± standard deviation, median (interquartile range) for triglycerides, or n (%). aAvailable n = 1,179,643. bAvailable n = 938,010. cDrinkers who consume 69 g ethanol or more per session. dRegular exercise defined as ≥ 30 min at least twice a week. All continuous and categorical variables showed significant differences with analysis of variance or χ2 test, with P < 0.0001 across the 10 categories of HDL-C concentration. S-age: substituted age; BMI: body mass index; SBP: systolic blood pressure; HDL-C: high-density lipoprotein cholesterol; CVD: cardiovascular disease; TG: triglycerides; LDL-C: high-density lipoprotein cholesterol; Hb1Ac: glycated hemoglobin. |
| N (% of total) | 50,786 (4.3) | 193,046 (16.2) | 284,677 (23.9) | 265,804 (22.3) | 192,420 (16.2) | 112,276 (9.4) | 54,760 (4.6) | 23,073 (1.9) | 8,968 (0.8) | 5,599 (0.5) |
| S-age | 52.7 ± 10.1 | 52.6 ± 9.9 | 53.1 ± 9.9 | 53.3 ± 9.9 | 53.2 ± 9.8 | 53.2 ± 9.7 | 53.2 ± 9.5 | 53.4 ± 9.3 | 53.5 ± 9.1 | 53.8 ± 8.9 |
| Women, n (%) | 5,743 (11.3) | 37,022 (19.2) | 90,628 (31.8) | 123,705 (46.5) | 111,787 (58.1) | 73,387 (65.4) | 37,530 (68.5) | 16,032 (69.5) | 6,152 (68.6) | 3,568 (63.7) |
| BMI (kg/m2) | 25.3 ± 3.4 | 24.7 ± 3.3 | 23.8 ± 3.2 | 22.8 ± 3.1 | 21.9 ± 2.9 | 21.3 ± 2.7 | 20.9 ± 2.6 | 20.6 ± 2.5 | 20.4 ± 2.5 | 20.5 ± 2.6 |
| SBP (mm Hg) | 127 ± 16.8 | 127 ± 17.0 | 126 ± 17.2 | 125 ± 17.6 | 123 ± 17.8 | 122 ± 17.9 | 122 ± 18.0 | 123 ± 17.9 | 124 ± 18.4 | 126 ± 18.3 |
| TG (mg/dL) | 191 (134 - 279) | 145 (104 - 205) | 112 (82 - 155) | 90 (67 - 124) | 77 (58 - 104) | 69 (53 - 92) | 65 (50 - 85) | 61 (48 - 81) | 61 (48 - 79) | 60 (47 - 80) |
| LDL-C (mg/dL)a | 122 ± 32.5 | 131 ± 31.0 | 132 ± 31.2 | 127 ± 31.1 | 123 ± 30.4 | 119 ± 29.9 | 116 ± 29.5 | 11 3± 30.0 | 109 ± 30.5 | 102 ± 32.1 |
| HDL-C (mg/dL) | 35.9 ± 3.0 | 45.1 ± 2.8 | 54.6 ± 2.8 | 64.3 ± 2.9 | 74.1 ± 2.8 | 84.0 ± 2.8 | 93.8 ± 2.8 | 104 ± 2.8 | 114 ± 2.8 | 131 ± 14.3 |
| HbA1c (%)b | 5.8 ± 0.9 | 5.7 ± 0.8 | 5.6 ± 0.7 | 5.5 ± 0.6 | 5.5 ± 0.6 | 5.5 ± 0.5 | 5.5 ± 0.5 | 5.4 ± 0.5 | 5.4 ± 0.6 | 5.5 ± 0.6 |
| Proteinuria, n (%) | 3,553 (7.0) | 10,324 (5.4) | 11,759 (4.1) | 8,742 (3.3) | 5,691 (3.0) | 3,069 (2.7) | 1,583 (2.9) | 702 (3.0) | 291 (3.2) | 245 (4.4) |
| Pharmacotherapy | | | | | | | | | | |
| Hypertension, n (%) | 11,380 (22.4) | 40,148 (20.8) | 53,410 (18.8) | 44,209 (16.6) | 27,191 (14.1) | 13,983 (12.5) | 6,404 (11.7) | 2,575 (11.2) | 1,047 (11.7) | 774 (13.8) |
| Diabetes, n (%) | 3,262 (6.4) | 9,780 (5.1) | 11,391 (4.0) | 8,153 (3.1) | 4,545 (2.4) | 2,165 (1.9) | 1,077 (2.0) | 452 (2.0) | 169 (1.9) | 157 (2.8) |
| Dyslipidemia, n (%) | 4,756 (9.4) | 18,331 (9.5) | 28,169 (9.9) | 25,569 (9.6) | 17,198 (8.9) | 9,222 (8.2) | 4,451 (8.1) | 1,930 (8.4) | 733 (8.2) | 496 (8.9) |
| CVD, n (%) | 2,511 (6.2) | 7,521 (4.9) | 9,750 (4.3) | 8,231 (3.8) | 5,215 (3.3) | 2,772 (3.0) | 1,251 (2.8) | 507 (2.7) | 204 (2.8) | 135 (2.9) |
| Current smokers, n (%) | 23,766 (46.8) | 71,284 (36.9) | 81,472 (28.6) | 59,418 (22.4) | 35,330 (18.4) | 18,227 (16.2) | 8,562 (15.6) | 3,509 (15.2) | 14,89 (16.6) | 1,128 (20.2) |
| Heavy alcohol drinkers, n (%)c | 1,730 (3.4) | 6,696 (3.5) | 9,293 (3.3) | 8,062 (3.0) | 5,424 (2.8) | 3,071 (2.7) | 1,589 (2.9) | 731 (3.2) | 333 (3.7) | 302 (5.4) |
| Daily alcohol drinkers, n (%) | 8,339 (16.4) | 39,798 (20.6) | 66,990 (23.5) | 65,497 (24.6) | 47,859 (24.9) | 29,100 (25.9) | 15,331 (28.0) | 7,122 (30.9) | 3,155 (35.2) | 2,184 (39.0) |
| Regular exercisers, n (%)d | 10,158 (20.0) | 42,096 (21.8) | 68,417 (24.0) | 68,609 (25.8) | 51,899 (27.0) | 31,696 (28.2) | 16,001 (29.2) | 7,002 (30.4) | 2,811 (31.3) | 1,768 (31.6) |
Table 2. Prevalence of Proteinuria in Participants Without Habitual Alcohol Consumption
| HDL-C category (mg/dL) | 20 - 39 | 40 - 49 | 50 - 59 | 60 - 69 | 70 - 79 | 80 - 89 | 90 - 99 | ≥ 100 |
|---|
| aLow amount of alcohol consumption (less than 23 g of ethanol per session). bLow frequency of alcohol consumption (rarely drinks or cannot drink alcohol). The percentages of proteinuria were decreased across the increasing HDL-C in the both conditions (Cochran-Armitage test, both P < 0.0001). HDL-C: high-density lipoprotein cholesterol. |
| Subjects who consume low amount of alcohol (n = 460,837)a | | | | | | | | |
| Case of proteinuria, n (% in each group) | 1,383 (7.4) | 3,797 (5.5) | 4,299 (4.1) | 3,268 (3.1) | 2,132(2.7) | 1,170 (2.5) | 532 (2.4) | 372 (2.6) |
| Subjects who hardly or not drink alcohol (n = 402,180)b | | | | | | | | |
| Case of proteinuria, n (% in each group) | 1,467 (7.6) | 3,606 (5.5) | 3,908 (4.1) | 2,828 (3.1) | 1,775 (2.7) | 978 (2.6) | 443 (2.5) | 276 (2.7) |
Table 3. Incidence of Proteinuria After 6 Years in 451,987 Participants Without Proteinuria at Baseline
| HDL-C category (mg/dL) | 20 - 39 | 40 - 49 | 50 - 59 | 60 - 69 | 70 - 79 | 80 - 89 | 90 - 99 | 100 - 109 | ≥ 110 |
|---|
| The incidents of proteinuria were decreased across the increasing HDL-C (Cochran-Armitage test, P < 0.0001). HDL-C: high-density lipoprotein cholesterol. |
| N (% of total) | 18,067 (4.0) | 72,657 (16.1) | 107,775 (23.8) | 101,522 (22.5) | 74,201 (16.4) | 43,298 (9.6) | 20,991 (4.6) | 8,587 (1.9) | 4,889 (1.1) |
| Incident of proteinuria, n (% in each group) | 751 (4.2) | 2,592 (3.6) | 2,992 (2.8) | 2,218 (2.2) | 1,475 (2.0) | 819 (1.9) | 408 (1.9) | 163 (1.9) | 79 (1.6) |