Journal of Clinical Medicine Research, ISSN 1918-3003 print, 1918-3011 online, Open Access
Article copyright, the authors; Journal compilation copyright, J Clin Med Res and Elmer Press Inc
Journal website https://www.jocmr.org

Original Article

Volume 14, Number 5, May 2022, pages 202-208


No Significant Association Between Plasma Endosialin Levels and the Presence or Severity of Coronary Artery Disease

Figures

Figure 1.
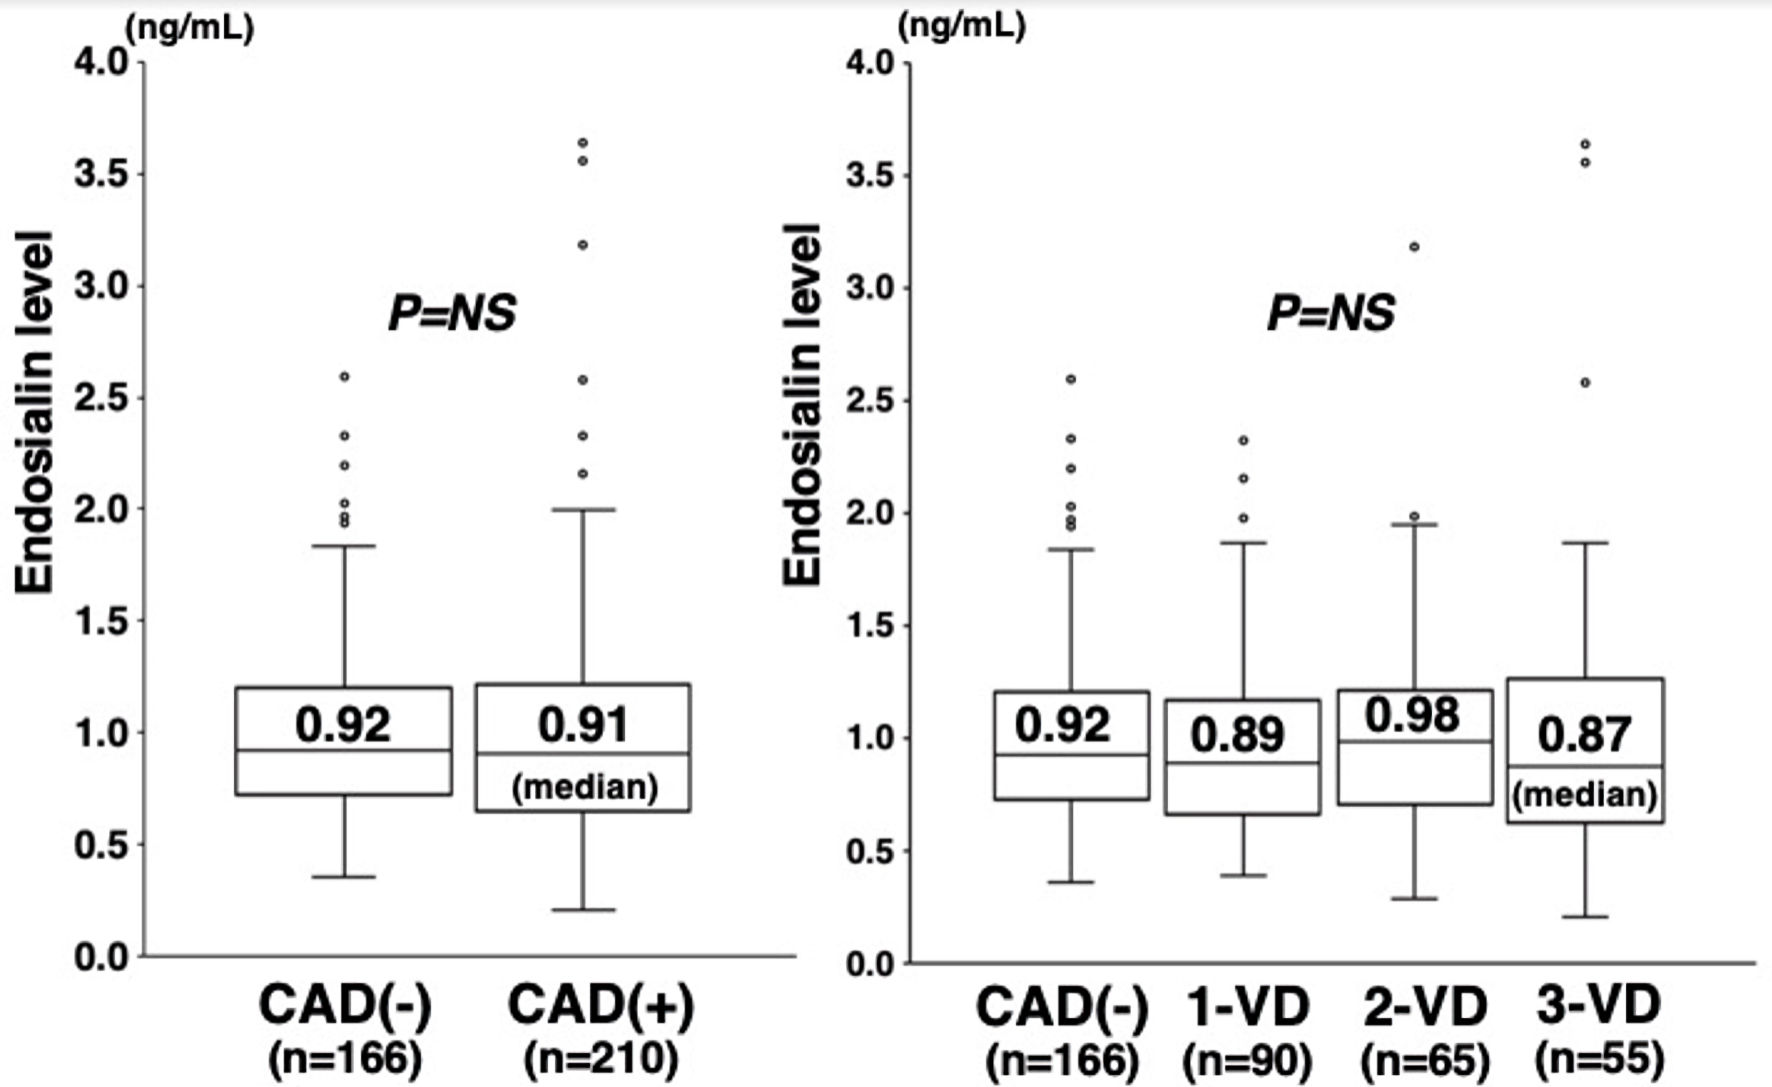
Figure 1. Plasma endosialin levels and the presence of CAD or the number of stenotic coronary vessels. Plasma endosialin levels did not significantly differ between patients with and without CAD (0.91 vs. 0.92 ng/mL) (left). No significant difference was found in endosialin levels among the four groups of CAD(-), 1-VD, 2-VD, and 3-VD (0.92, 0.89, 0.98, and 0.87 ng/mL) (right). The central line represents the median, and the box represents the 25th to 75th percentiles. The whiskers represent the lowest and highest value in the 25th percentile minus 1.5 IQR and 75th percentile plus 1.5 IQR, respectively. NS: not significant; CAD: coronary artery disease; 1-VD: one-vessel disease; 2-VD: two-vessel disease; 3-VD: three-vessel disease; IQR: interquartile range.
Figure 2.
Figure 2. Correlations between plasma endosialin levels and HbA1c or hsCRP levels. Plasma endosialin levels signficantly but weakly correlated with HbA1c levels (rs = 0.12, P < 0.025) (left). However, no significant correlation was found between endosialin and hsCRP levels (right). HbA1c: hemoglobin A1c; hsCRP: high-sensitivity CRP; NS: not significant.

Tables

Table 1. Clinical Characteristics of Patients With and Without CAD
 
CAD(-) (n = 166)P value CAD(-) vs. CADCAD (n = 210)1-VD (n = 90)2-VD (n = 65)3-VD (n = 55)P value among four groups
Data represent the mean ± SD or the number (%) of patients, except for hsCRP levels which are presented as the median value and interquartile range. CAD: coronary artery disease; 1-VD: one-vessel disease; 2-VD: two-vessel disease; 3-VD: three-vessel disease; BMI: body mass index; SBP: systolic blood pressure; HbA1c: hemoglobin A1c; LDL-C: low-density lipoprotein cholesterol; HDL-C: high-density lipoprotein cholesterol; CRP: C-reactive protein; hsCRP: high-sensitivity CRP; SD: standard deviation.
Age (years)66 ± 110.00569 ± 1068 ± 1070 ± 1071 ± 90.008
Gender (male)99 (60%)0.001159 (76%)68 (76%)48 (74%)43 (78%)0.010
BMI (kg/m2)25.3 ± 13.90.19924.0 ± 3.424.3 ± 3.724.6 ± 2.923.1 ± 3.50.530
Hypertension100 (60%)< 0.001165 (79%)68 (76%)50 (77%)47 (85%)0.001
SBP (mm Hg)129 ± 210.012134 ± 19133 ± 17137 ± 21134 ± 180.041
Diabetes mellitus29 (17%)< 0.00174 (35%)26 (29%)27 (42%)21 (38%)< 0.001
HbA1c (%)6.0 ± 0.7< 0.0016.3 ± 1.06.1 ± 0.86.4 ± 1.06.3 ± 1.00.001
Smoking50 (30%)0.05184 (40%)38 (42%)27 (42%)19 (35%)0.178
Hyperlipidemia71 (43%)< 0.001130 (62%)56 (62%)41 (63%)33 (60%)0.003
Statin49 (30%)0.00199 (47%)45 (50%)30 (46%)24 (44%)0.005
LDL-C (mg/dL)112 ± 270.403115 ± 33110 ± 34115 ± 31121 ± 320.151
HDL-C (mg/dL)59 ± 16< 0.00152 ± 1354 ± 1451 ± 1249 ± 14< 0.001
hsCRP (mg/L)0.43 (0.22, 0.92)0.0070.57 (0.30, 1.19)0.52 (0.28, 0.95)0.57 (0.35, 1.11)0.58 (0.35, 1.48)0.019


Table 2. Correlations Between Plasma Endosialin or hsCRP Levels and the Severity of CAD
 
rsP value
rs indicates correlation coefficient by the Spearman’s rank correlation test. CRP: C-reactive protein; hsCRP: high-sensitivity CRP; CAD: coronary artery disease; BMI: body mass index; HbA1c: hemoglobin A1c; LDL: low-density lipoprotein; HDL: high-density lipoprotein.
Plasma endosialin levels
  The number of > 50% stenotic coronary segments0.020.700
  The number of > 25% stenotic coronary segments0.020.752
  The severity score of stenosis0.020.782
  BMI-0.030.634
  Fasting glucose level-0.040.432
  HbA1c level0.120.023
  LDL-cholesterol level0.010.827
  HDL-cholesterol level-0.040.412
  hsCRP level0.080.103
Plasma hsCRP levels
  The number of > 50% stenotic coronary segments0.150.003
  The number of > 25% stenotic coronary segments0.160.003
  The severity score of stenosis0.150.003


Table 3. Factors Associated With CAD (Multiple Logistic Regression Analysis of the 376 Study Patients)
 
Odds ratio (95% CI)P value
The dependent variable was the presence of CAD. The analysis included age (per 10-year increase), male gender, hypertension, hyperlipidemia, statin use, low HDL-cholesterol level (< 40 mg/dL), DM, smoking, and hsCRP and endosialin levels. DM: diabetes mellitus; CAD: coronary artery disease; HDL: high-density lipoprotein; CI: confidence interval.
Age (per 10-year increase)1.35 (1.08 - 1.69)0.010
Male gender2.39 (1.43 - 3.99)0.001
Hypertension1.75 (1.06 - 2.90)0.029
Hyperlipidemia2.17 (1.35 - 3.50)0.001
Low HDL-cholesterol level2.09 (1.01 - 4.34)0.047