Journal of Clinical Medicine Research, ISSN 1918-3003 print, 1918-3011 online, Open Access
Article copyright, the authors; Journal compilation copyright, J Clin Med Res and Elmer Press Inc
Journal website https://www.jocmr.org

Original Article

Volume 14, Number 5, May 2022, pages 188-195


Analysis of Risk Factors of Soft Tissue Bleeding in COVID-19 Patients: A Point of View After Two Years of Pandemic

Figures

Figure 1.
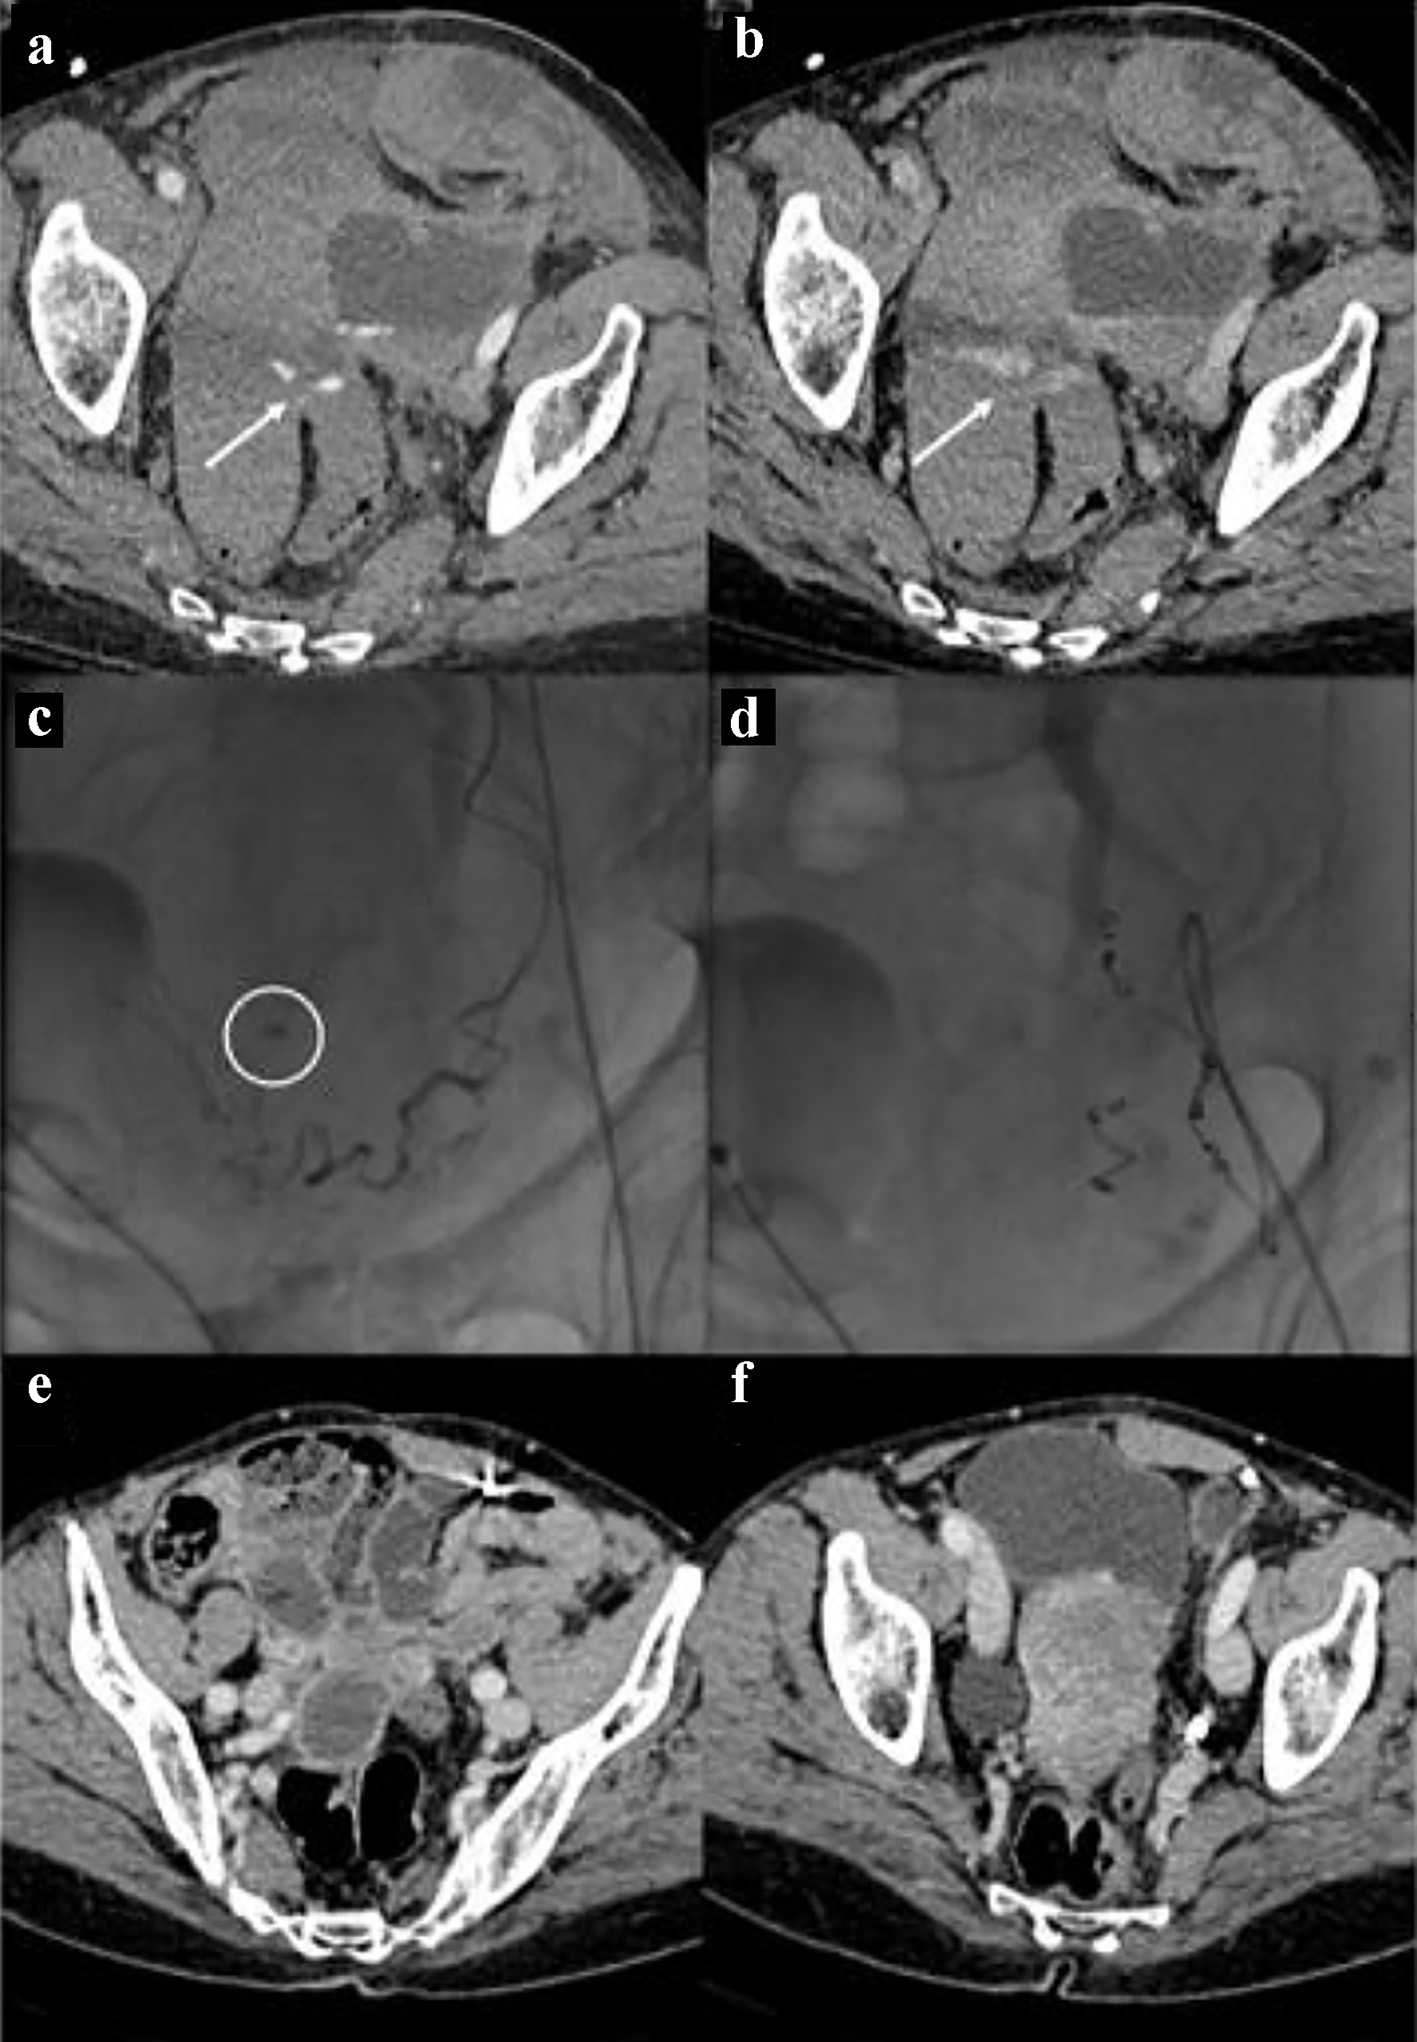
Figure 1. Bleeding in the context of the left uterine broad ligament. The CT images in (a) and (b) show the spots of active bleeding (arrows) with progressive spread of contrast medium. The angiographic image in (c) shows the active bleeding spot adjacent to the left uterine artery. The angiographic image in (d) shows the complete embolization, by means of metallic micro-spirals, of the arterial afferents at the bleeding point. CT images in (e) and (f) show complete reabsorption of hematomas after 3 months. CT: computed tomography.
Figure 2.
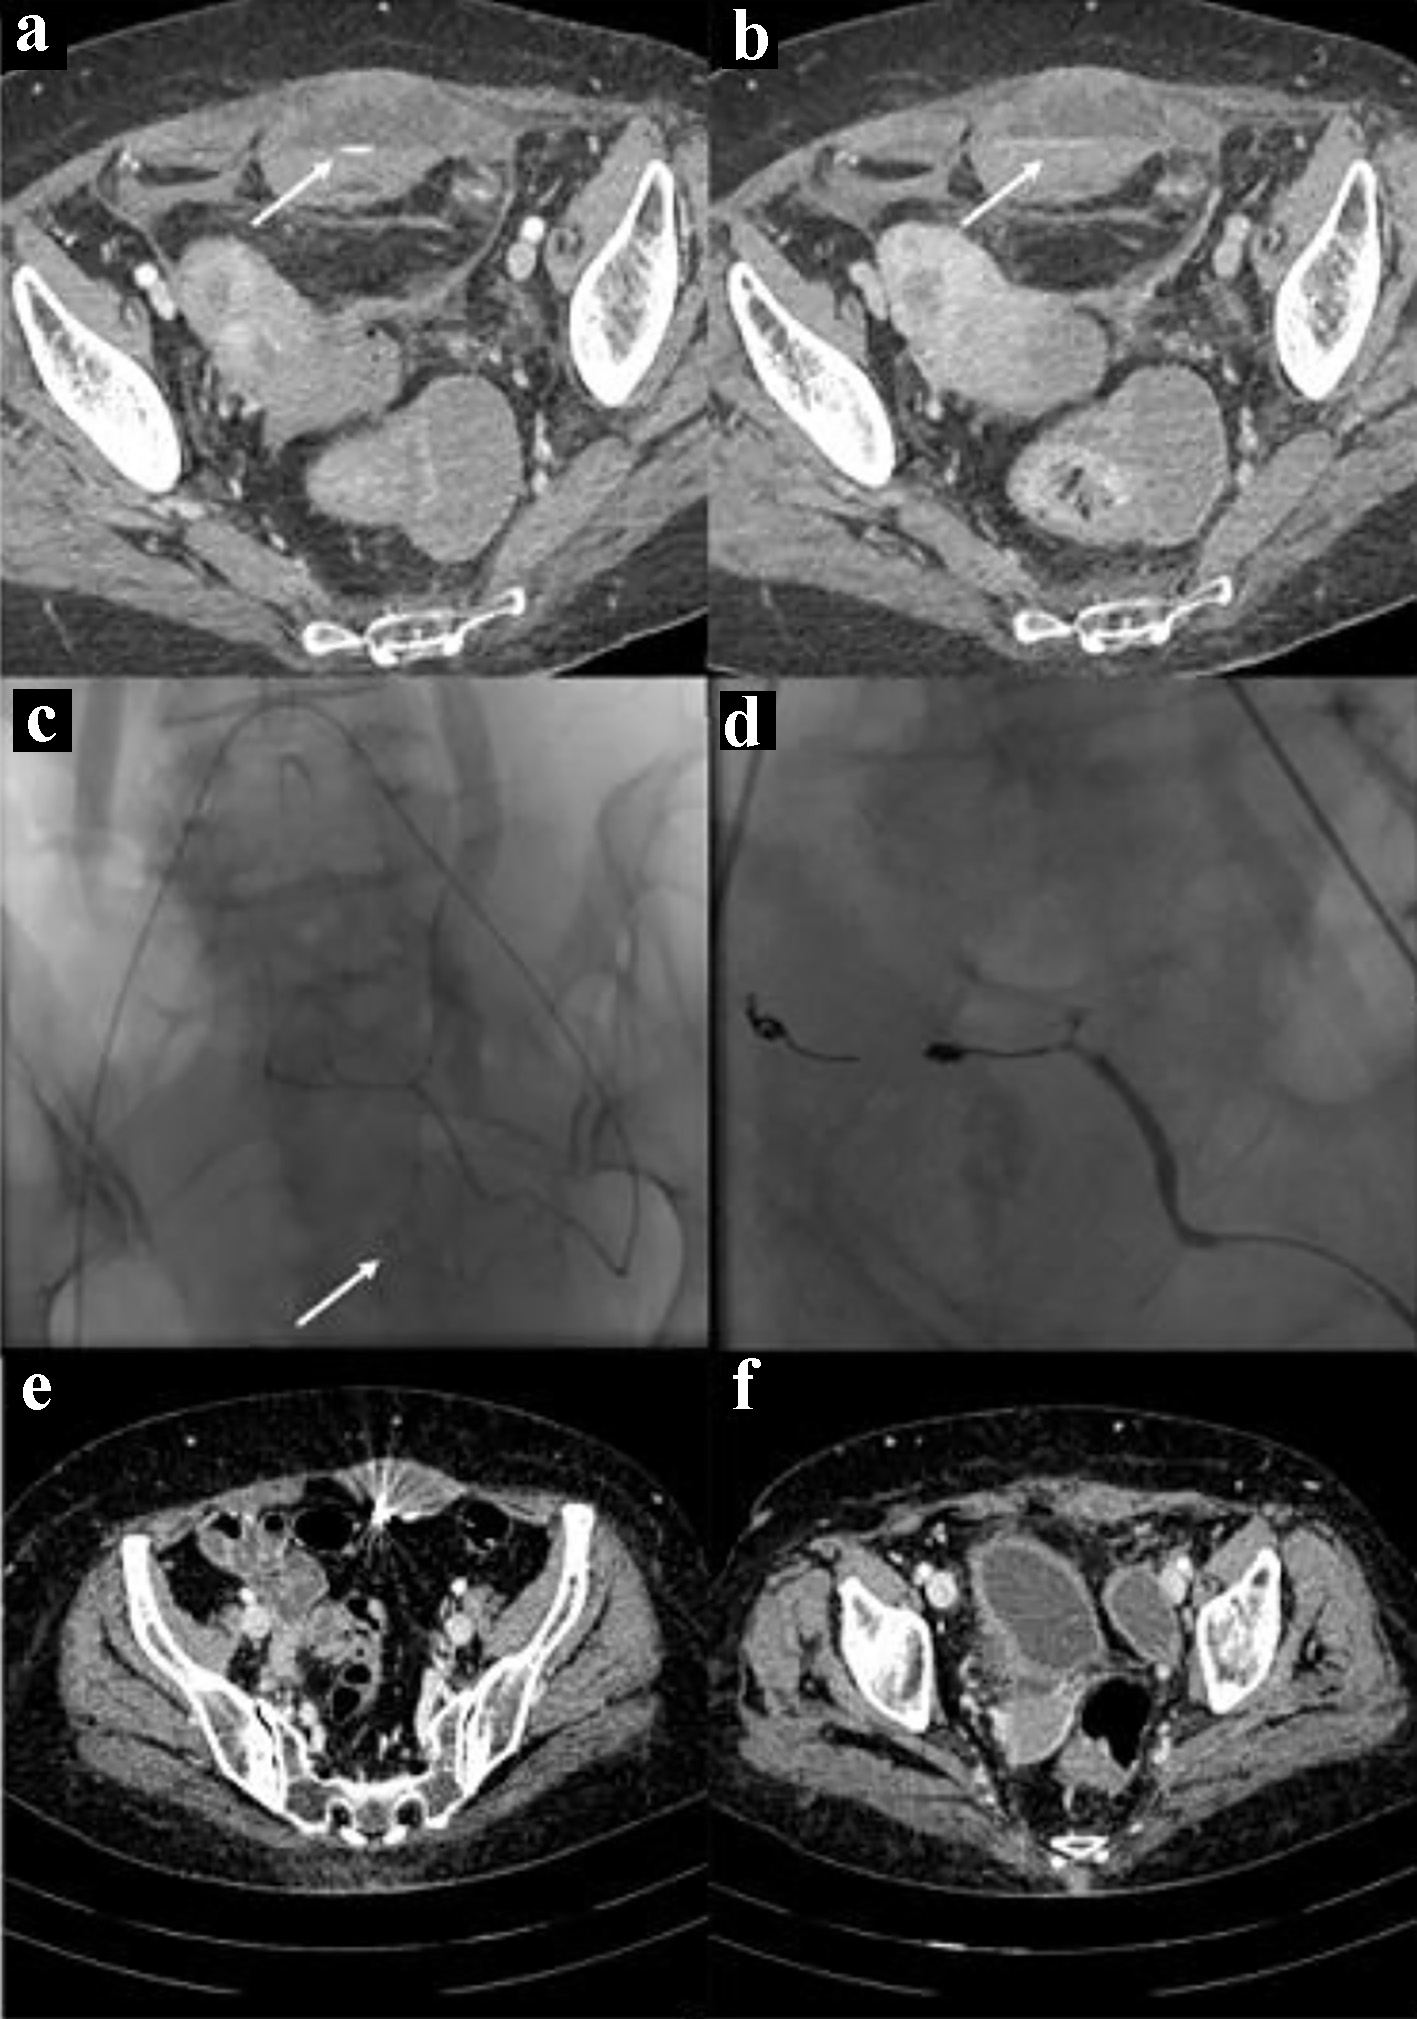
Figure 2. Bleeding in the context of the left rectus abdominis muscle. The CT images in (a) and (b) show the spots of active bleeding (arrows) with progressive spread of contrast medium. The angiographic image in (c) shows the active bleeding spot (arrow) adjacent to the left inferior epigastric artery. The angiographic image in (d) shows the complete embolization, by means of glue and metallic micro-spirals, of the arterial afferents at the bleeding point. CT images in (e) and (f) show complete reabsorption of hematomas after 3 months. CT: computed tomography.
Figure 3.
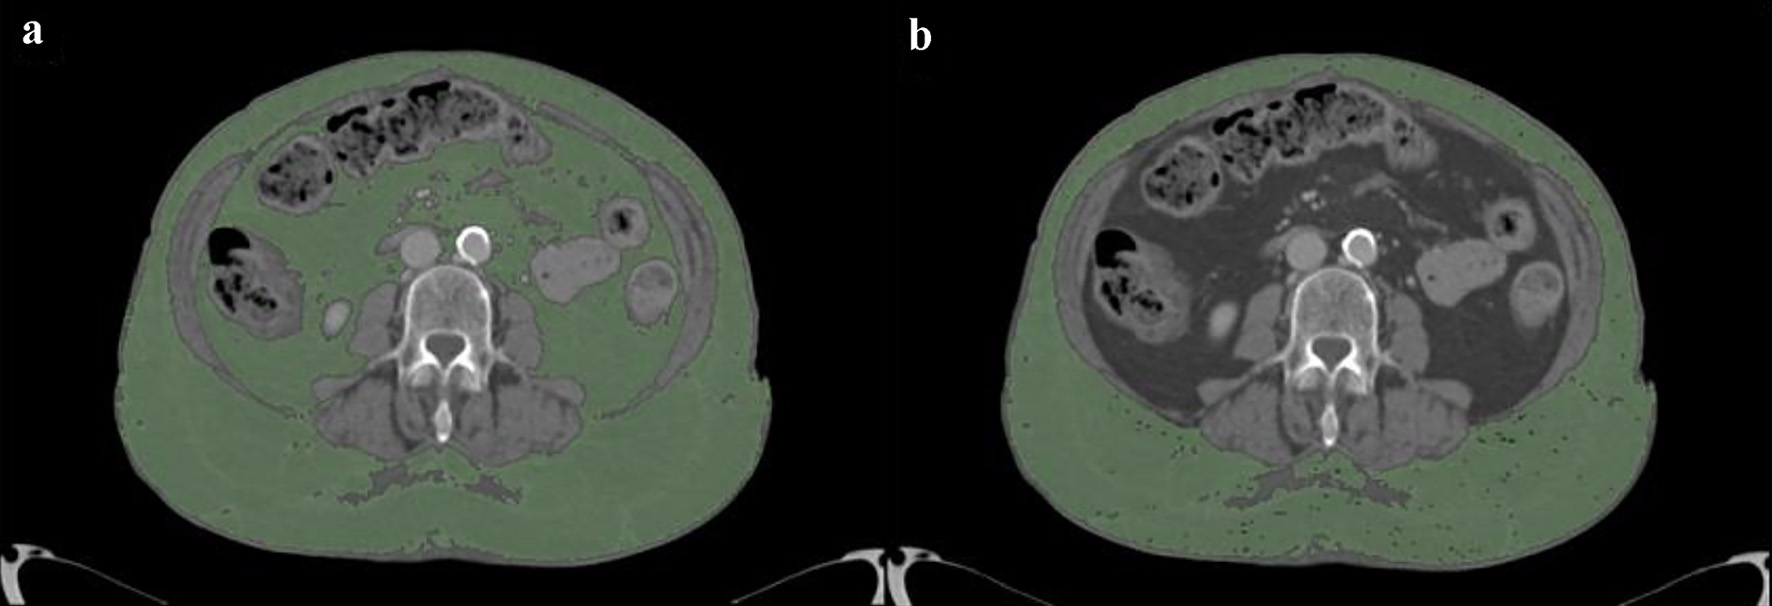
Figure 3. Measurement of adipose tissue areas in cm2 obtained by analyzing axial CT images at the level of the third lumbar vertebra with an image processing application (OsiriX, Pixmeo, Bernex, Switzerland): TAT (a) and SAT (b). VAT is calculated by difference between TAT and SAT. CT: computed tomography; TAT: total adipose tissue; SAT: subcutaneous adipose tissue; VAT: visceral adipose tissue.

Tables

Table 1. Soft Tissue Bleeding Features and Embolization Techniques
 
Soft tissue bleeding featuresNo. of patients
Bleeding site
  Iliopsoas muscle16
  Rectus abdominis muscle12
  Quadriceps femoris muscle4
  Adductor magnus muscle4
  Soleus muscle2
  Triceps brachii muscle5
  Biceps brachii muscle3
  Upper abdomen8
  Pelvic floor6
  Serratus anterior muscle4
  Pectoralis minor muscle2
  Masseter muscle2
  Scalene muscles2
Embolization techniques
  Coils4
  Glue2
  Gelfoam2
  Coils + gelfoam2
  Coils + glue2
  Coils + microparticles4


Table 2. Variables for Bleeding Group and Control Group
 
VariablesBleeding groupControl groupP
COVID-19: coronavirus disease 2019; SS: severity score; BMI: body mass index; PLT: platelet; INR: international rationalized ratio; SAT: subcutaneous adipose tissue; VAT: visceral adipose tissue.
No. of patients7062
Sex (male/female)50/2046/16> 0.05
Age (mean ± SD) (years)70.9 ± 11,665 ± 11.2< 0.05
COVID-19 SS12.5 ± 4.714.6 ± 4.5> 0.05
BMI (kg/m2)26.6 ± 3.729.6 ± 4.9< 0.05
PLT count (× 109/L)235.3 ± 91.2254 ± 75.6> 0.05
INR1.3 ± 0.31.2 ± 0.2> 0.05
SAT area (cm2)136 ± 78159 ± 82.2> 0.05
VAT area (cm2)168 ± 84.6196 ± 101.9> 0.05
VAT/SAT1.5 ± 0.81.5 ± 0.9> 0.05


Table 3. Variables for Embolization Group and Non-Embolization Group
 
VariablesEmbolization groupNon-embolization groupP
COVID-19: coronavirus disease 2019; SS: severity score; BMI: body mass index; PLT: platelet; INR: international rationalized ratio; SAT: subcutaneous adipose tissue; VAT: visceral adipose tissue.
No. of patients1654
Sex (male/female)6/1044/10< 0.05
Age (mean ± SD) (years)72.6 ± 6.270.4 ± 12.8> 0.05
COVID-19 SS10.1 ± 4.613.2 ± 4.5> 0.05
BMI (kg/m2)25.3 ± 427.4 ± 3.6< 0.05
PLT count (× 109/L)276.1 ± 65.7222.7 ± 95.2> 0.05
INR1.4 ± 0.51.2 ± 0.2> 0.05
SAT area (cm2)105.6 ± 63.2145 ± 80.7> 0.05
VAT area (cm2)118.5 ± 58.4182.7 ± 86.4< 0.05
VAT/SAT1.4 ± 0.71.6 ± 0.8> 0.05


Table 4. Multivariate Logistic Regression Analysis for Bleeding and Control Groups and for Embolization and Non-Embolization Groups
 
VariablesScoredfSignificance
*Significance was set at 0.05. BMI: body mass index; PLT: platelet; INR: international rationalized ratio; Hb: hemoglobin.
Bleeding and control groups
  Age0.64610.421
  Sex15.0861< 0.001*
  BMI1.83910.175
  PLT7.18910.007*
  INR0.02410.877
  Hb0.00310.955
  Overall status18.50560.005
Embolization and non-embolization groups
  Age0.06310.802
  Sex2.18210.140
  BMI13.6031< 0.001*
  PLT0.63110.427
  INR2.06410.151
  Hb3.82310.051
  Overall status16.87160.010