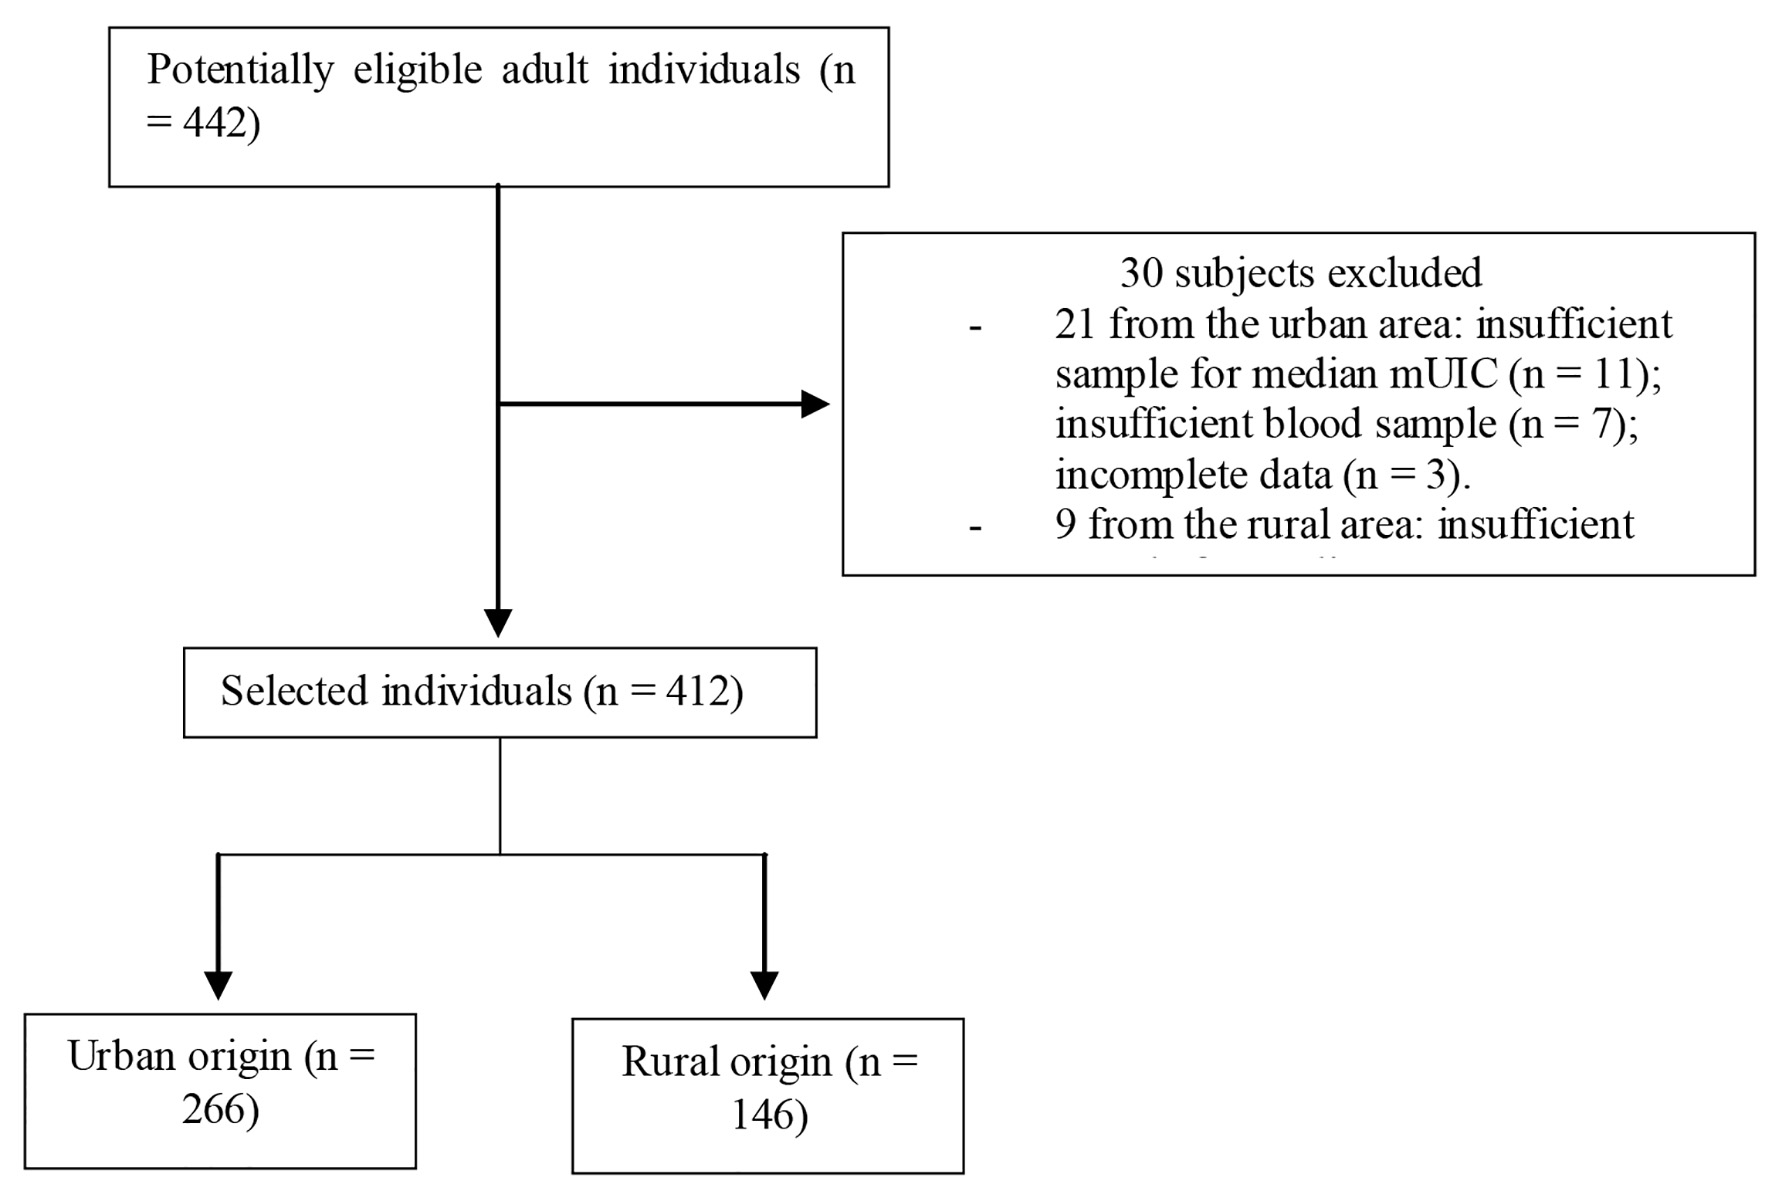
Figure 1. Flowchart of the participants included in the trial. mUIC: median urinary iodine concentration.
| Journal of Clinical Medicine Research, ISSN 1918-3003 print, 1918-3011 online, Open Access |
| Article copyright, the authors; Journal compilation copyright, J Clin Med Res and Elmer Press Inc |
| Journal website https://www.jocmr.org |
Original Article
Volume 14, Number 3, March 2022, pages 126-135
Population Status of Iodine and Its Potential Effects on Thyroid Function and Autoimmunity in Southwestern Colombia
Figures
Tables
| Variables | Frequency | Percentage (%) |
|---|---|---|
| aFirst-degree family history (self-reported) of goiter, hypothyroidism, hyperthyroidism, and thyroid cancer. BMI: body mass index; SES: socioeconomic status. | ||
| Gender | ||
| Female | 336 | 81.6 |
| Male | 76 | 18.4 |
| Age in years | ||
| < 40 | 189 | 45.9 |
| 40 - 59 | 171 | 41.5 |
| ≥ 60 | 52 | 12.6 |
| Ethnicity | ||
| Mestizo | 397 | 96.4 |
| Indigenous | 87 | 1.9 |
| Afro descendent | 7 | 1.7 |
| Origin | ||
| Rural | 146 | 35.4 |
| Urban | 266 | 64.6 |
| SES | ||
| Low | 314 | 76.2 |
| Medium | 62 | 15.1 |
| High | 36 | 8.7 |
| BMI (kg/m2) | ||
| Low weight | 6 | 1.5 |
| Normal | 136 | 33 |
| Overweight | 173 | 42 |
| Obesity I | 75 | 18.2 |
| Obesity II | 17 | 4.1 |
| Obesity III | 5 | 1.2 |
| Family history of thyroid disorders (self-reported)a | ||
| Yes | 154 | 37.4 |
| No | 258 | 62.6 |
| Variables | mUIC | N | P-value | |||
|---|---|---|---|---|---|---|
| Low intake | Adequate | More than adequate | Excessive | |||
| mUIC: median urinary iodine concentration; SES: socioeconomic status. | ||||||
| Gender | ||||||
| Female | 85 (25.3%) | 150 (44.6%) | 10 (3%) | 91 (27.1%) | 336 | 0.065 |
| Male | 15 (19.7%) | 26 (34.2%) | 3 (3.9%) | 32 (42.1%) | 76 | |
| Total | 412 | |||||
| SES | ||||||
| High | 5 (13.9%) | 6 (16.7%) | 4 (11.1%) | 21 (58.3%) | 36 | ≤ 0.001 |
| Middle | 9 (14.8%) | 23 (37.7%) | 2 (3.3%) | 27 (44.3%) | 61 | |
| Low | 86 (27.3%) | 147 (46.7%) | 7 (2.22%) | 75 (23.8%) | 315 | |
| Total | 412 | |||||
| Origin | ||||||
| Rural | 34 (23.3%) | 83 (56.8%) | 3 (2.1%) | 26 (17.8%) | 146 | ≤ 0.001 |
| Urban | 66 (24.8%) | 93 (35%) | 10 (3.8%) | 97 (36.5%) | 266 | |
| Total | 412 | |||||
| Characteristics | Deficiency (< 100 µg/L) | Adequate (100 - 199 µg/L) | More than adequate (200 - 299 µg/L) | Excessive (≥ 300 µ/L) | P-valuea |
|---|---|---|---|---|---|
| aANOVA, HSD Tukey. P < 0.05: *between the group with excessive vs. deficient mUIC; **between the groups with excessive vs. adequate mUIC; ***between the groups with excessive vs. deficient mUIC; ****between the groups with excessive vs. adequate mUIC. Anti-Tg: anti-thyroglobulin; anti-TPO: anti-thyroid peroxidase; BMI: body mass index; IQR: interquartile range; mUIC: median urinary iodine concentration; SD: standard deviation; TRAb: anti-TSH receptor; TSH: thyrotropin. | |||||
| Number of participants | 100 | 176 | 13 | 123 | - |
| mUIC (IQR) | 70.1 (58.6 - 86.1) | 143.9 (122.6 - 168) | 230.5 (209.6 - 289.1) | 408 (353.8 - 518) | ≤ 0.001* |
| Age in years (median (SD)) | 41.3 (12.7) | 40.7 (13.14) | 48.2 (17.4) | 45.5 (17.1) | 0.013** |
| BMI (mean (SD)) | 27.2 (4.2) | 26.7 (5.0) | 26.3 (2.8) | 26.4 (3.6) | 0.58 |
| TSH (median (IQR)) | 2.1 (1.48 - 3.19) | 2.4 (1.63 - 3.47) | 3.12 (1.18 - 5.33) | 2.82 (1.13 - 4.74) | 0.034*** |
| TRAb (median (IQR)) | 0.10 (0.08 - 0.13) | 0.10 (0.10 - 0.10) | 0.10 (0.07 - 0.10) | 0.10 (0.09 - 0.10) | 0.791 |
| Anti-Tg (median (IQR)) | 20 (19.2 - 29) | 20 (20 - 24.75) | 20 (20 - 33.5) | 21 (20 - 34) | 0.008**** |
| Anti-TPO (median (IQR)) | 10 (9.8 - 20.12) | 10.8 (10 - 23.25) | 26 (10 - 49.5) | 16 (10 - 31) | 0.58 |
| Variables | Category | Adjusted PR | 95% CI | P-value |
|---|---|---|---|---|
| aHypothyroidism was tentatively defined as TSH > 4.0 mIU/L. Confounding variables for adjustment included: age, gender, SES and levels of mUIC. CI: confidence interval; mUIC: median urinary iodine concentration; PR: prevalence ratio; SES: socioeconomic status; TSH: thyrotropin. | ||||
| Age (years) | ≥ 60 vs. < 40 | 2.45 | 1.59 - 3.78 | ≤ 0.001 |
| Gender | Female vs. male | 1.52 | 1.10 - 2.09 | 0.01 |
| SES | Low vs. high | 0.53 | 0.36 - 0.78 | ≤ 0.001 |
| mUIC | Excessive vs. adequate | 2.73 | 1.47 - 5.08 | ≤ 0.001 |
| Parameter | Variables | PR | 95% CI | P-value |
|---|---|---|---|---|
| aConfounding variables for adjustment included: gender, elevated TSH, origin, and SES. CI: confidence interval; mUIC: median urinary iodine concentration; PR: prevalence ratio; SES: socioeconomic status; TSH: thyrotropin. | ||||
| mUIC ≥ 300 µg/L | Gender (female vs. male) | 1.916 | 1.089 - 3.370 | 0.011 |
| Elevated TSH (vs. normal) | 1.726 | 1.015 - 2.935 | 0.010 | |
| Origin (rural vs. urban) | 3.11 | 1.88 - 5.34 | 0.01 | |
| Goiter | SES (middle vs. high) | 0.60 | 0.39 - 0.91 | 0.02 |