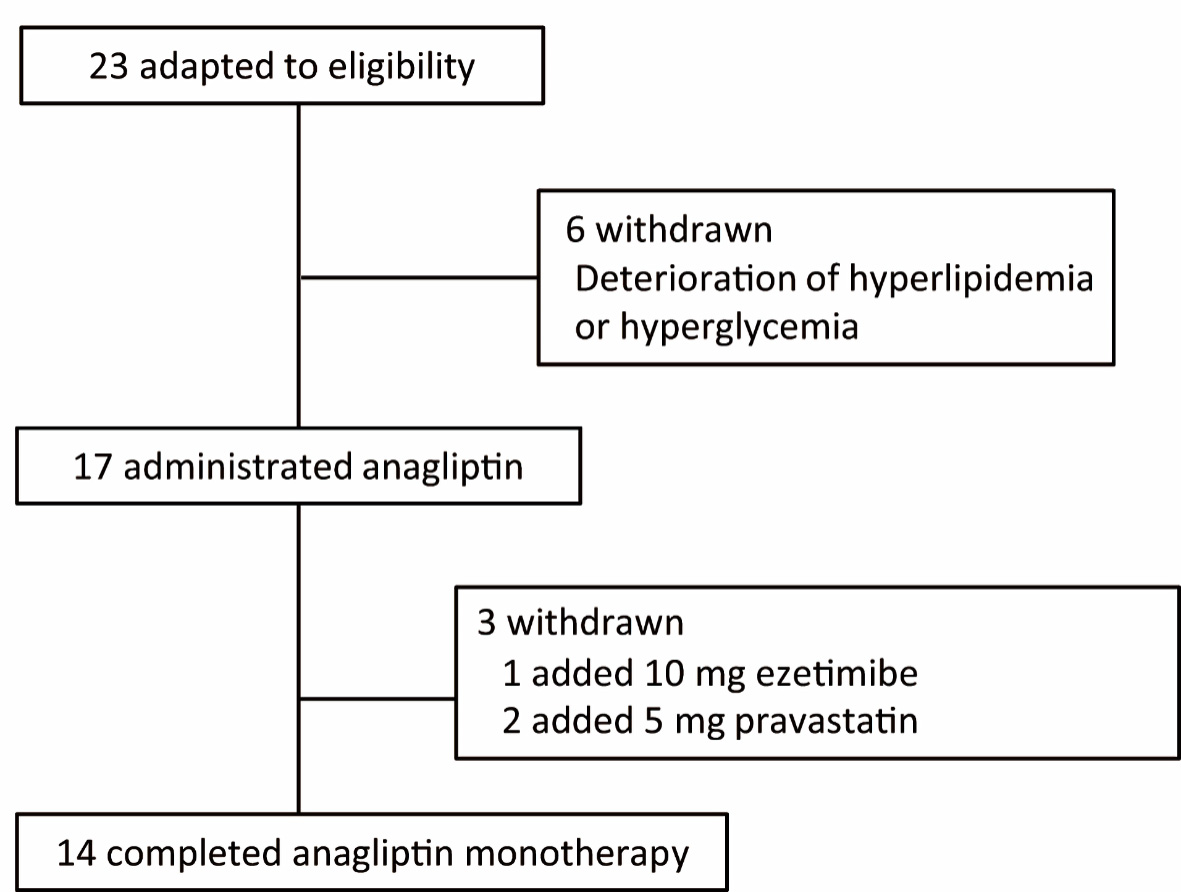
Figure 1. Flowchart of participant selection in this study.
| Journal of Clinical Medicine Research, ISSN 1918-3003 print, 1918-3011 online, Open Access |
| Article copyright, the authors; Journal compilation copyright, J Clin Med Res and Elmer Press Inc |
| Journal website https://www.jocmr.org |
Original Article
Volume 13, Number 10-11, November 2021, pages 502-509
Anagliptin Monotherapy for Six Months in Patients With Type 2 Diabetes Mellitus and Hyper-Low-Density Lipoprotein Cholesterolemia Reduces Plasma Levels of Fasting Low-Density Lipoprotein Cholesterol and Lathosterol: A Single-Arm Intervention Trial
Figures
Tables
| Characteristic unit | PG (mg/dL) | PG, 1 h (mg/dL) | PG, 2 h (mg/dL) | Proinsulin (pmol/L) | Proinsulin, 1 h (pmol/L) | Proinsulin, 2 h (pmol/L) | Insulin (µIU/mL) | Insulin, 1 h (µIU/mL) | Insulin, 2 h (µIU/mL) |
|---|---|---|---|---|---|---|---|---|---|
| The conversion factors were as follows: glucose (mmol/L) = glucose (mg/dL)/18.0, insulin (pmol/L) = insulin (µIU/mL)/0.144. PG: plasma glucose. | |||||||||
| A (baseline) | 112 | 272 | 283 | 22.0 | 44.2 | 77.9 | 9.16 | 26.8 | 26.9 |
| A (6 months) | 126 | 293 | 288 | 14.9 | 44.0 | 88.9 | 5.59 | 36.8 | 36.8 |
| C (baseline) | 135 | 219 | 244 | 17.5 | 39.4 | 75.6 | 12.0 | 52 | 79.2 |
| C (6 months) | 129 | 164 | 151 | 20.1 | 34.7 | 51.3 | 11.2 | 35.4 | 55.4 |
| E (baseline) | 159 | 279 | 325 | 9.4 | 33 | 54.4 | 2.52 | 13.1 | 21.4 |
| E (6 months) | 132 | 208 | 195 | 10.1 | 37.3 | 57.2 | 3.68 | 14.2 | 16.3 |
| F (baseline) | 119 | 237 | 201 | 6.7 | 29.7 | 49.3 | 5.87 | 35.4 | 49 |
| F (6 months) | 131 | 222 | 201 | 9.3 | 22.4 | 39.8 | 5.24 | 32.3 | 38.3 |
| G (baseline) | 153 | 219 | 218 | 27.7 | 64.9 | 69.9 | 8.01 | 41.5 | 26.1 |
| G (6 months) | 118 | 135 | 163 | 21.9 | 47.2 | 64.3 | 7.3 | 26.6 | 20.0 |
| H (baseline) | 128 | 228 | 230 | 7.1 | 46.7 | 86.8 | 3.06 | 23.9 | 43.9 |
| H (6 months) | 129 | 220 | 202 | 3.1 | 28.4 | 56.5 | 2.02 | 22.8 | 31.2 |
| I (baseline) | 113 | 222 | 246 | 31.3 | 79.1 | 116 | 14.3 | 106 | 116 |
| I (6 months) | 110 | 156 | 188 | 21.1 | 47.1 | 63.2 | 12.1 | 56.3 | 42.3 |
| J (baseline) | 111 | 229 | 209 | 20.5 | 70.9 | 116 | 9.21 | 53.0 | 72.1 |
| J (6 months) | 104 | 160 | 152 | 10.3 | 53.4 | 59.9 | 7.41 | 51.4 | 53.4 |
| K (baseline) | 142 | 301 | 299 | 34.7 | 84.1 | 119 | 6.12 | 34.7 | 25.8 |
| K (6 months) | 117 | 152 | 162 | 20.3 | 43.7 | 53.2 | 4.45 | 32.4 | 20.3 |
| L (baseline) | 126 | 223 | 261 | 9.0 | 18.5 | 43.8 | 6.71 | 18.1 | 34.6 |
| L (6 months) | 123 | 241 | 235 | 3.1 | 20.8 | 42.5 | 6.38 | 29.2 | 31.6 |
| N (baseline) | 88 | 145 | 140 | 11.6 | 99.0 | 116 | 6.74 | 99.2 | 77.7 |
| N (6 months) | 89 | 139 | 121 | 5.6 | 41.4 | 45.0 | 6.45 | 59.9 | 72.7 |
| O (baseline) | 137 | 276 | 280 | 17.5 | 57.5 | 99.1 | 4.58 | 25.3 | 32.0 |
| O (6 months) | 122 | 249 | 253 | 22.2 | 69.3 | 87.1 | 4.03 | 40.7 | 37.5 |
| P (baseline) | 107 | 216 | 189 | 31.6 | 139 | 181 | 7.33 | 86.3 | 67.9 |
| P (6 months) | 108 | 190 | 166 | 26.0 | 106 | 159 | 8.36 | 49.3 | 67.1 |
| Q (baseline) | 133 | 269 | 246 | 48.7 | 109 | 149 | 13.6 | 97.4 | 89.1 |
| Q (6 months) | 105 | 241 | 207 | 45.3 | 89.1 | 127 | 19.9 | 107 | 121 |
| Characteristic unit | Age (years) | BMI (kg/m2) | TC (mg/dL) | LDL-C (mg/dL) | HDL-C (mg/dL) | TG (mg/dL) | Latho (µg/mL) | Campe (µg/mL) | Sito (µg/mL) |
|---|---|---|---|---|---|---|---|---|---|
| Lipid profiles at baseline and after 6 months of treatment in 14 patients. The conversion factors were as follows: cholesterol (mmol/L) = cholesterol (mg/dL)/38.6, triglyceride (mmol/L) = triglyceride (mg/dL)/88.5. BMI: body mass index; TC: total cholesterol; LDL-C: low-density lipoprotein cholesterol; HDL-C: high-density lipoprotein cholesterol; TG: triglycerides. | |||||||||
| A (baseline) | 67 | 23.3 | 269 | 183 | 52 | 172 | 3.0 | 6.3 | 3.4 |
| A (6 months) | 23.3 | 250 | 163 | 58 | 147 | 1.9 | 6.5 | 3.2 | |
| C (baseline) | 75 | 23.5 | 203 | 144 | 40 | 94 | 2.8 | 3.7 | 1.9 |
| C (6 months) | 23.2 | 177 | 120 | 39 | 90 | 2.4 | 3.6 | 1.8 | |
| E (baseline) | 63 | 24.6 | 262 | 181 | 66 | 73 | 4.4 | 9.2 | 4.6 |
| E (6 months) | 24.6 | 304 | 202 | 72 | 151 | 2.7 | 14.2 | 6.5 | |
| F (baseline) | 66 | 21.6 | 324 | 235 | 70 | 94 | 4.2 | 6.3 | 4.6 |
| F (6 months) | 21.6 | 307 | 224 | 67 | 81 | 3.1 | 7.8 | 4.7 | |
| G (baseline) | 60 | 28.3 | 295 | 217 | 55 | 117 | 4.5 | 7.0 | 3.3 |
| G (6 months) | 27.0 | 296 | 218 | 58 | 99 | 2.9 | 6.8 | 3.4 | |
| H (baseline) | 74 | 18.6 | 216 | 149 | 52 | 76 | 1.6 | 4.7 | 2.7 |
| H (6 months) | 18.6 | 199 | 131 | 53 | 77 | 1.6 | 3.8 | 2.0 | |
| I (baseline) | 53 | 28.8 | 229 | 155 | 50 | 121 | 6.0 | 4.7 | 2.2 |
| I (6 months) | 28.9 | 170 | 66.4 | 84 | 98 | 2.7 | 5.2 | 2.5 | |
| J (baseline) | 66 | 27.6 | 264 | 169 | 86 | 43 | 4.5 | 4.3 | 2.6 |
| J (6 months) | 27.5 | 171 | 78.0 | 84 | 45 | 2.4 | 7.5 | 3.5 | |
| K (baseline) | 71 | 25.1 | 246 | 157 | 51 | 192 | 2.2 | 8.1 | 3.9 |
| K (6 months) | 27.5 | 223 | 139 | 54 | 152 | 2.2 | 7.1 | 4.1 | |
| L (baseline) | 64 | 21.9 | 262 | 176 | 70 | 78 | 2.6 | 4.5 | 2.1 |
| L (6 months) | 21.6 | 269 | 173 | 70 | 131 | 2.5 | 4.9 | 2.3 | |
| N (baseline) | 60 | 20.1 | 256 | 152 | 51 | 265 | 3.9 | 7.0 | 3.8 |
| N (6 months) | 20.1 | 170 | 86.0 | 51 | 165 | 2.0 | 7.1 | 5.0 | |
| O (baseline) | 60 | 30.3 | 239 | 160 | 59 | 102 | 2.4 | 4.3 | 2.1 |
| O (6 months) | 31.8 | 228 | 142 | 58 | 142 | 2.7 | 4.8 | 2.5 | |
| P (baseline) | 69 | 27.3 | 299 | 216 | 51 | 162 | 4.3 | 5.8 | 3.2 |
| P (6 months) | 29.4 | 262 | 176 | 44 | 210 | 2.8 | 6.7 | 3.8 | |
| Q (baseline) | 77 | 25.0 | 245 | 165 | 67 | 63 | 3.5 | 8.3 | 4.7 |
| Q (6 months) | 25.3 | 237 | 160 | 59 | 88 | 2.9 | 8.3 | 4.1 | |