Journal of Clinical Medicine Research, ISSN 1918-3003 print, 1918-3011 online, Open Access |
Article copyright, the authors; Journal compilation copyright, J Clin Med Res and Elmer Press Inc |
Journal website https://www.jocmr.org |
Short Communication
Volume 13, Number 8, August 2021, pages 425-433
A Pilot Study of Intervention With a Mobile Application Visualizing the Macronutrient Content for Type 2 Diabetes at a Japanese Center
Figures
Tables
ICC (2, 36) (95% CI) | Bland-Altman analysis | ||||
---|---|---|---|---|---|
Fixed bias | Proportional bias | ||||
95% CI (%) | Test of no correlation | Bias | |||
An ICC over 0.81 indicates high reliability. ICC: intraclass correlation coefficient; app: application; CI: confidence interval. | |||||
Energy | 0.94 (0.89 - 0.97) | -268.0 - 306.9 | R = 0.12 | P = 0.64 | None |
Protein | 0.92 (0.83 - 0.96) | -0.6 - 1.4 | R = 0.01 | P = 0.99 | None |
Lipid | 0.88 (0.76 - 0.94) | -0.8 - 1.7 | R = 0.03 | P = 0.85 | None |
Carbohydrate | 0.95 (0.90 - 0.97) | -44.4 - 36.7 | R = 0.12 | P = 0.36 | None |
Fiber | 0.82 (0.65 - 0.91) | -0.2 - 1.5 | R = -0.06 | P = 0.74 | None |
Salt | 0.84 (0.67 - 0.92) | -3.5 - 2.0 | R = -0.19 | P = 0.26 | None |
Baseline | 3 months | P value | |
---|---|---|---|
Total n = 18. Data are expressed as means ± SD for normally distributed data and medians (interquartile range) for data with skewed distributions. *A P value < 0.05 denotes the presence of a statistically significant difference. HbA1c: hemoglobin A1c; GA: glycated albumin; BW: body weight; BMI: body mass index; LDL-C: low-density lipoprotein cholesterol; HDL-C: high-density lipoprotein cholesterol; DTSQ: diabetes treatment satisfaction questionnaire; PAID: problem areas in diabetes; BP: blood pressure; app: application. | |||
HbA1c (%) | 7.9 (7.58 - 8.23) | 7.6 (7.3 - 8.23) | 0.0410* |
GA (%) | 18.9 (17.9 - 20.1) | 18.75 (17.025 - 9.825) | 0.0032* |
BW (kg) | 68.3 (56.95 - 81.88) | 66.1 (55.45 - 79.63) | 0.0044* |
BMI (kg/m2) | 25.17 (21.63 - 28.59) | 24.54 (21.57 - 27.81) | 0.0057* |
LDL-C (mg/dL) | 100 (79.25 - 132.75) | 99 (77.75 - 138.75) | 0.7220 |
HDL-C (mg/dL) | 54 (42.5 - 60.5) | 57.5 (40.75 - 65.75) | 0.0532 |
Triglycerides (mg/dL) | 126 (90.25 - 289.75) | 154 (77.75 - 268.75) | 0.7281 |
Glucose (mg/dL) | 147 (132 - 163.75) | 149.5 (128.25 - 181.25) | 0.6650 |
Urinary albumin (mg/gCre) | 8.5 (6.75 - 13.25) | 8 (3.75 - 24.5) | 0.1359 |
DTSQ | 20 (18 - 24) | 21 (18 - 24.5) | 0.1063 |
PAID | 40 (27.5 - 51.56) | 33.75 (16.88 - 52.5) | 0.1361 |
Systolic BP (mm Hg) | 129.5 (112 - 140.25) | 125.5 (115.5 - 145.75) | 0.7060 |
Energy by app (kcal/day) | 1,998.5 (1,754.25 - 2,407.75) | 1,991 (1,752.75 - 2,154) | 0.1068 |
Energy by dietician (kcal/day) | 1,884 (1,762.5 - 2,314.5) | 2,122.5 (1,664 - 2,276) | 0.4020 |
Protein by app (g/day) | 69.35 (63.25 - 82.3) | 70 (59.78 - 83.98) | 0.9753 |
Protein by dietician (g/day) | 71.05 (66.1 - 80.55) | 69.05 (59.5 - 90.38) | 0.7662 |
Lipid by app (g/day) | 75.8 (65.15 - 96.25) | 73.55 (62.55 - 86.38) | 0.2067 |
Lipid by dietician (g/day) | 72.45 (63.03 - 85.3) | 72.85 (57.93 - 90.93) | 0.9736 |
Carbohydrate by app (g/day) | 238.1 (213.35 - 301.75) | 237.6 (209.68 - 277.35) | 0.1941 |
Carbohydrate by dietician (g/day) | 247.3 (199.73 - 297.95) | 240.9 (192.25 - 281.08) | 0.2295 |
Fiber by app (g/day) | 12 (9.4 - 19.3) | 13.35 (10.03 - 20.43) | 0.7346 |
Fiber by dietician (g/day) | 12.5 (10.08 - 18) | 13.6 (9.28 - 17.2) | 0.2174 |
Salt by app (g/day) | 11 (9.48 - 12.48) | 10.25 (8.4 - 14.48) | 0.9864 |
Salt by dietician (g/day) | 10.75 (9.48 - 11.68) | 10.65 (8.38 - 11.95) | 0.3303 |
Variable 1 | Variable 2 | RS | P |
---|---|---|---|
*A P value < 0.05 denotes the presence of a statistically significant difference. HbA1c: hemoglobin A1c; GA: glycated albumin; BMI: body mass index; DTSQ: diabetes treatment satisfaction questionnaire; PAID: problem areas in diabetes; app: application. | |||
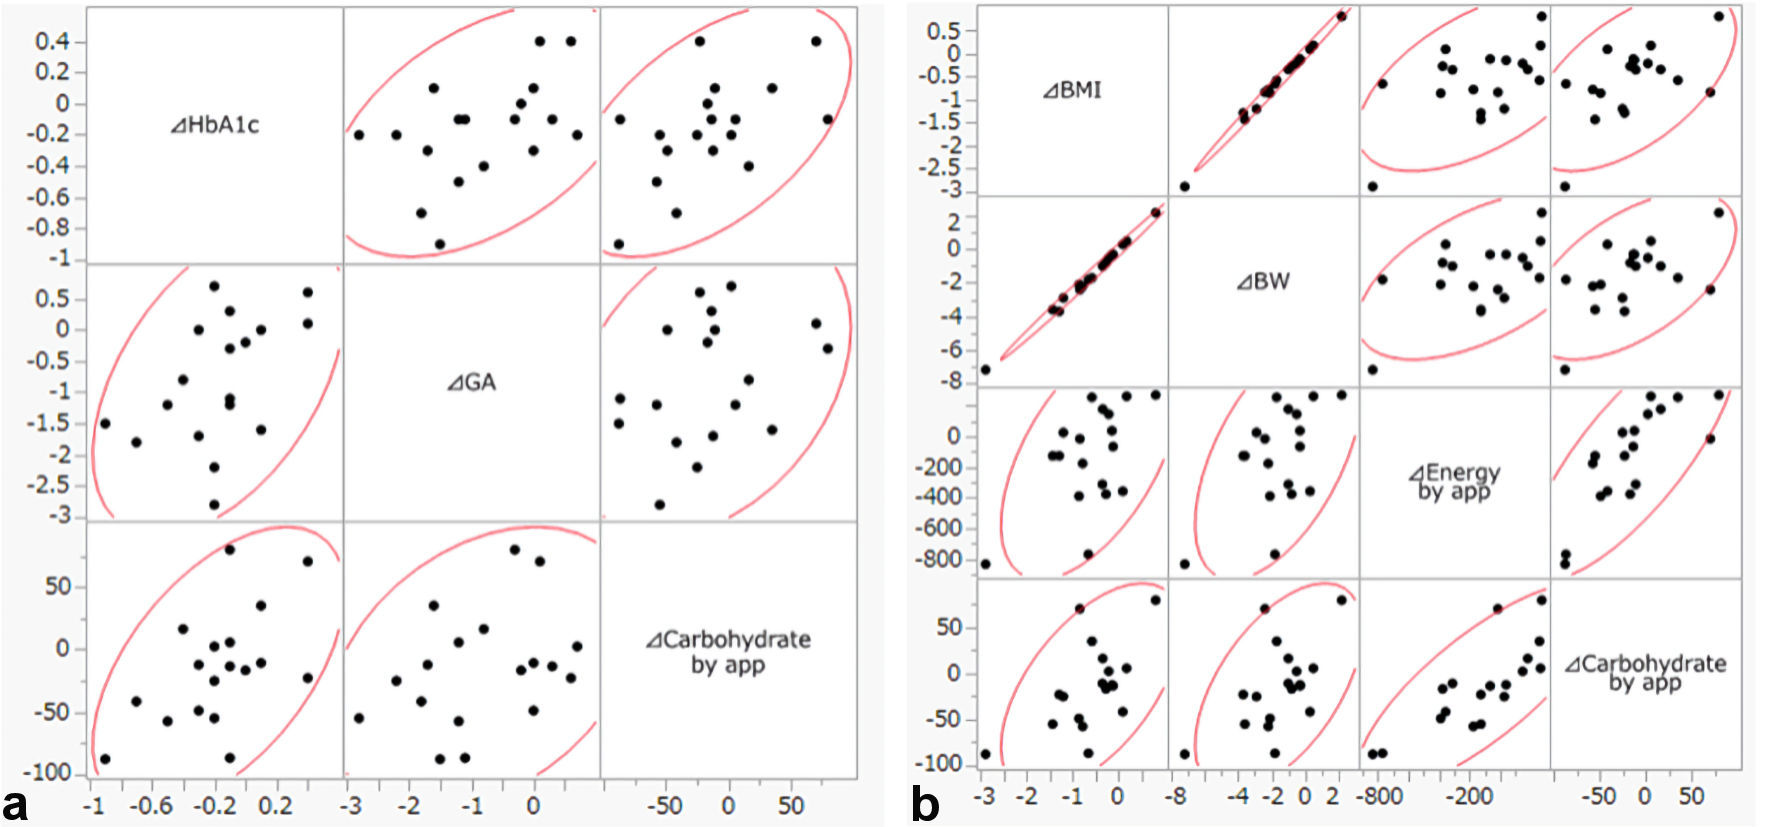
ΔHbA1c | Age | 0.3255 | 0.1874 |
Duration | -0.0600 | 0.8132 | |
Δbody weight | 0.0016 | 0.9951 | |
ΔBMI | 0.0354 | 0.8891 | |
ΔGA | 0.4779 | 0.0449* | |
Δenergy by app | 0.2297 | 0.3592 | |
Δprotein by app | -0.0818 | 0.7470 | |
Δlipidby app | -0.0198 | 0.9379 | |
Δcarbohydrate by app | 0.5018 | 0.0338* | |
Δenergy by dietician | 0.1478 | 0.5582 | |
Δprotein by dietician | 0.0026 | 0.9918 | |
Δlipid by dietician | 0.0541 | 0.8310 | |
Δcarbohydrate by dietician | 0.3915 | 0.1082 | |
ΔDTSQ | 0.1139 | 0.6527 | |
ΔPAID | 0.2075 | 0.4087 | |
ΔBMI | Age | 0.4078 | 0.0929 |
Duration | 0.3473 | 0.1579 | |
Δbody weight | 0.9907 | < 0.0001* | |
ΔHbA1c | 0.0354 | 0.8891 | |
ΔGA | 0.1281 | 0.6125 | |
Δenergy by app | 0.4894 | 0.0393* | |
Δprotein by app | 0.2623 | 0.2931 | |
Δlipidby app | 0.1785 | 0.4784 | |
Δcarbohydrate by app | 0.5542 | 0.0170* | |
Δenergy by dietician | 0.1187 | 0.6390 | |
Δprotein by dietician | -0.0774 | 0.7600 | |
Δlipid by dietician | 0.2157 | 0.0390 | |
Δcarbohydrate by dietician | 0.0506 | 0.8421 | |
ΔDTSQ | -0.3559 | 0.1472 | |
ΔPAID | -0.1592 | 0.5281 |