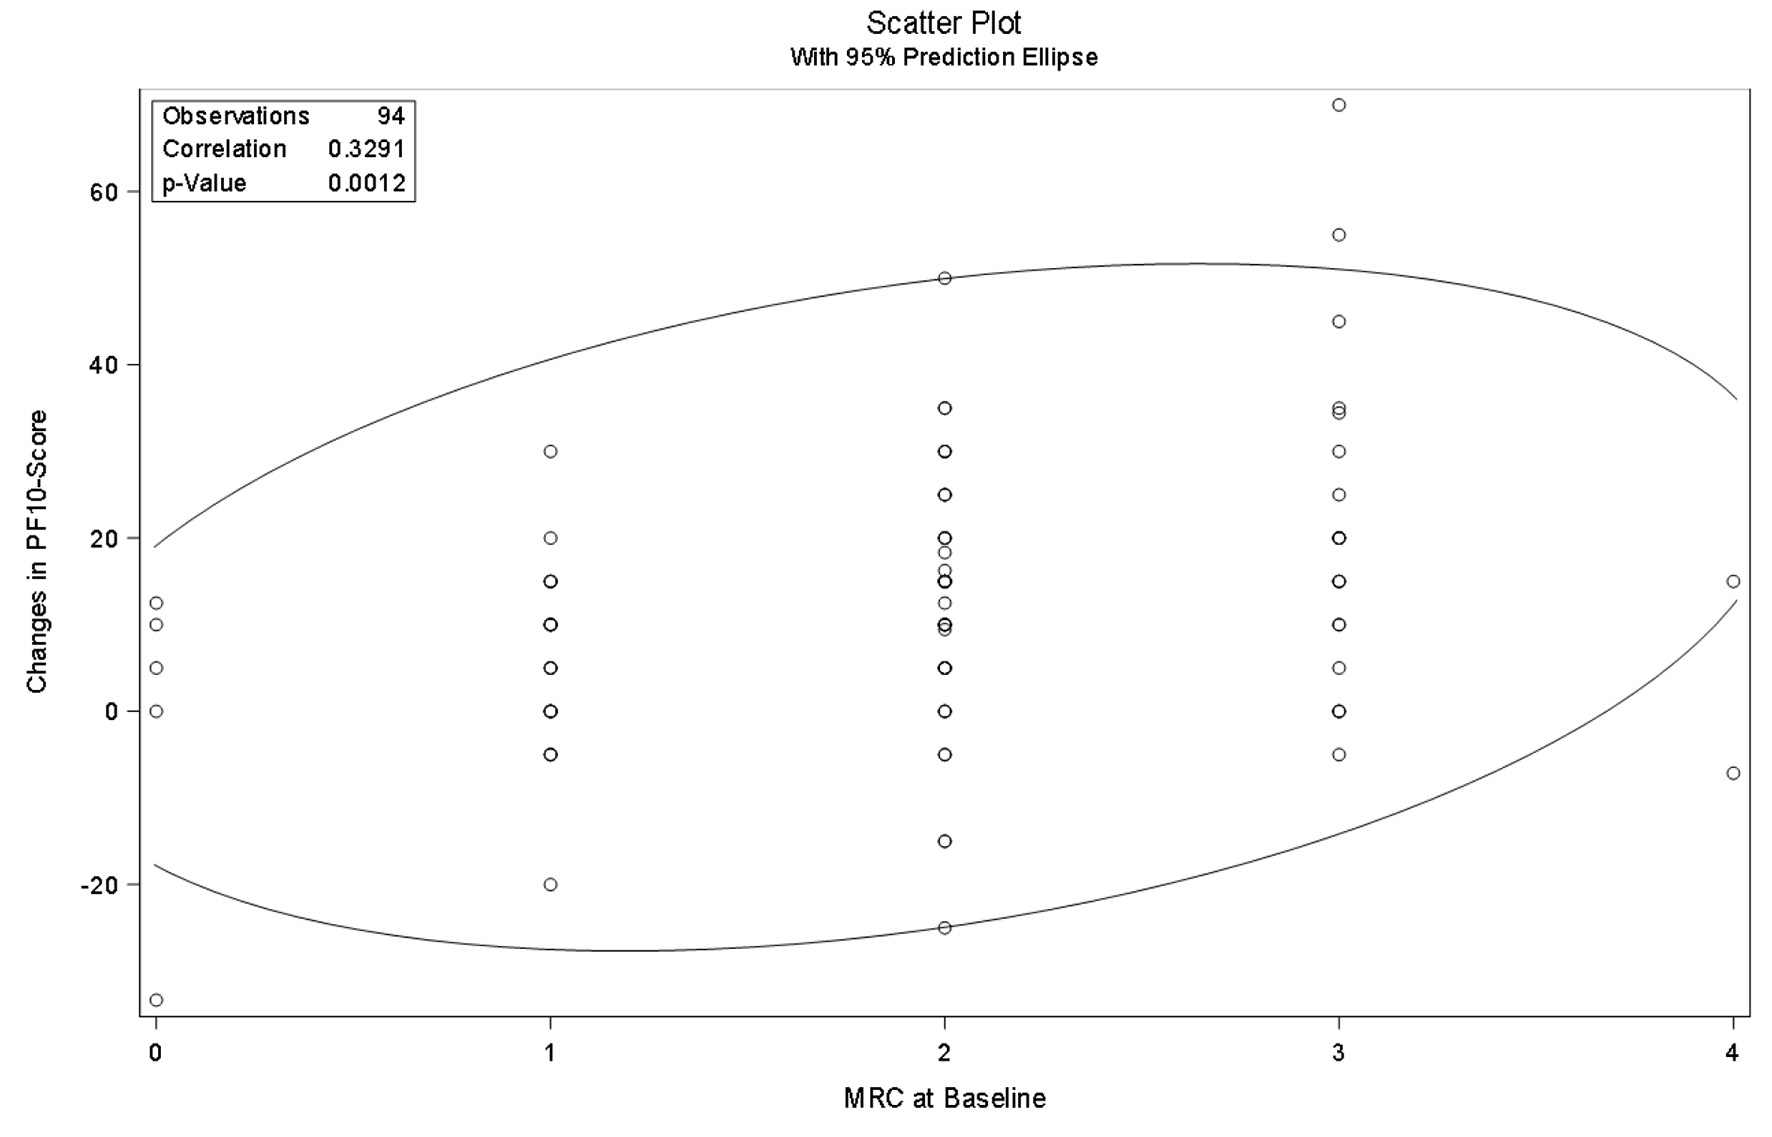
Figure 1. Pearson correlation analysis of change in PF-10 and mMRC in Switzerland. PF-10: 10-question physical functioning questionnaire; mMRC: modified Medical Research Council questionnaire.
| Journal of Clinical Medicine Research, ISSN 1918-3003 print, 1918-3011 online, Open Access |
| Article copyright, the authors; Journal compilation copyright, J Clin Med Res and Elmer Press Inc |
| Journal website https://www.jocmr.org |
Original Article
Volume 13, Number 7, July 2021, pages 392-402
Swiss Experience in Therapy With Dual Bronchodilation in Chronic Obstructive Pulmonary Disease in Relation to Self-Reported Physical Functionality
Figures
Tables
| Demographic data and baseline characteristics | Switzerland, N (%) | Other countries, N (%) | Total, N (%) | P-value |
|---|---|---|---|---|
| COPD: chronic obstructive pulmonary disease; SD: standard deviation; mMRC: modified Medical Research Council questionnaire; Nmiss: number missings. | ||||
| Number of patients | 94 (100.00) | 7,514 (100.00) | 7,608 (100.00) | |
| Age at registration (years) | < 0.0001 | |||
| N | 94 | 7,514 | 7,608 | |
| Mean | 69.91 | 65.30 | 65.36 | |
| SD | 10.07 | 9.33 | 9.35 | |
| Min | 44.00 | 40.00 | 40.00 | |
| Median | 71.00 | 66.00 | 66.00 | |
| Max | 92.00 | 95.00 | 95.00 | |
| Nmiss | 0 | 0 | 0 | |
| Age at registration (categorical) | < 0.0001 | |||
| < 65 years | 23 (24.47) | 3,426 (45.59) | 3,449 (45.33) | |
| ≥ 65 years | 71 (75.53) | 4,088 (54.41) | 4,159 (54.67) | |
| Gender | 0.03 | |||
| Male | 54 (57.45) | 5,121 (68.15) | 5,175 (68.02) | |
| Female | 40 (42.55) | 2,393 (31.85) | 2,433 (31.98) | |
| Duration between initial diagnosis of COPD and baseline visit (years) | 0.03 | |||
| N | 94 | 7,514 | 7,608 | |
| Mean | 5.63 | 4.91 | 4.92 | |
| SD | 5.41 | 5.87 | 5.86 | |
| Min | 0.00 | 0.00 | 0.00 | |
| Median | 4.00 | 3.00 | 3.00 | |
| Max | 26.00 | 72.00 | 72.00 | |
| Nmiss | 0 | 0 | 0 | |
| COPD degree of severity (spirometric) | 0.00 | |||
| 1 | 5 (5.32) | 152 (2.02) | 157 (2.06) | |
| 2 | 57 (60.64) | 3,420 (45.52) | 3,477 (45.70) | |
| 3 | 29 (30.85) | 3,100 (41.26) | 3,129 (41.13) | |
| 4 | 2 (2.13) | 752 (10.01) | 754 (9.91) | |
| No previous findings | 1 (1.06) | 90 (1.20) | 91 (1.20) | |
| mMRC questionnaire | 0.41 | |||
| Grade 0 | 5 (5.32) | 246 (3.27) | 251 (3.30) | |
| Grade 1 | 23 (24.47) | 1,762 (23.45) | 1,785 (23.46) | |
| Grade 2 | 43 (45.74) | 3,167 (42.15) | 3,210 (42.19) | |
| Grade 3 | 21 (22.34) | 1,903 (25.33) | 1,924 (25.29) | |
| Grade 4 | 2 (2.13) | 436 (5.80) | 438 (5.76) | |
| GOLD Group | 0.91 | |||
| A | 20 (21.28) | 1,479 (19.68) | 1,499 (19.70) | |
| B | 39 (41.49) | 3,214 (42.77) | 3,253 (42.76) | |
| C | 8 (8.51) | 529 (7.04) | 537 (7.06) | |
| D | 27 (28.72) | 2,292 (30.50) | 2,319 (30.48) | |
| Patients with concomitant diseases | < 0.0001 | |||
| No | 4 (4.26) | 2,126 (28.29) | 2,130 (28.00) | |
| Yes | 90 (95.74) | 5,388 (71.71) | 5,478 (72.00) | |
| Patients with concomitant medication (except respiratory therapeutics) | < 0.0001 | |||
| No | 16 (17.02) | 3,008 (40.03) | 3,024 (39.75) | |
| Yes | 78 (82.98) | 4,506 (59.97) | 4,584 (60.25) | |
| Smoking status | 0.60 | |||
| Smoker | 37 (39.36) | 3,025 (40.26) | 3,062 (40.25) | |
| Ex-smoker | 47 (50.00) | 3,454 (45.97) | 3,501 (46.02) | |
| Non-smoker | 10 (10.64) | 1,035 (13.77) | 1,045 (13.74) | |
| Pack-years | 0.01 | |||
| N | 84 | 6479 | 6563 | |
| Mean | 37.93 | 35.37 | 35.41 | |
| SD | 14.19 | 20.03 | 19.97 | |
| Min | 5.00 | 0.00 | 0.00 | |
| Median | 40.00 | 32.00 | 32.00 | |
| Max | 70.00 | 292.00 | 292.00 | |
| Nmiss | 10 | 1,035 | 1,045 | |
| Patients with exacerbations in the last 12 months prior to study | 0.83 | |||
| Yes | 60 (63.83) | 4,874 (64.87) | 4,934 (64.85) | |
| No | 34 (36.17) | 2,640 (35.13) | 2,674 (35.15) | |
| Number of exacerbations in the last 12 months prior to study | 0.55 | |||
| N | 94 | 7,514 | 7,608 | |
| Mean | 1.17 | 1.08 | 1.08 | |
| SD | 1.18 | 1.10 | 1.10 | |
| Min | 0.00 | 0.00 | 0.00 | |
| Median | 1.00 | 1.00 | 1.00 | |
| Max | 5.00 | 12.00 | 12.00 | |
| Nmiss | 0 | 0 | 0 | |
| Demographic data and baseline characteristics | Responder | Non-responder | Responder vs. non-responder in Switzerland, P-value | Responder vs. non-responder in other countries, P-value | ||||
|---|---|---|---|---|---|---|---|---|
| Switzerland, N (%) | Other countries, N (%) | P-value | Switzerland, N (%) | Other countries, N (%) | P-value | |||
| *Chi-Square might not be valid, test changed to Fishers exact test. COPD: chronic obstructive pulmonary disease; mMRC: modified Medical Research Council questionnaire. | ||||||||
| Number of patients | 59 (100.00) | 5,031 (100.00) | 35 (100.00) | 2,483 (100.00) | ||||
| Age at registration (categorical) | 0.00 | 0.01 | 0.78 | 0.81 | ||||
| < 65 years | 15 (25.42) | 2,290 (45.52) | 8 (22.86) | 1,136 (45.75) | ||||
| ≥ 65 years | 44 (74.58) | 2,741 (54.48) | 27 (77.14) | 1,347 (54.25) | ||||
| COPD degree of severity (spirometric) | 0.02 | 0.03* | 0.46* | < 0.0001 | ||||
| 1 | 2 (3.39) | 91 (1.81) | 3 (8.57) | 61 (2.46) | ||||
| 2 | 36 (61.02) | 2,156 (42.85) | 21 (60.00) | 1,264 (50.91) | ||||
| 3 | 20 (33.90) | 2,179 (43.31) | 9 (25.71) | 921 (37.09) | ||||
| 4 | 1 (1.69) | 533 (10.59) | 1 (2.86) | 219 (8.82) | ||||
| No previous findings | 0 (0.00) | 72 (1.43) | 1 (2.86) | 18 (0.72) | ||||
| mMRC questionnaire | 0.34 | 0.99 | 0.19* | < 0.0001 | ||||
| Grade 0 | 2 (3.39) | 73 (1.45) | 3 (8.57) | 173 (6.97) | ||||
| Grade 1 | 11 (18.64) | 931 (18.51) | 12 (34.29) | 831 (33.47) | ||||
| Grade 2 | 29 (49.15) | 2,177 (43.27) | 14 (40.00) | 990 (39.87) | ||||
| Grade 3 | 16 (27.12) | 1,495 (29.72) | 5 (14.29) | 408 (16.43) | ||||
| Grade 4 | 1 (1.69) | 355 (7.06) | 1 (2.86) | 81 (3.26) | ||||
| GOLD Group | 0.89 | 0.64 | 0.05 | < 0.0001 | ||||
| A | 10 (16.95) | 708 (14.07) | 10 (28.57) | 771 (31.05) | ||||
| B | 24 (40.68) | 2,238 (44.48) | 15 (42.86) | 976 (39.31) | ||||
| C | 3 (5.08) | 296 (5.88) | 5 (14.29) | 233 (9.38) | ||||
| D | 22 (37.29) | 1,789 (35.56) | 5 (14.29) | 503 (20.26) | ||||
| Patients with concomitant diseases | < 0.0001 | 0.00 | 0.63* | 0.37 | ||||
| No | 2 (3.39) | 1,407 (27.97) | 2 (5.71) | 719 (28.96) | ||||
| Yes | 57 (96.61) | 3,624 (72.03) | 33 (94.29) | 1,764 (71.04) | ||||
| Smoking status | 0.62 | 0.89 | 0.81 | < 0.0001 | ||||
| Smoker | 22 (37.29) | 2,012 (39.99) | 15 (42.86) | 1,013 (40.80) | ||||
| Ex-smoker | 30 (50.85) | 2,259 (44.90) | 17 (48.57) | 1,195 (48.13) | ||||
| Non-smoker | 7 (11.86) | 760 (15.11) | 3 (8.57) | 275 (11.08) | ||||
| Patients with exacerbations in the last 12 months prior to study | 0.30 | 0.30 | 0.46 | < 0.0001 | ||||
| Yes | 36 (61.02) | 3,388 (67.34) | . | 24 (68.57) | 1,486 (59.85) | |||
| No | 23 (38.98) | 1,643 (32.66) | . | 11 (31.43) | 997 (40.15) | |||
| Changes in PF-10 score | mMRC | Number of exacerbations |
|---|---|---|
| PF-10: 10-question physical functioning questionnaire; mMRC: modified Medical Research Council questionnaire. | ||
| Nothing | ||
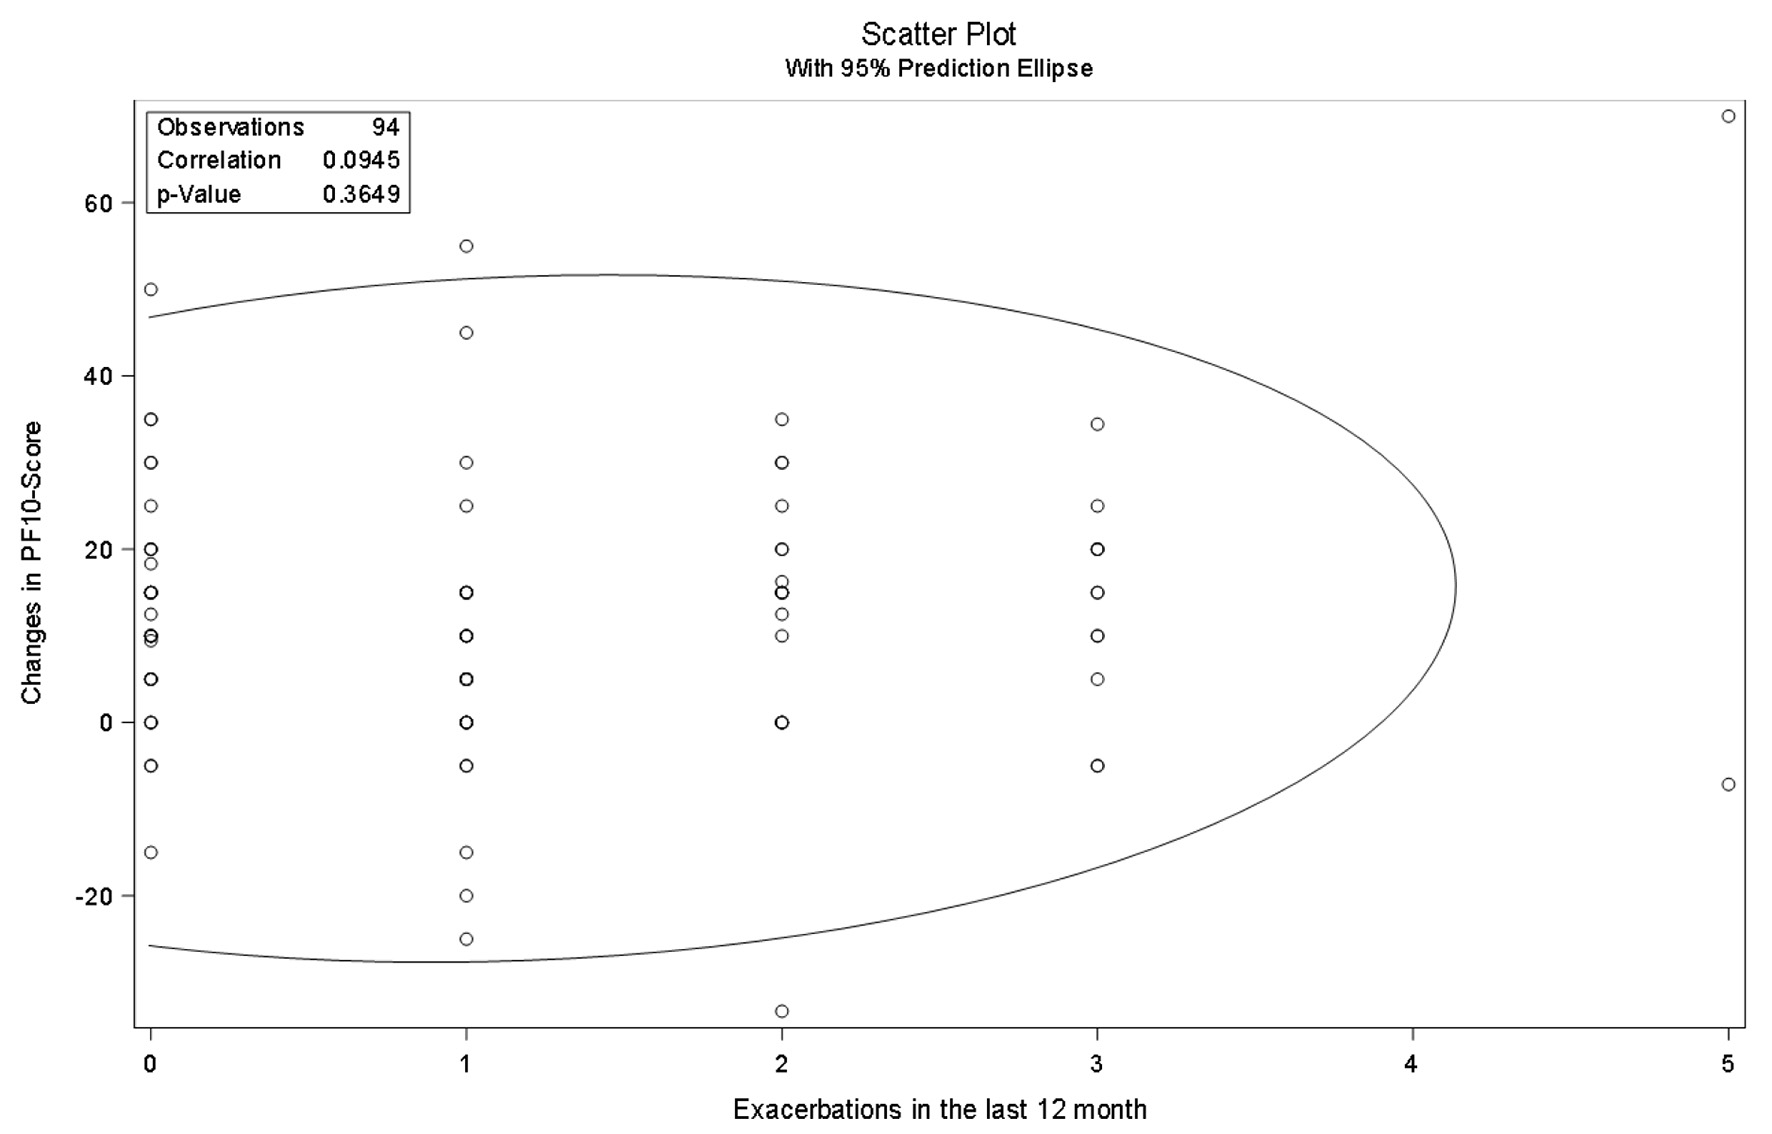
| Correlation coefficient | 0.33 | 0.0945 |
| P-value | 0.00 | 0.3649 |
| Age (< 65 vs. ≥ 65) | ||
| Correlation coefficient | 0.35 | 0.0948 |
| P-value | 0.00 | 0.3660 |
| Concomitant disease (yes vs. no) | ||
| Correlation coefficient | 0.33 | 0.0931 |
| P-value | 0.00 | 0.3748 |
| Age (< 65 vs. ≥ 65) and concomitant disease (yes vs. no) | ||
| Correlation coefficient | 0.35 | 0.0937 |
| P-value | 0.00 | 0.3744 |
| Changes in PF-10 score | mMRC | Number of exacerbations |
|---|---|---|
| PF-10: 10-question physical functioning questionnaire; mMRC: modified Medical Research Council questionnaire. | ||
| Nothing | ||
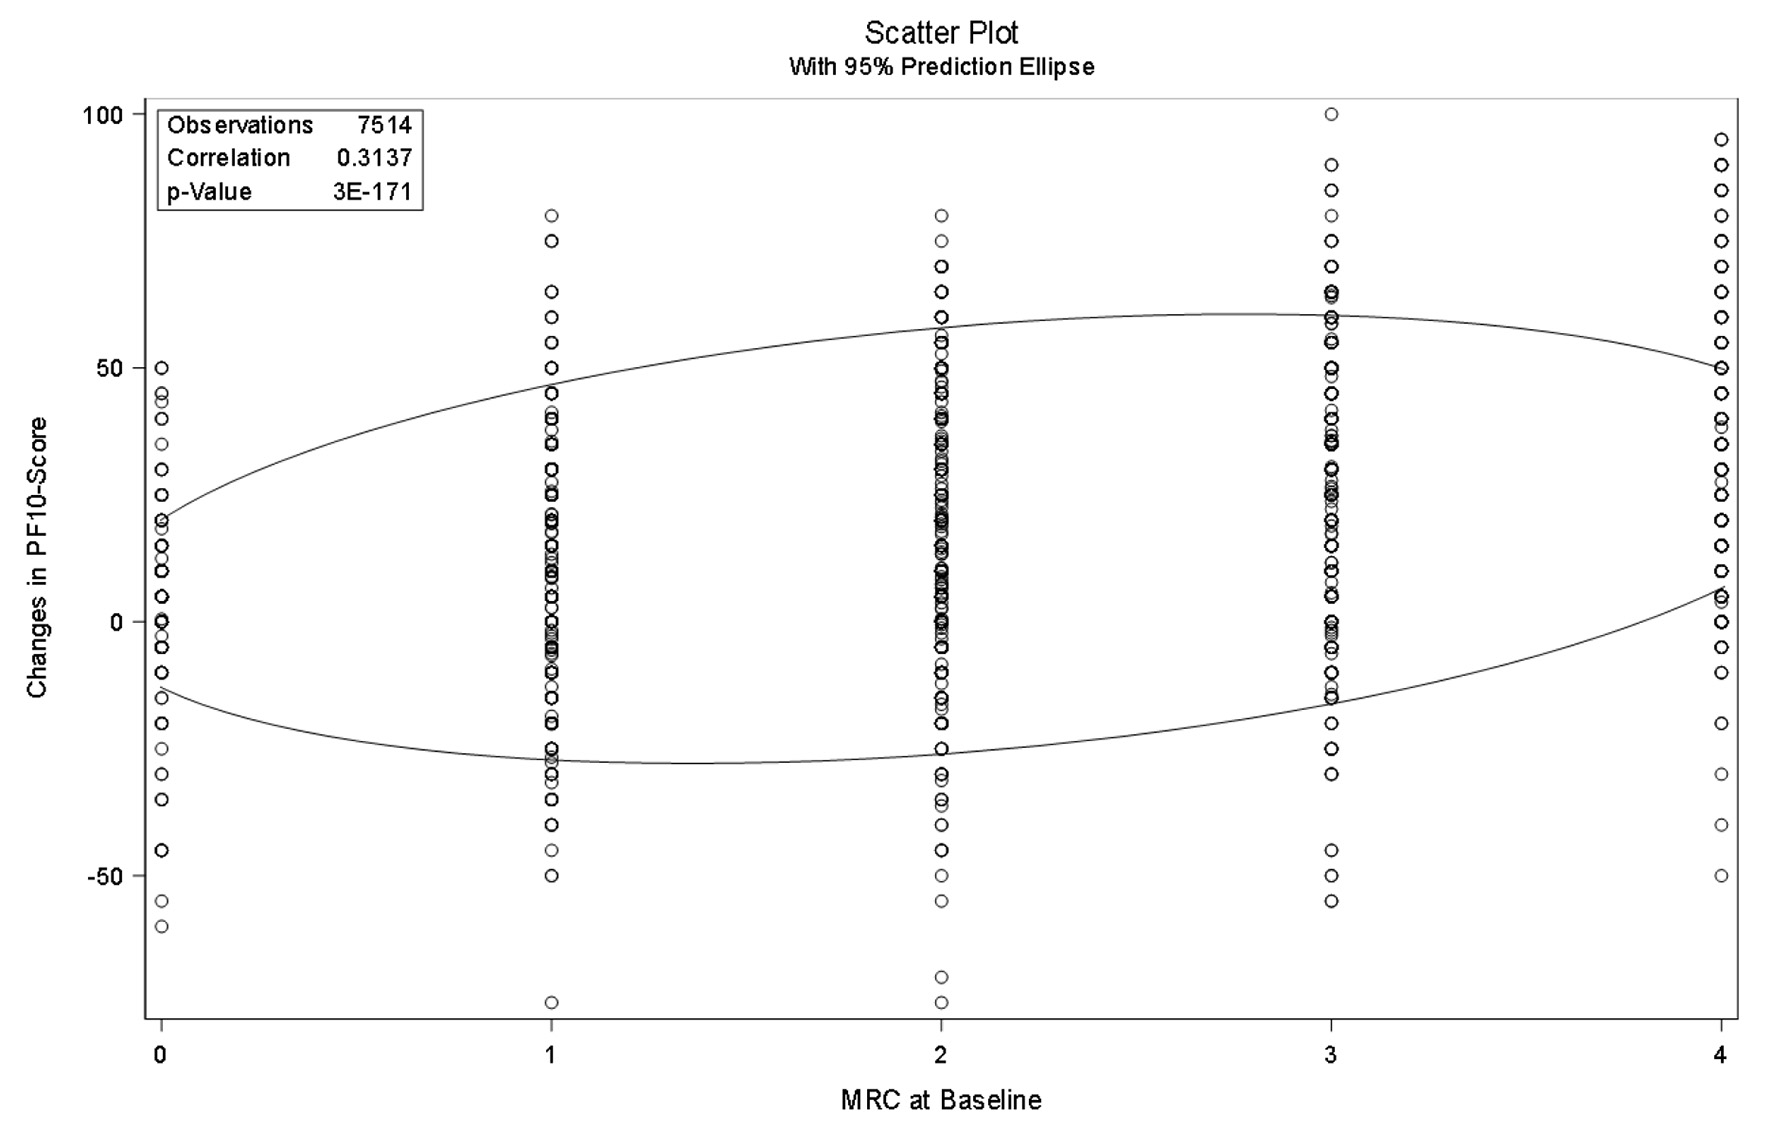
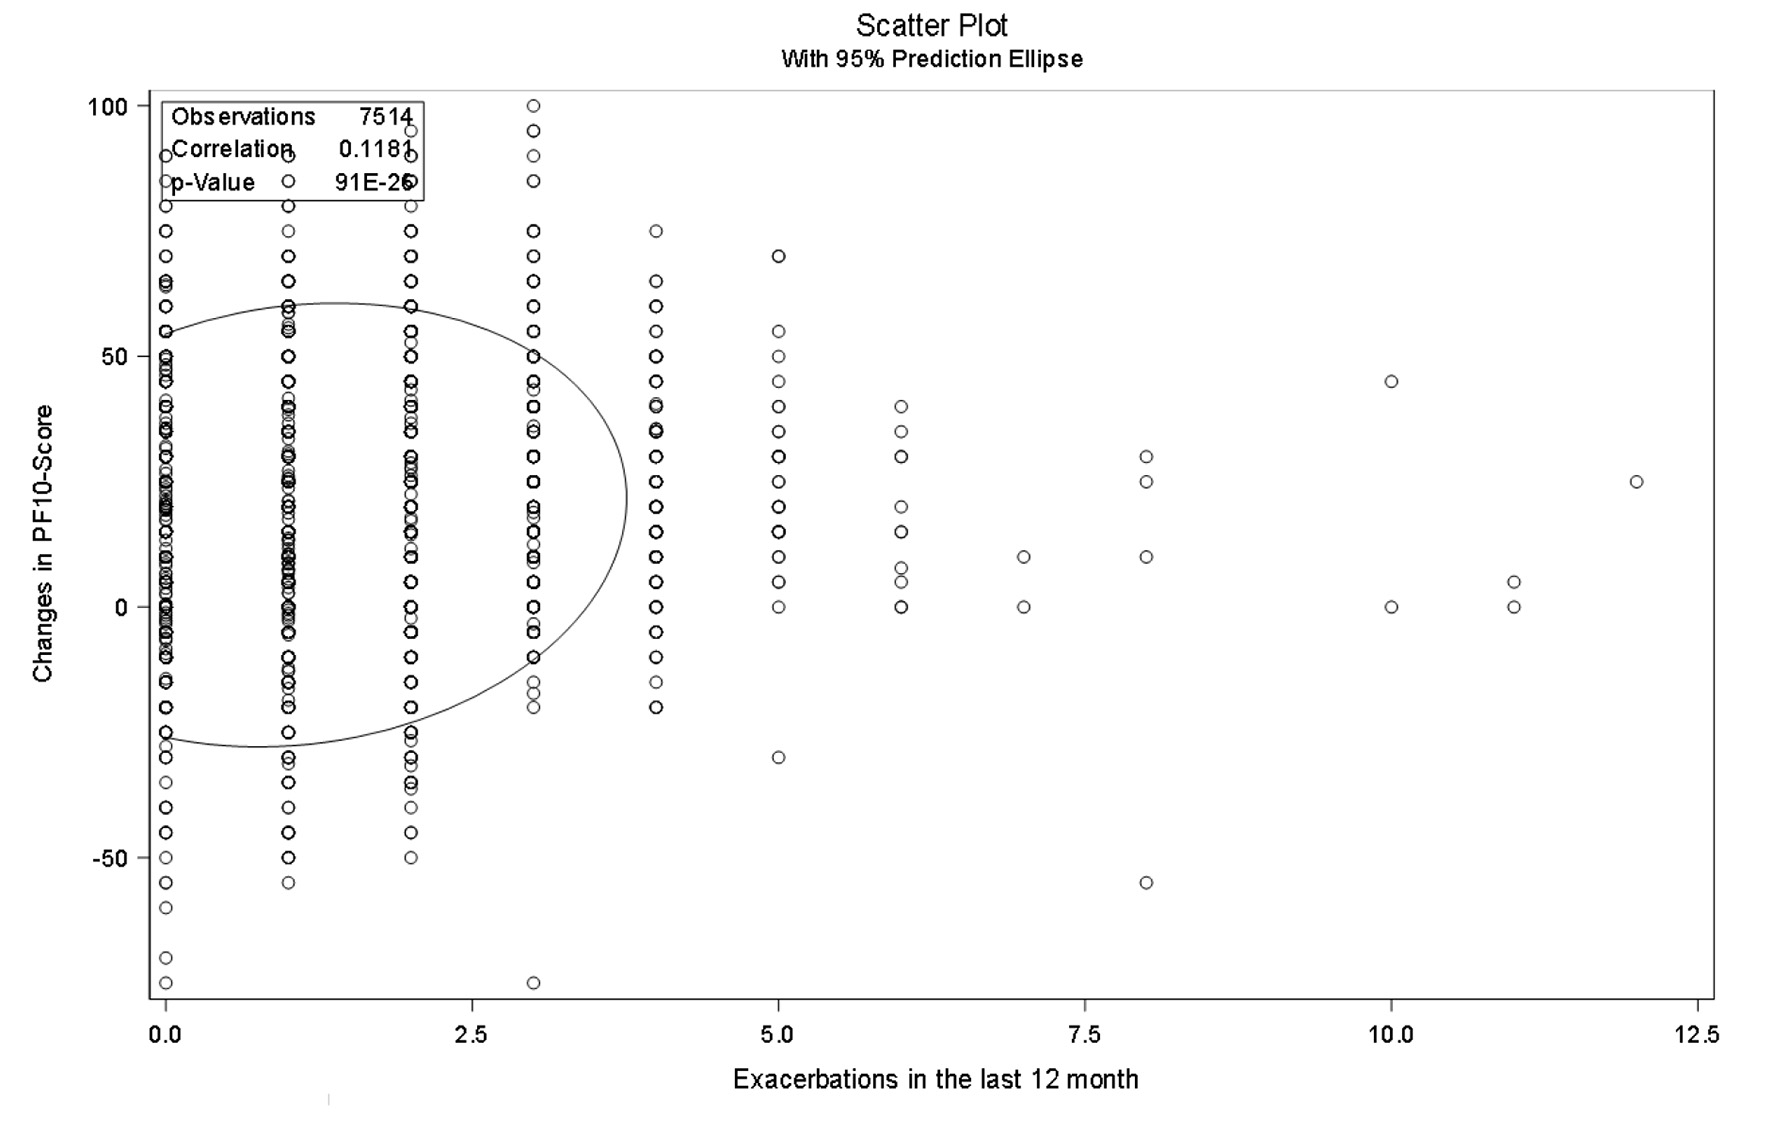
| Correlation coefficient | 0.31 | 0.1181 |
| P-value | < 0.00 | < 0.0001 |
| Age (< 65 vs. ≥ 65) | ||
| Correlation coefficient | 0.32 | 0.1183 |
| P-value | < 0.00 | < 0.0001 |
| Concomitant disease (yes vs. no) | ||
| Correlation coefficient | 0.32 | 0.1193 |
| P-value | < 0.00 | < 0.0001 |
| Age (< 65 vs. ≥ 65) and concomitant disease (yes vs. no) | ||
| Correlation coefficient | 0.32 | 0.1197 |
| P-value | < 0.00 | < 0.0001 |