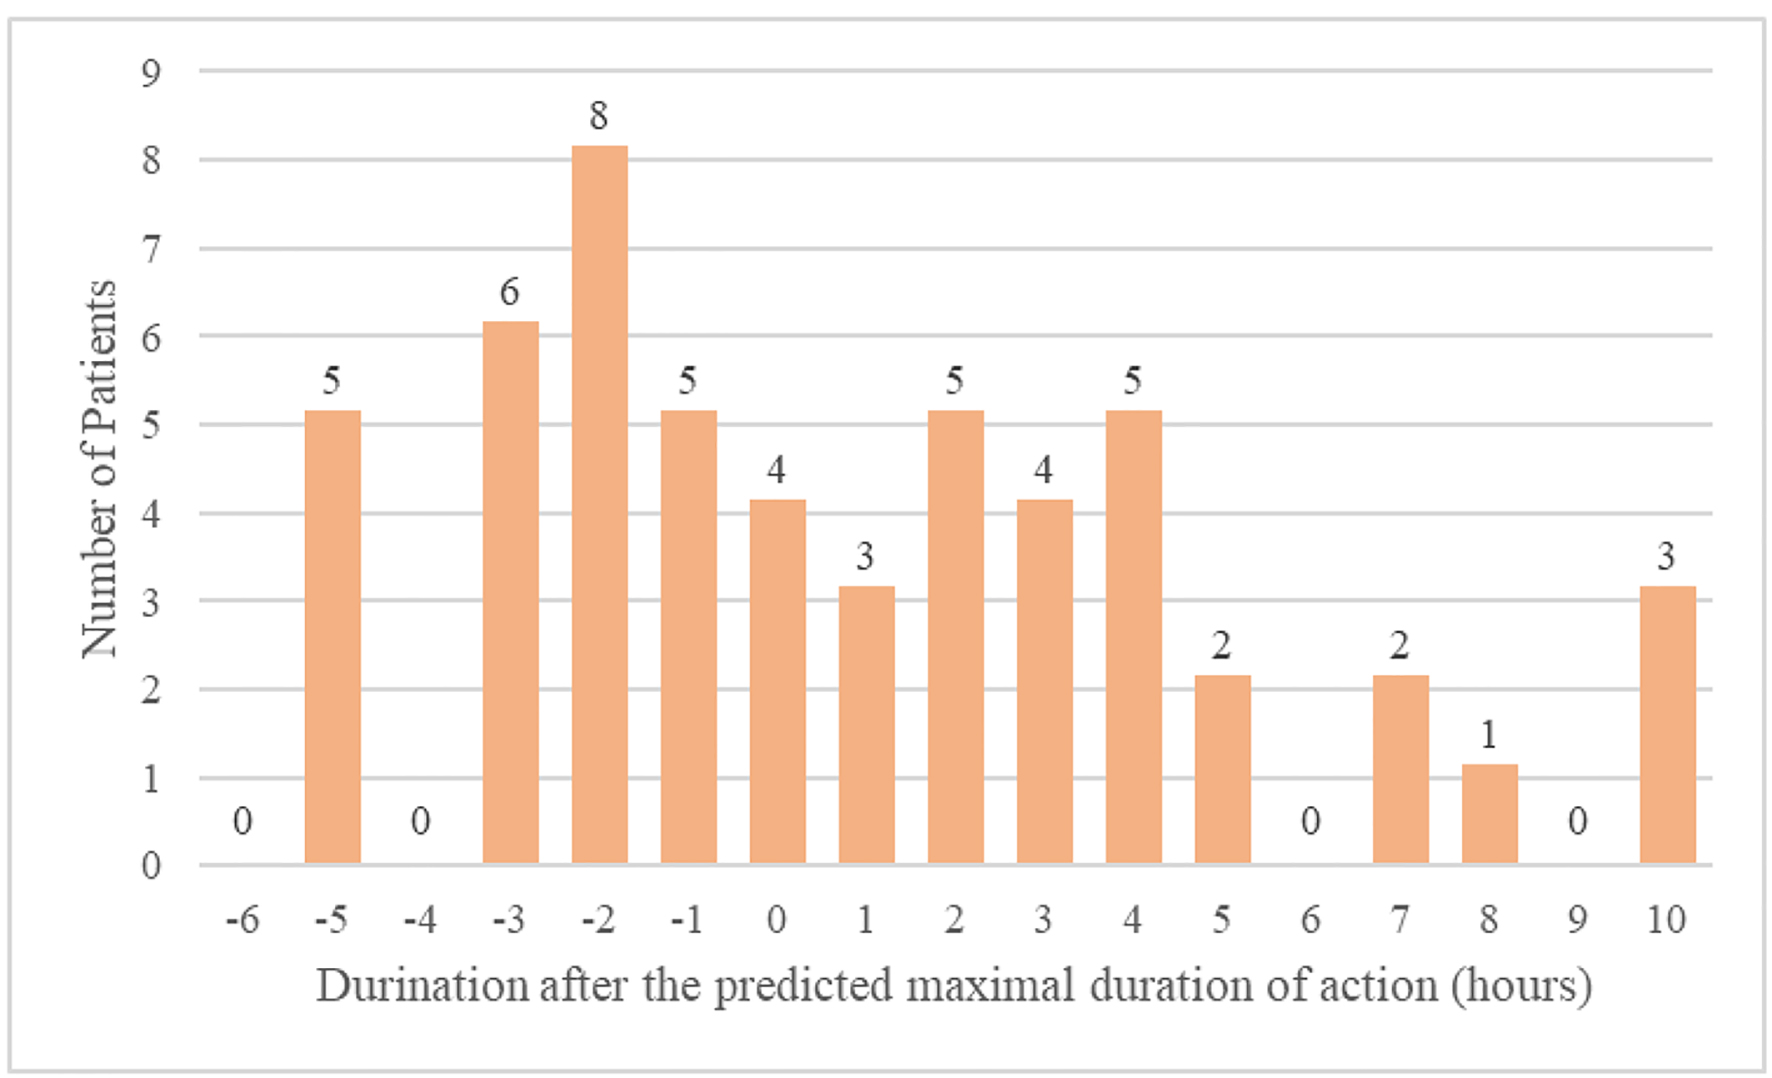
Figure 1. Difference between predicted duration of action and timing of oversedation.
| Journal of Clinical Medicine Research, ISSN 1918-3003 print, 1918-3011 online, Open Access |
| Article copyright, the authors; Journal compilation copyright, J Clin Med Res and Elmer Press Inc |
| Journal website https://www.jocmr.org |
Original Article
Volume 13, Number 5, May 2021, pages 304-308
Timing of Oversedation Events Following Opiate Administration in Hospitalized Patients
Figure
Tables
| Oversedation event after the predicted maximal duration of action | P value* | |||
|---|---|---|---|---|
| No (n = 28) | Yes (n = 25) | Total (n = 53) | ||
| *P values from t-tests for continuous variables and from Chi-squared or Fisher exact tests for categorical variables. BMI: body mass index. | ||||
| Age (mean (SD)), years | 59.14 (15.08) | 59.4 (14.12) | 59.26 (14.49) | 0.949 |
| BMI (mean (SD)) | 29.17 (8.28) | 30.4 (11.46) | 29.7 (9.83) | 0.652 |
| Gender, N (%) | ||||
| Female | 20 (71.4) | 24 (96) | 44 (83) | |
| Male | 8 (28.6) | 1 (4) | 8 (17) | |
| Renal insufficiency | ||||
| No | 20 (71.4) | 17 (68) | 37 (69.8) | 0.786 |
| Yes | 8 (28.6) | 8 (32) | 16 (30.2) | |
| Liver disease | ||||
| No | 20 (71.4) | 21 (84) | 41 (77.4) | 0.275 |
| Yes | 8 (28.6) | 4 (16) | 12 (22.6) | |
| Opioid naive | ||||
| No | 22 (78.6) | 13 (52) | 35 (66) | 0.041 |
| Yes | 6 (21.4) | 12 (48) | 18 (34) | |
| Surgery within 24 h | ||||
| No | 24 (88.9) | 19 (76) | 43 (82.7) | 0.284 |
| Yes | 3 (11.1) | 6 (24) | 9 (17.3) | |
| Sleep apnea | ||||
| No | 23 (82.1) | 23 (92) | 46 (86.8) | 0.426 |
| Yes | 5 (17.9) | 2 (8) | 7 (13.2) | |
| Chronic obstructive lung disease | ||||
| No | 22 (78.6) | 20 (80) | 42 (79.2) | 0.898 |
| Yes | 6 (21.4) | 5 (20) | 11 (20.8) | |
| Smoker | ||||
| No | 19 (67.9) | 17 (68) | 36 (67.9) | 0.58 |
| Yes | 7 (25) | 4 (16) | 11 (20.8) | |
| Ex-smokers | 2 (7.1) | 4 (16) | 6 (11.3) | |
| Lung transplant | ||||
| No | 28 (100) | 22 (95.7) | 50 (98) | 0.451 |
| Yes | 0 | 1 (4.3) | 1 (2) | |
| Mean OS after maximal duration of action (95% CI) | Mean difference (95% CI); P-value | ||
|---|---|---|---|
| No | Yes | ||
| *Linear regression model adjusted for patient’s age, sex, BMI and comorbidities listed in Table 1. OS: overall survival; CI: confidence interval. | |||
| Unadjusted time after maximal duration of action, h | -2.60 (-3.44; -1.75) | 3.75 (2.85; 4.65) | 6.35 (5.11; 7.59); P < 0.001 |
| Adjusted time after maximal duration of action, h | -4.03 (-8.41; 0.36) | 2.25 (-2.16; 6.66) | 6.28 (4.73; 7.83); P < 0.001 |