Journal of Clinical Medicine Research, ISSN 1918-3003 print, 1918-3011 online, Open Access
Article copyright, the authors; Journal compilation copyright, J Clin Med Res and Elmer Press Inc
Journal website https://www.jocmr.org

Original Article

Volume 13, Number 5, May 2021, pages 293-303


Human Leukocyte Antigen-DR Isotype Expression in Monocytes and T Cells Interferon-Gamma Release Assay in Septic Patients and Correlation With Clinical Outcome

Figures

Figure 1.
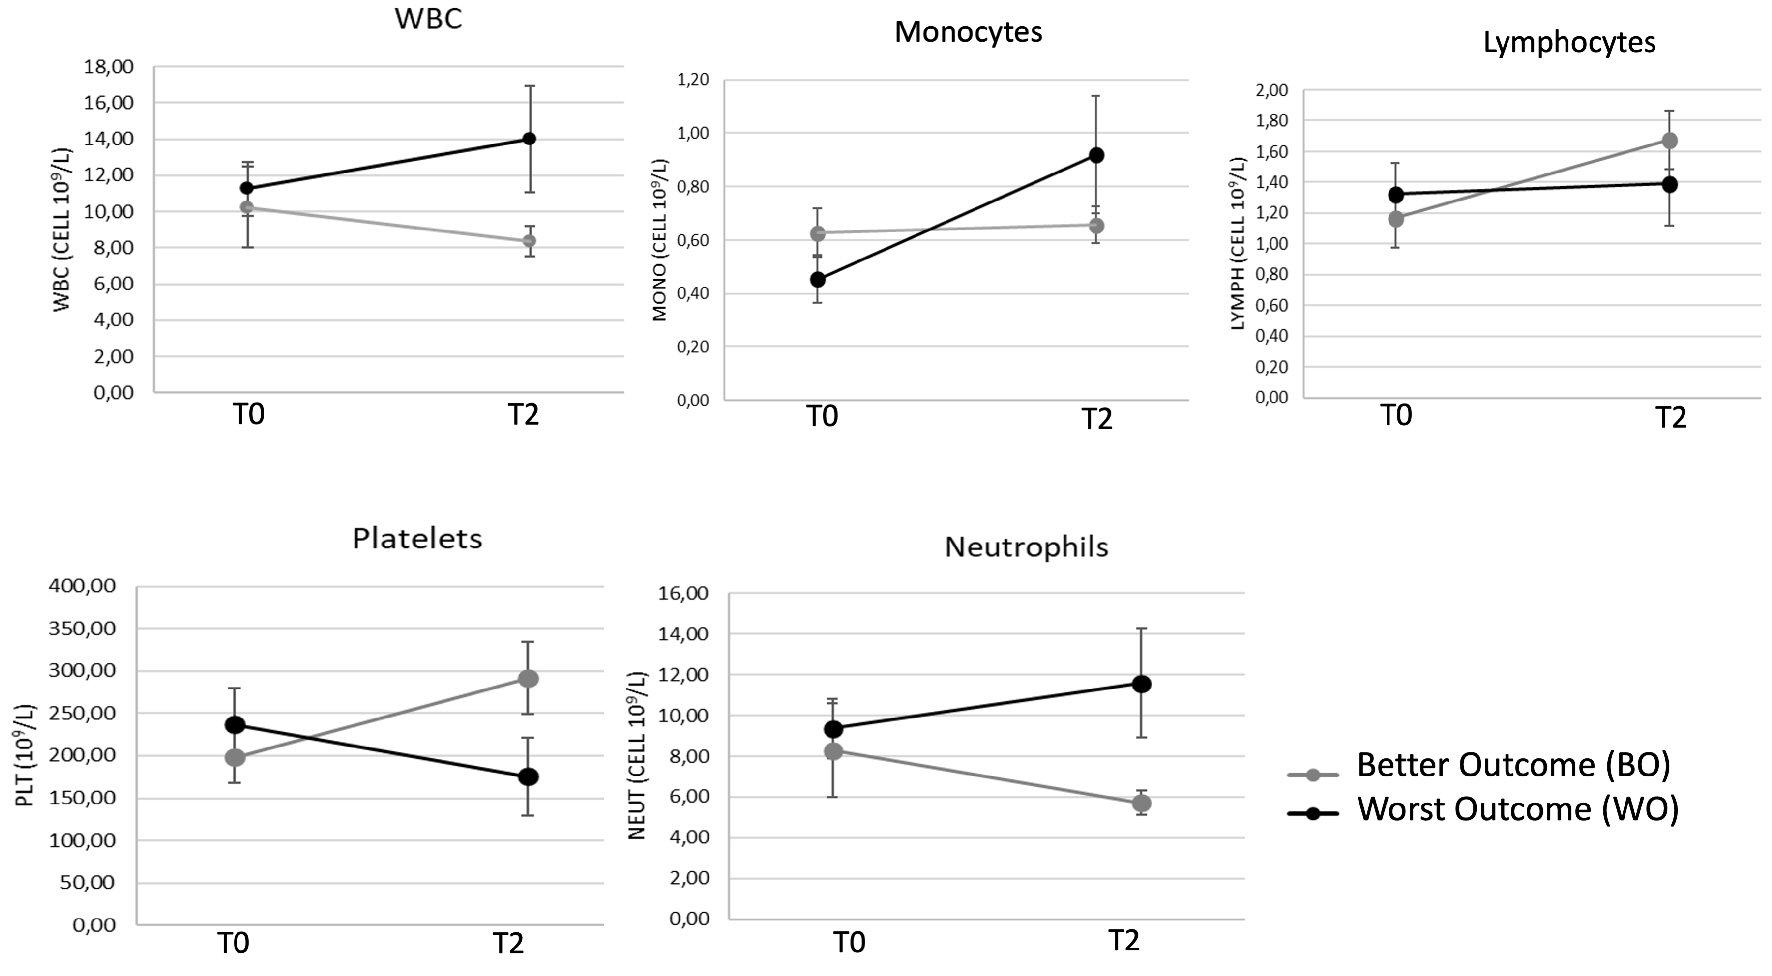
Figure 1. Hematological parameters of 39 patients with confirmed sepsis (BC+) after 1-week hospitalization. White blood cells (WBC), monocytes, lymphocytes, neutrophils and platelets (PLT) count were monitored at admission (time 0, T0) and after 1 week from diagnosis (time 2, T2). Patients were sub-grouped in better outcome (BO) and worst outcome (WO) according to clinical severity. Data are presented as mean ± SEM. Statistical analysis: unpaired Student’s t-test of WO vs. BO values. SEM: standard error of the mean.
Figure 2.
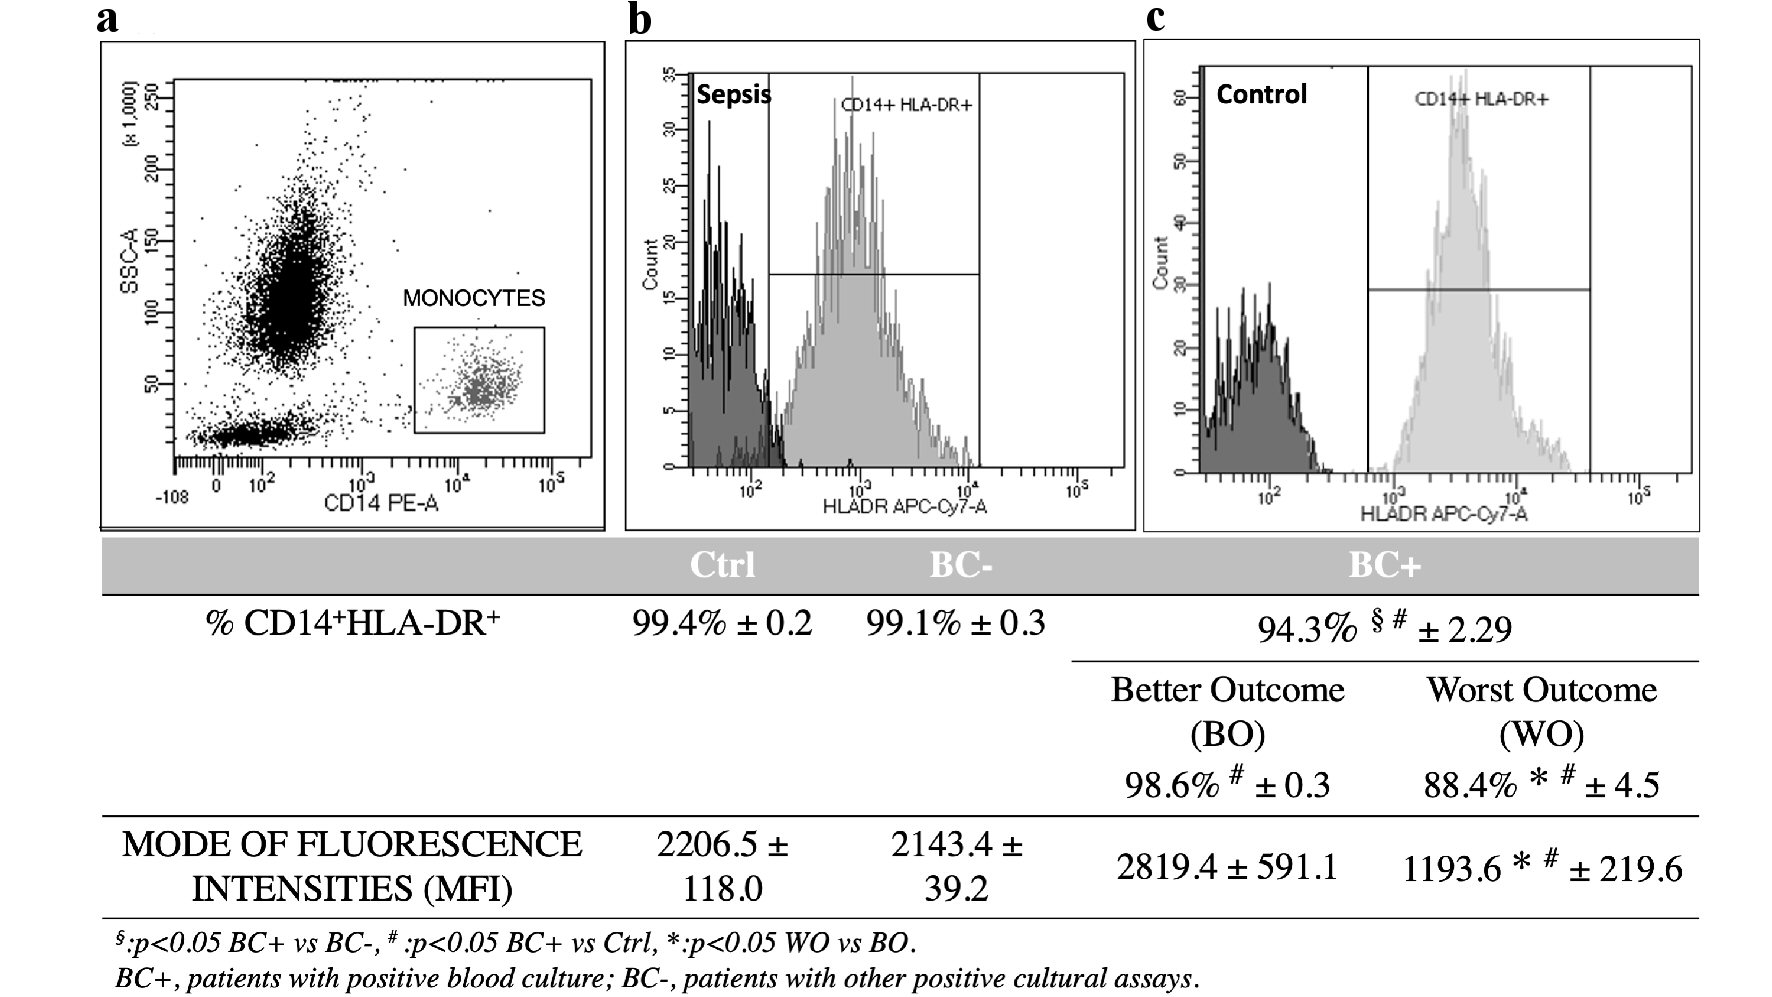
Figure 2. HLA-DR monocytes surface expression in BC+, BC- and control (Ctrl) patients (total n = 55). (a) Flow cytometrical analysis of monocytes gated on scatter plot of CD14-PE vs. side scattered light signals (SSC). (b, c) Histogram plot of HLA-DR-APC-Cy7 among CD14+ gated monocytes. Values of HLA-DR expression percentage and mode of fluorescence intensity are indicated below graphs for different groups of patients and controls. Data are presented as mean ± SEM. Statistical analysis: unpaired Student’s t-test of BC+ vs. BC- values (§P < 0.05); BC+ vs. Ctrl values (#P < 0.05); WO vs. BO values (*P < 0.05). HLA-DR: human leukocyte antigen-DR isotype; BC+: patients with positive blood culture; BC-: patients with other positive cultural assays; WO: patients with worst clinical outcome; BO: patients with better clinical outcome.
Figure 3.
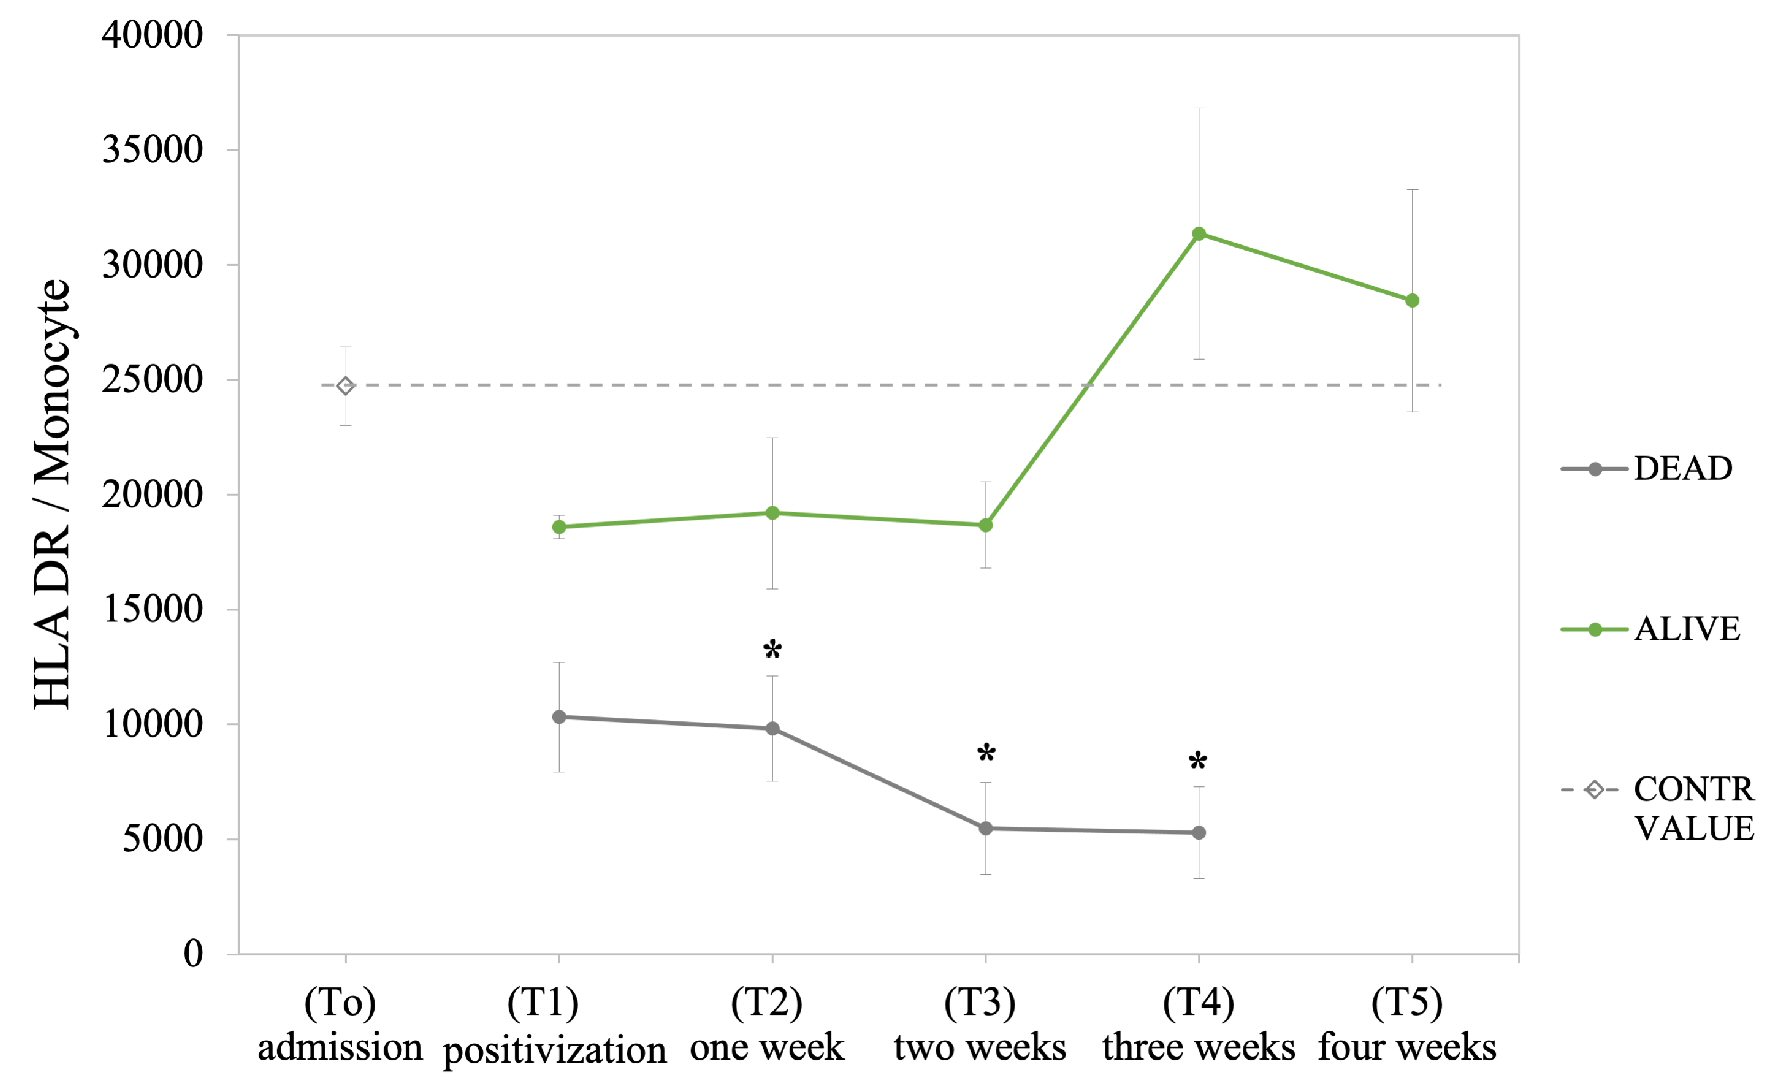
Figure 3. Quantification of HLA-DR per monocyte in the sub-group of 16 hospitalized septic patients (sBC+) monitored for 4 weeks following septic diagnosis. Patients were classified according to clinical outcome (alive and dead patients); the dashed line indicates value obtained for healthy individuals. Data are presented as mean ± SEM. Statistical analysis: unpaired Student’s t-test of dead vs. alive values (*P ≤ 0.05). HLA-DR: human leukocyte antigen-DR isotype; SEM: standard error of the mean.
Figure 4.
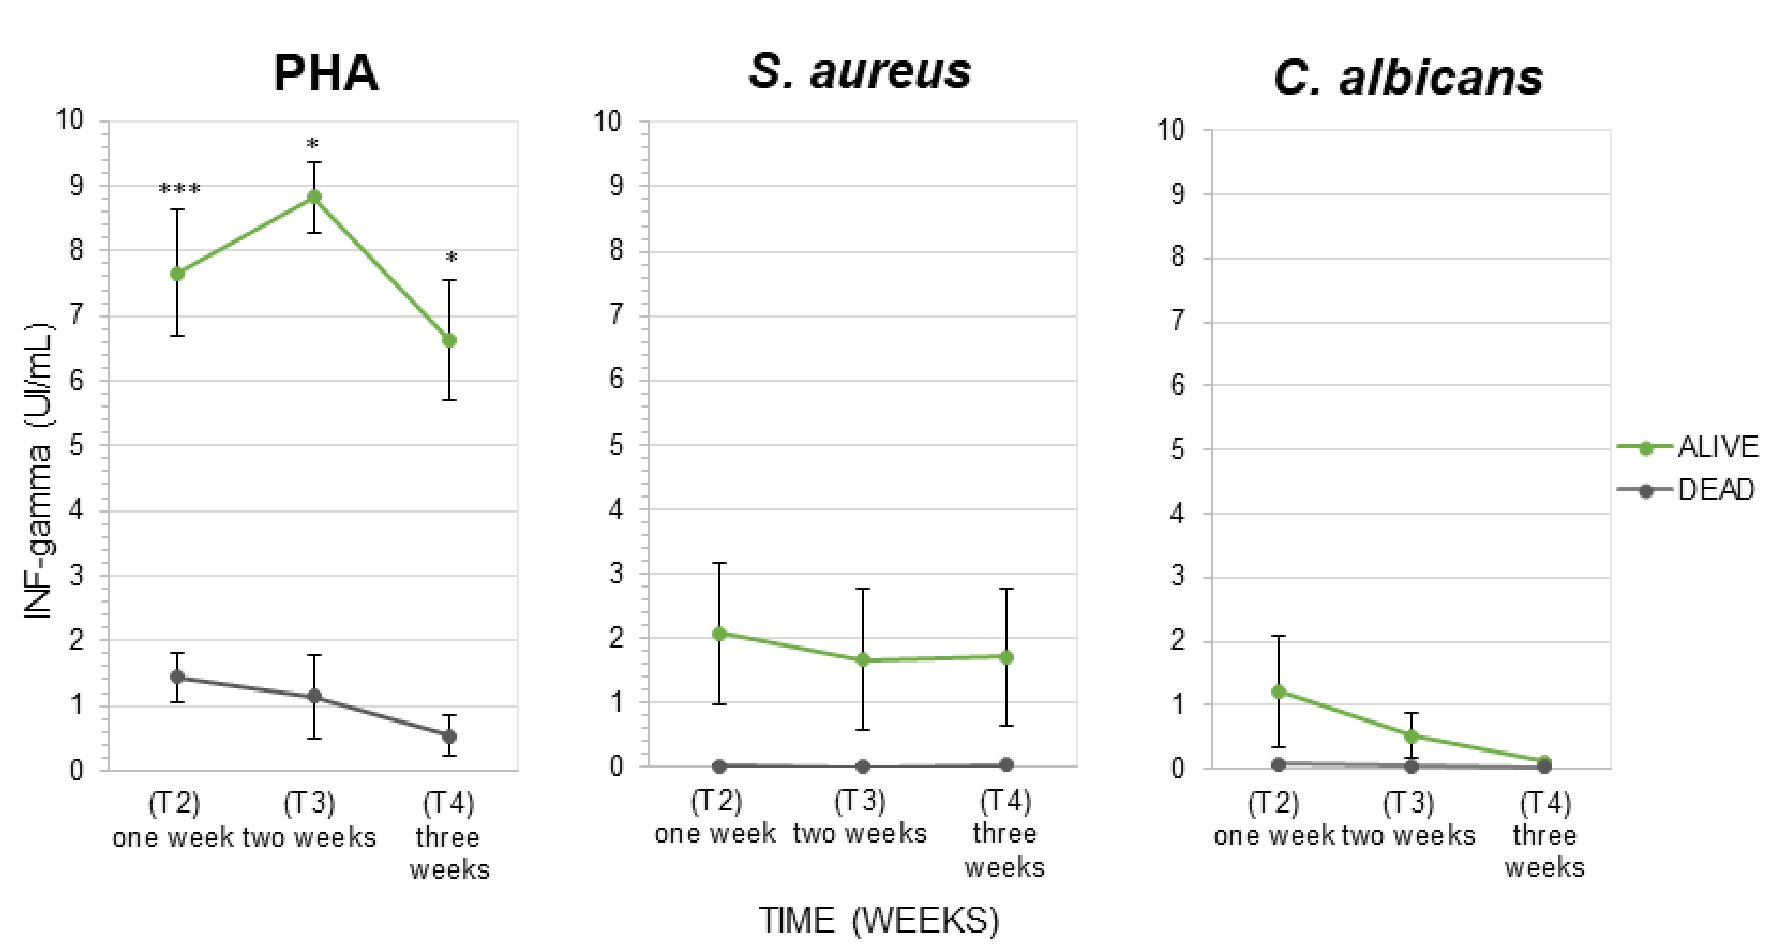
Figure 4. Interferon-γ released by lymphocytes (IFN-γ release assay (IGRA) test) in presence of mitogens: (a) Positive control (PHA). (b, c) Microbial cells lysate (S. aureus and C. albicans) in the group of 16 hospitalized septic patients monitored for the first 3 weeks following septic diagnosis. Patients were classified according to clinical outcome (alive and dead patients). The fourth week was not reported in the graph because all deceased patients died before the 28th days. Data are presented as mean ± SEM. Statistical analysis: unpaired Student’s t-test of dead vs. alive values (*P ≤ 0.05; ***P < 0.001). SEM: standard error of the mean; IFN: interferon; PHA: phytohemagglutinin; S. aureus: Staphylococcus aureus; C. albicans: Candida albicans.

Tables

Table 1. Characteristics of Analyzed Patients
 
Healthy controls (Ctrl, n = 20)Presence of infection (BC-, n = 16)Confirmed sepsis (BC+, n = 39 (BO = 27; WO = 12))4 weeks follow-up (sBC+, n = 16 (deceased: 5/16))
aOther specimens culture: samples from respiratory and urogenital sites, serous cavities, and skin. BC+: patients with positive blood culture; BC-: patients with positive cultural assay in different sites; BO: septic patients with better clinical outcome; WO: septic patients with worst clinical outcome; sBC+: long hospitalized septic patients monitored for 4 weeks. Data are presented as mean ± SEM or n. SEM: standard error of the mean.
Age (years)53 ± 468 ± 367 ± 372 ± 3
Gender (male/female)6/1211/518/216/10
Blood culture--++
Other specimens culturea-+--


Table 2. Cell Population Data (CPD) for the Leukocyte Sub-Populations (Neutrophils, Monocytes and Lymphocytes) of Sub-Group of 16 Hospitalized Septic Patients (sBC+) and Healthy Control (N = 20)
 
ParametersTimeMonocytesLymphocytesNeutrophils
AliveDeadP (alive-dead)ControlsP (alive-controls)P (dead-controls)AliveDeadP (alive-dead)ControlsP (alive-controls)P (dead-controls)AliveDeadP (alive-dead)ControlsP (alive-controls)P (dead-controls)
Average values of tridimensional distribution for each population were reported from admission time (T0) to 4 weeks (T5) after diagnosis of sepsis; statistical analysis was performed by unpaired Student’s t-test of alive vs. dead values; alive vs. controls values; dead vs. controls values (P < 0.05). Parameters related to dispersion of values around the mean are expressed according to distribution width (W) for each population. Optical signals related to internal cells complexity are reported as X values (side scatter, SSc), fluorescence related to nucleic acid content as Y values (SFl), and cell size values are reported in the Z axis (forward scatter, FSc).
Cytoplasmic complexity (SSc)
  XT0125.6129.80.165113.4< 0.001< 0.00183.585.10.40776.80.082< 0.001152.9157.30.193142.60.5340.0214
T1127.8130.90.2628383.80.631154.5158.40.145
T2126.8132.20.05584.285.30.482154.1156.60.555
T3125.3122.90.20884.384.31154.2156.80.468
T4126123.10.10684.183.90.925155.5152.40.45
T5125.9//82.9//153.4//
Total126.4129.10.00883.6850.042153.7156.70.026
  WXT0264.6246.30.556237.50.3240.082497.74190.182442.10.4630.694654.78320.039282.60.0090.0234
T1270.32090.009502.1454.20.427707.9847.70.362
T2268.72290.162498.55500.573628.1835.20.644
T3259.82360.425468.55360.153663650.50.41
T4251.22600.611475.6547.50.019672.5745.50.267
T5244.6//447//706//
Total263.9230.7< 0.001488.9488.30.978662.78060.995
Nuclear complexity (SFl)
  YT0118.91360.064105.80.1040.01972.174.80.486166.70.940.6851.669.10.36644.90.0030.0049
T1118.6135.10.0277174.80.2335371.40.181
T2114.8127.30.15572.576.40.09850.568.70.24
T3117108.20.21572.877.20.09349.550.60.643
T4117.1112.70.55772.145.40.05251.147.50.526
T5112.9//69.1//49.3//
Total117.3126.20.00371.672.90.50351.267.2< 0.001
  WYT0737.14660.0446650.2590.074916.2734.30.132783.80.0420.918654.78320.052555.6< 0.0010.0008
T1740.3528.50.114925.7790.20.184707.9847.70.114
T2728.64740.037931.210010.676628.1835.20.014
T3765917.50.1956.310760.441663650.50.722
T4774.7817.50.547905.1711.50.206672.5745.50.441
T5749//930//706//
Total746547.7< 0.001920.5847.80.148662.7806< 0.001
Cell size (FSc)
  ZT064.863.20.48661.90.0010.1095858.70.59254.10.614< 0.0018788.20.65781.20.1190.9177
T163.362.40.67456.9590.10486.286.80.773
T263.867.50.06558.257.30.30682.586.20.299
T363.865.80.5265857.60.65486.288.90.449
T462.964.60.14958.858.60.82986.5870.902
T560.8//57.5//84.5//
Total63.564.70.15657.858.40.1558587.20.075
  WZT0579.14300.073487.20.0010.757514.65730.354450.30.1090.006626.2737.30.057585.40.3420.162
T1602.9455.50.052496.5591.20.189629.4694.70.256
T2627.8544.50.148566.4583.50.723681.3664.20.69
T3577.85920.827523.27040.058628.86410.823
T4595.45800.851489647.50.058636.86500.835
T5601//508.7//630.7//
Total596507.10.001519630.40.138643.6674.50.122