Figures
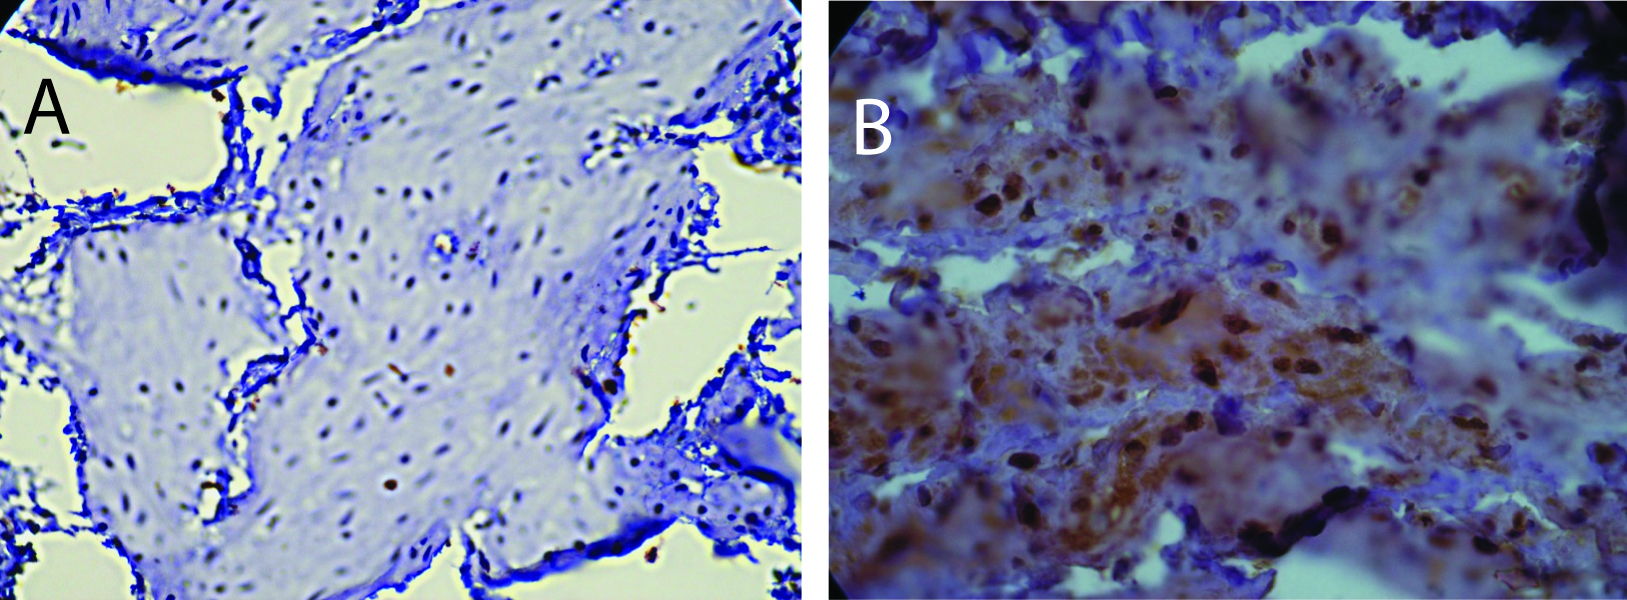
Figure 1. Immunohistochemistry for ERα. A) Section from a sedentary control rat showing positive staining for ERα predominantly in the nuclei. B) Section from sedentary diabetic rat illustrates a considerable increase in the ERα positive cells with both a nuclear and cytoplasmic distribution of the protein with more intense levels. Counterstaining was performed with hematoxylin.
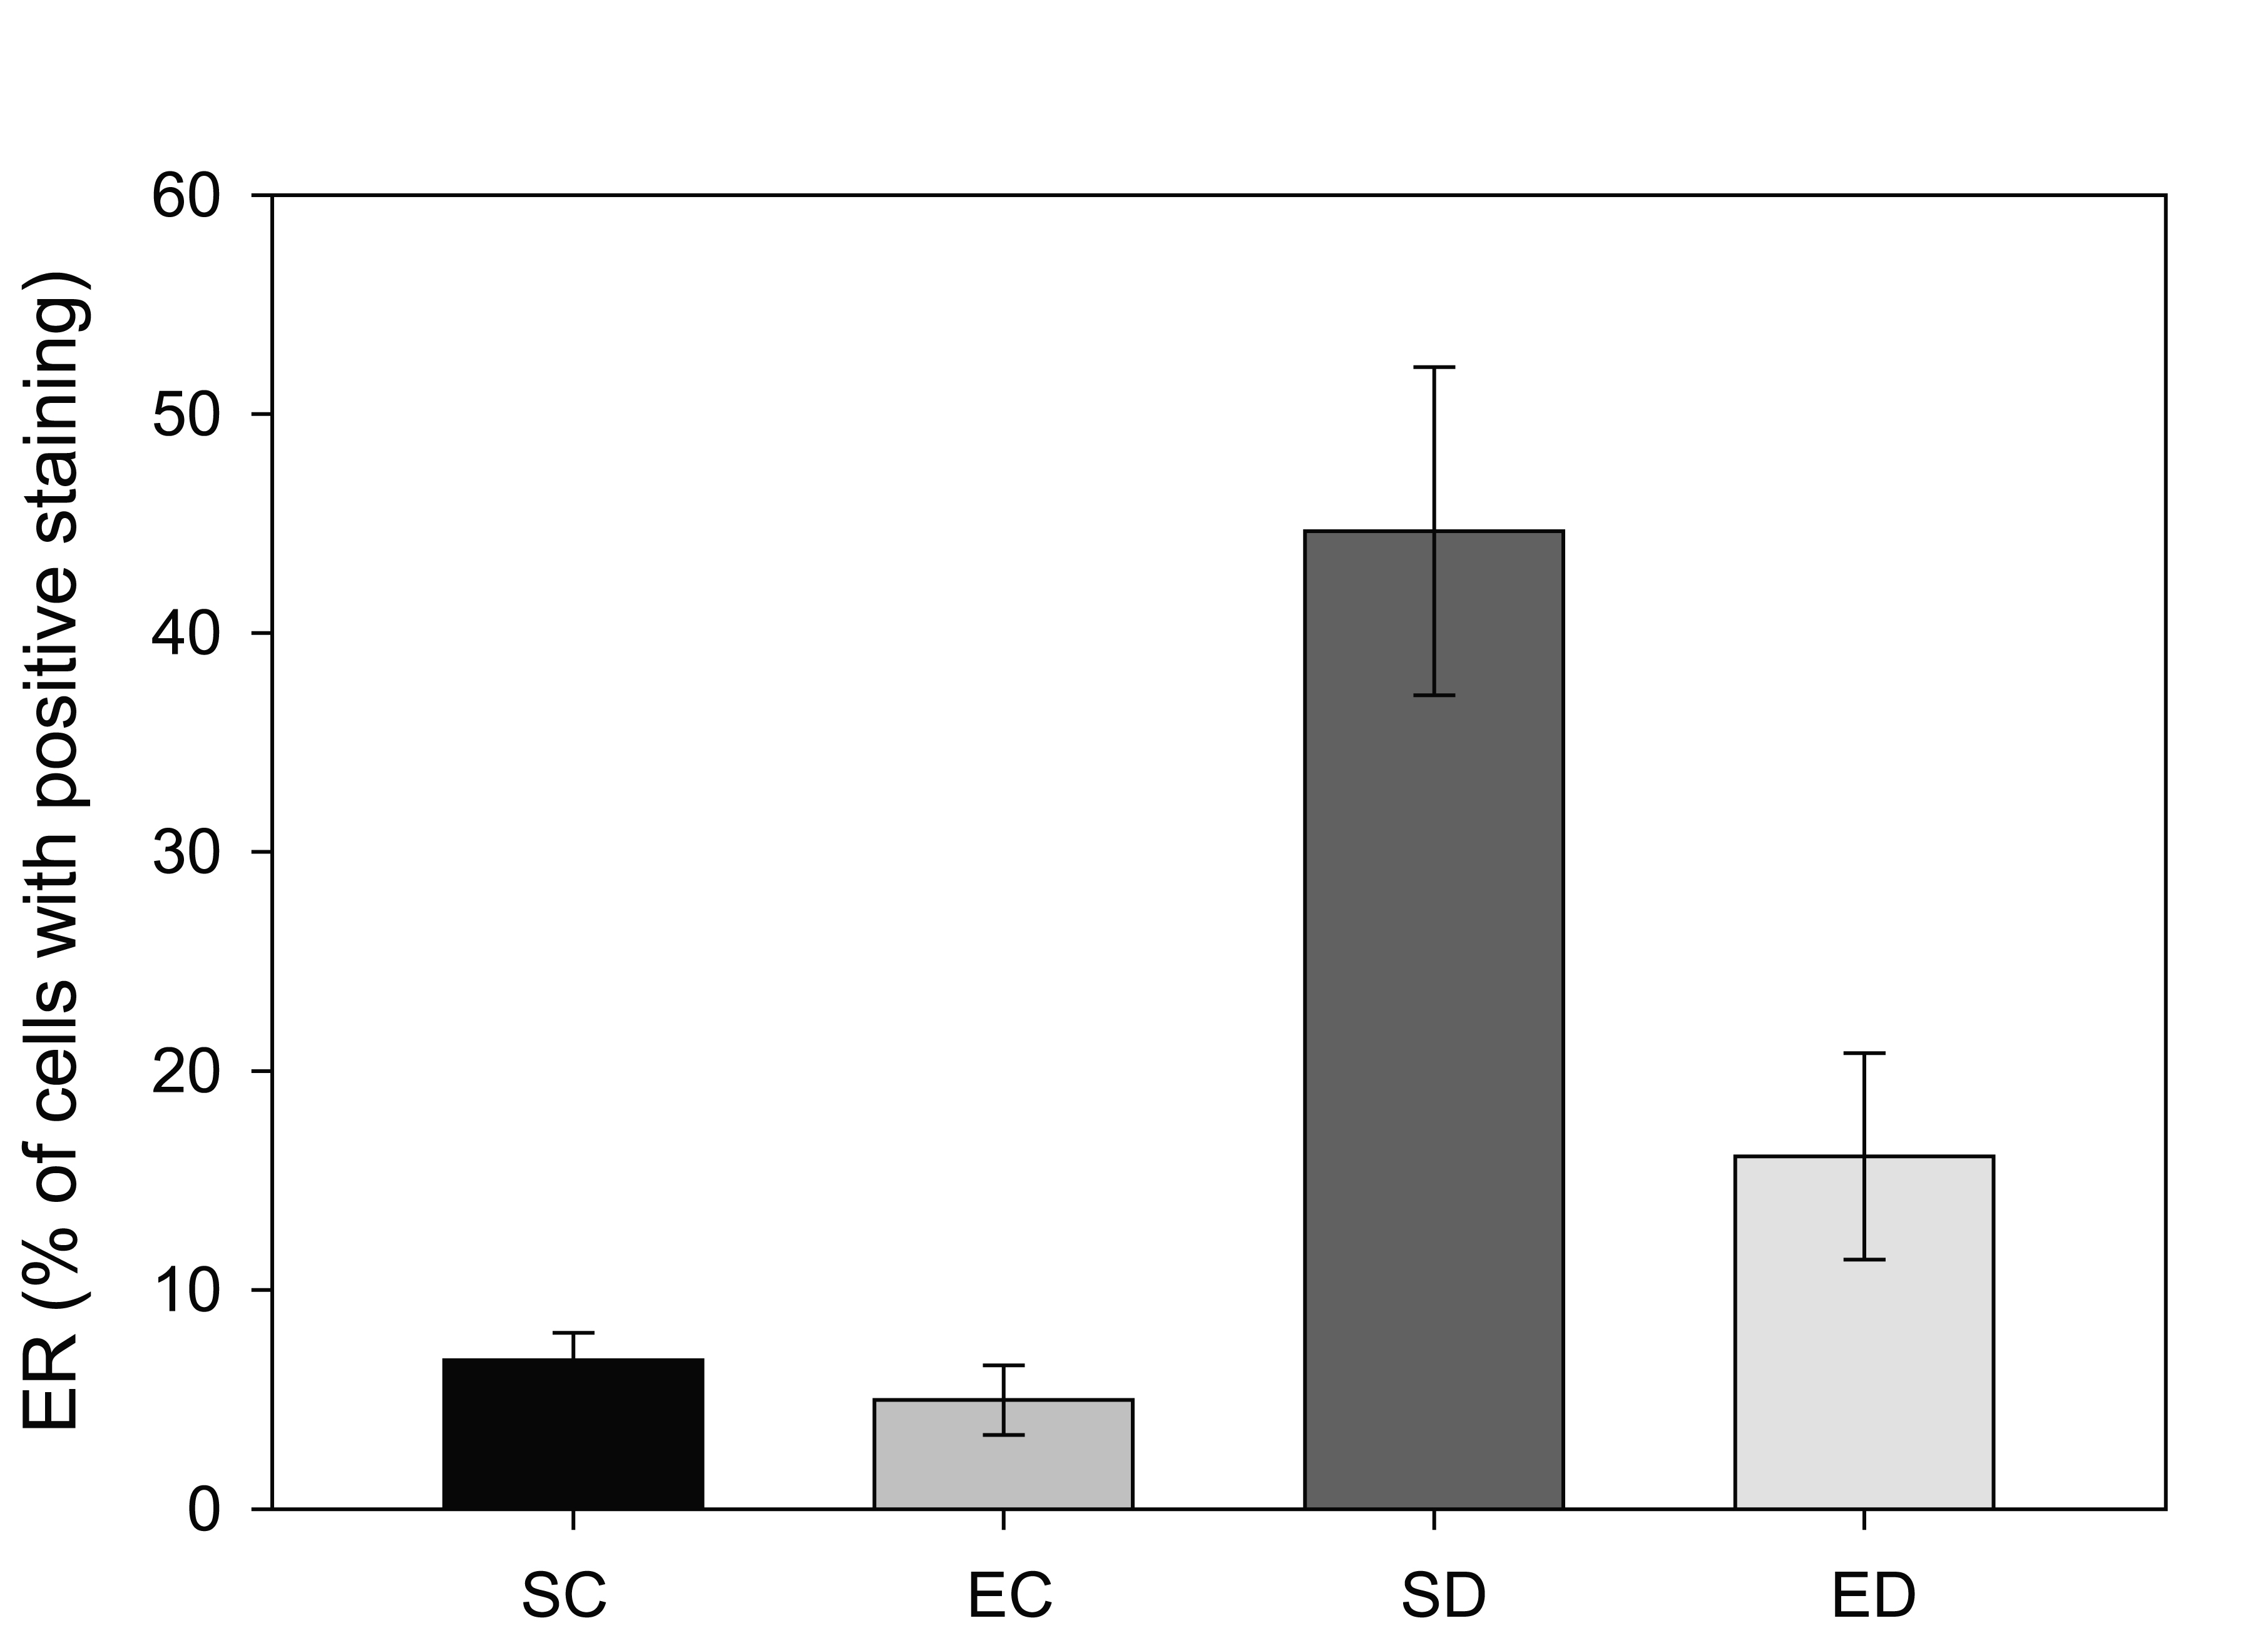
Figure 2. Comparison of estrogen receptor (ERα positive staining in four groups of rats. Tissue from sedentary control (SC) and exercised control (EC) rats illustrated less than 10% of the total area that was positive for ERα per region analyzed. Sedentary diabetic (SD) animals showed a marked increase in ERα immunostaining (* indicates difference from the three other groups, p < 0.02), with exercise training (ED) showing a trend towards reversal.
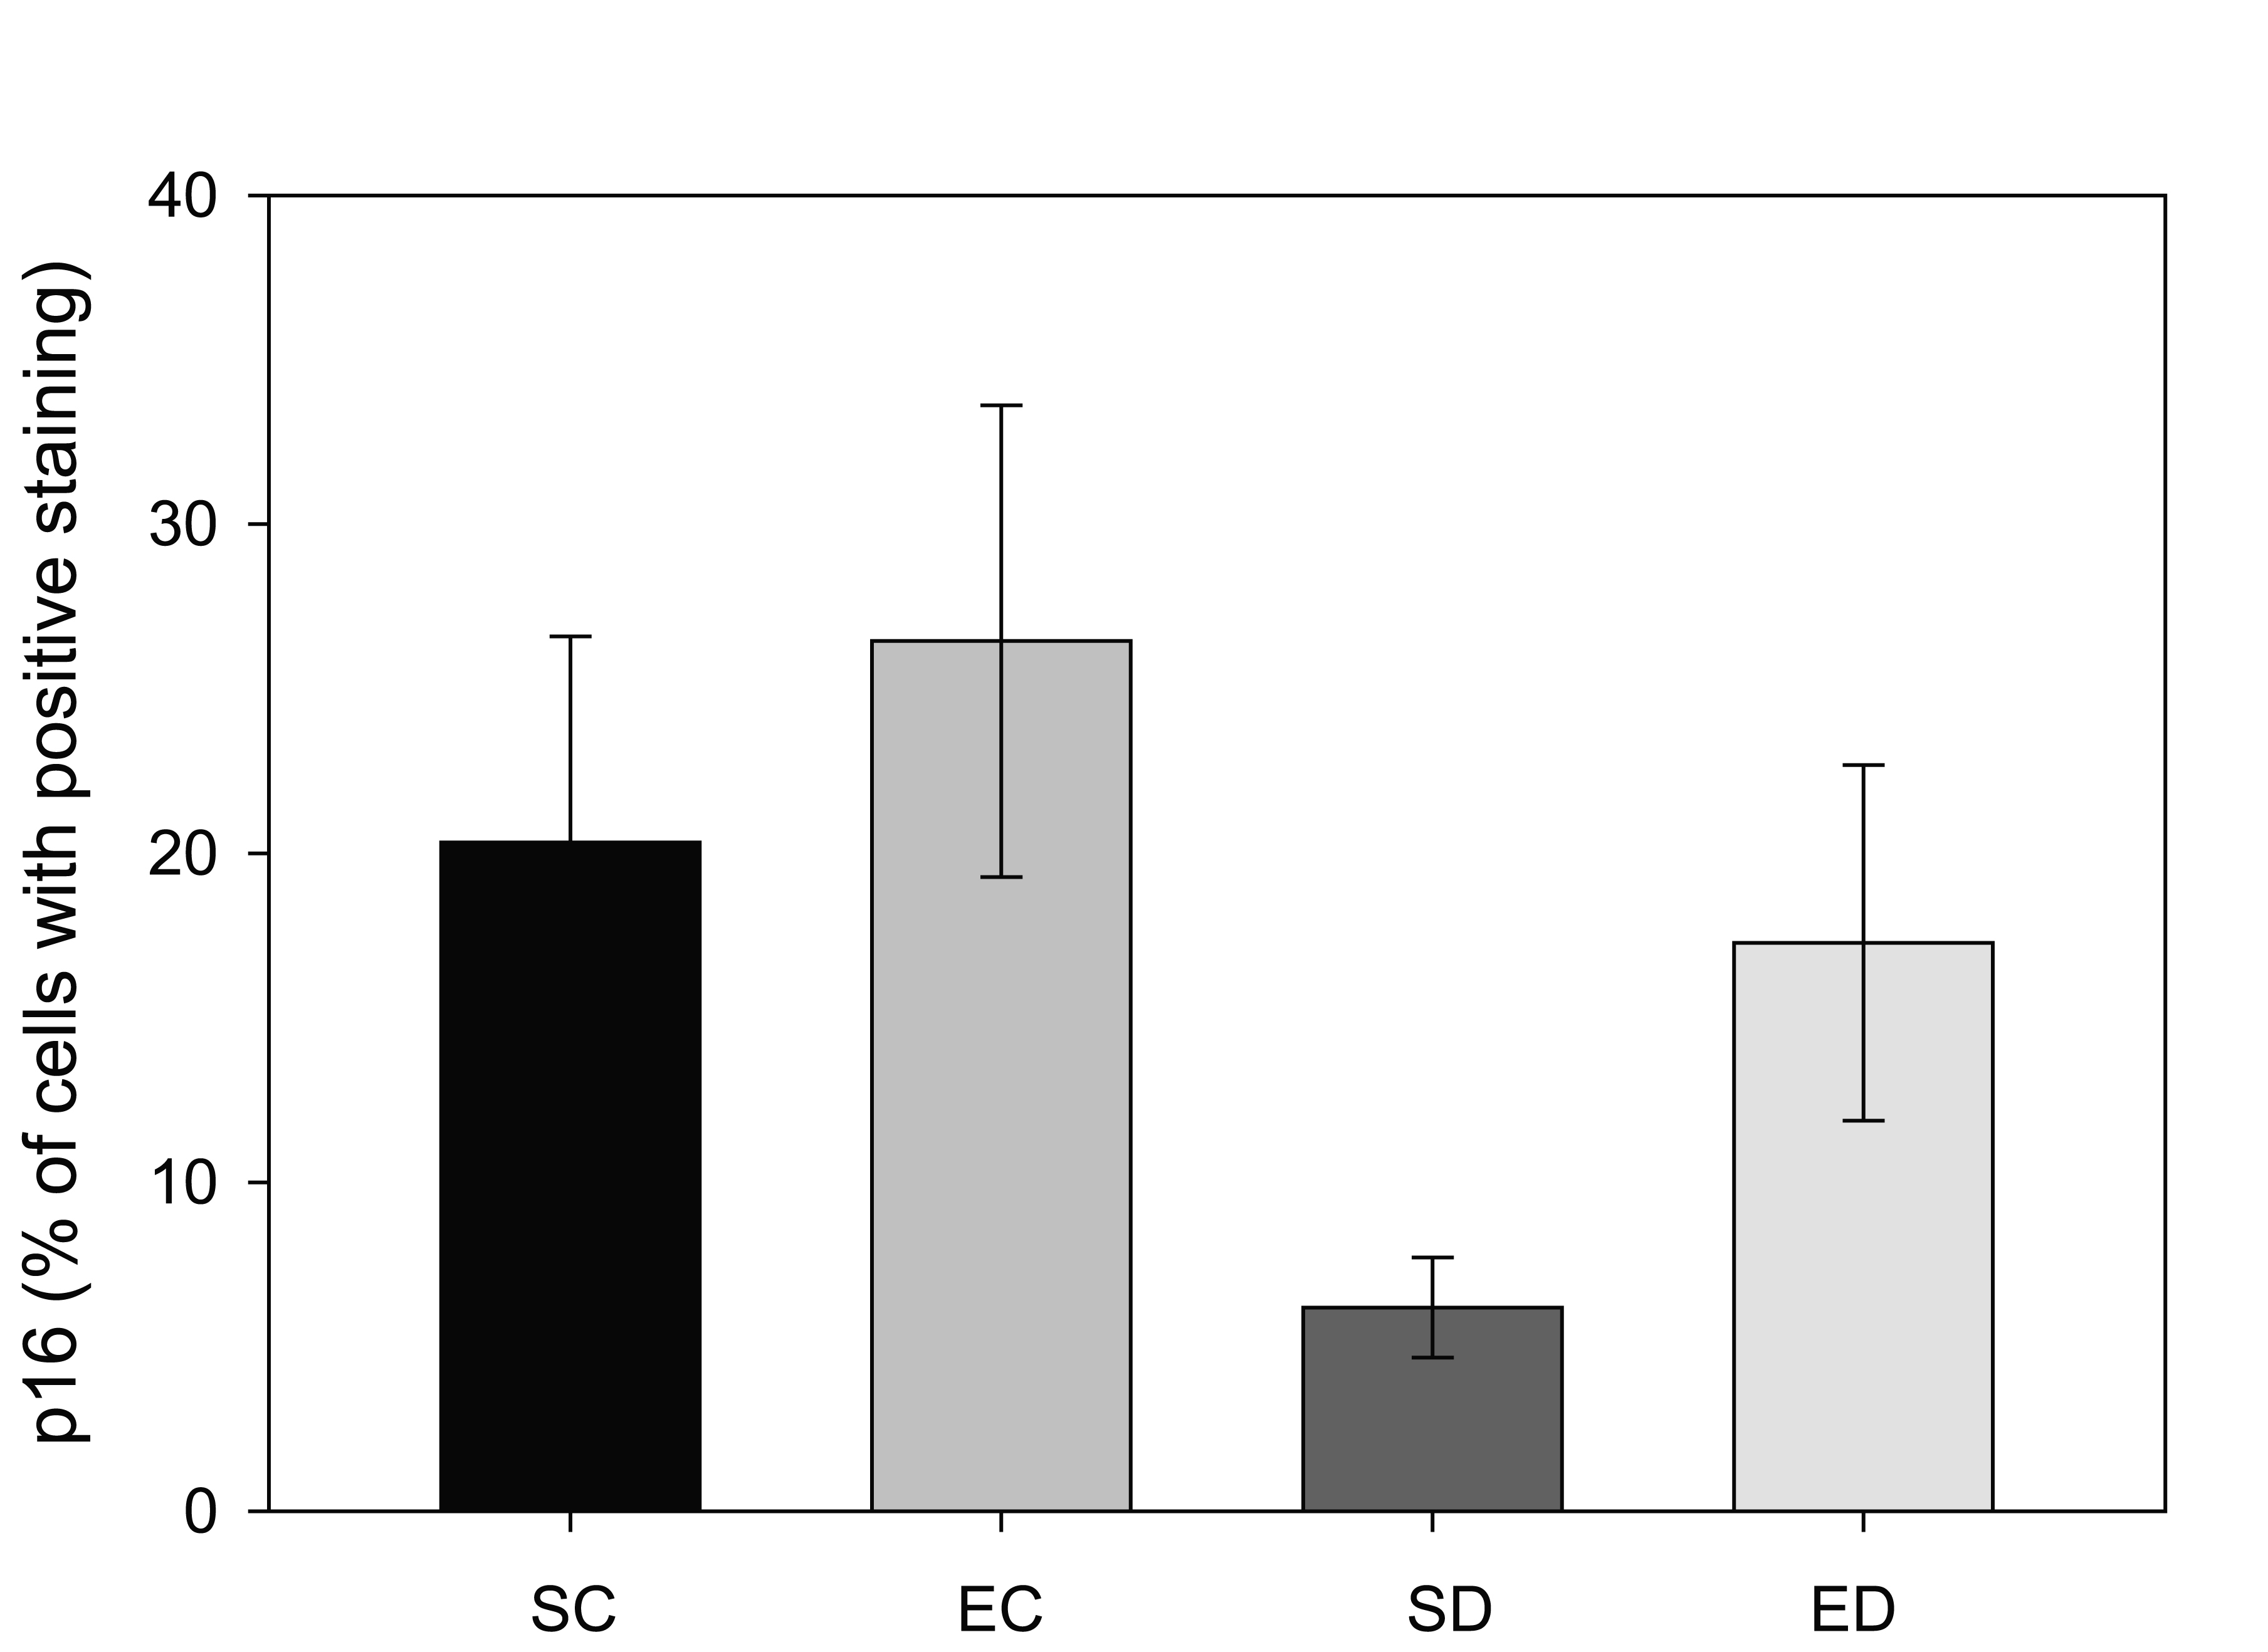
Figure 3. Comparison of p16 positive staining in four groups of rats. Tissue from sedentary control (SC) and exercised control (EC) rats had a greater area of p16-positive immunostaining. Diabetes (SD) reduced the amount of p16-staining when compared to the other three groups (* indicates p < 0.04), while exercise training of the diabetic animals (ED) increased the amount of p16 so that it was not statistically different from the control groups (# indicates significant difference between SD and ED).
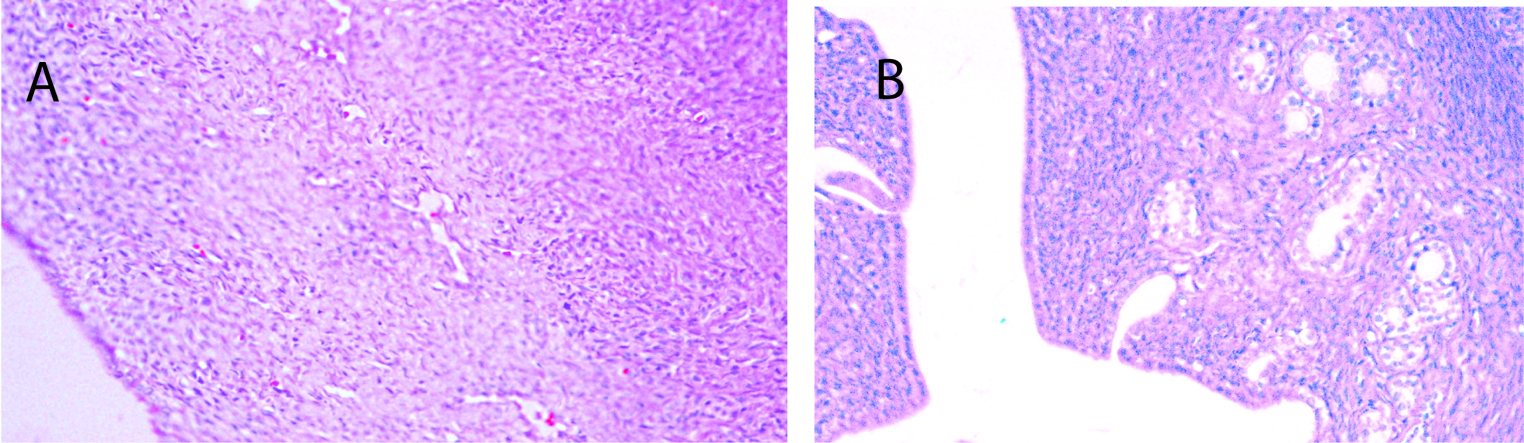
Figure 4. Histological analysis of endometrial tissue. A) Typical section from a sedentary control rat. B) Typical section from a sedentary diabetic rat showing excessive glands (arrows) with tubular cells surrounding the glands, along with signs of hyperplasia.
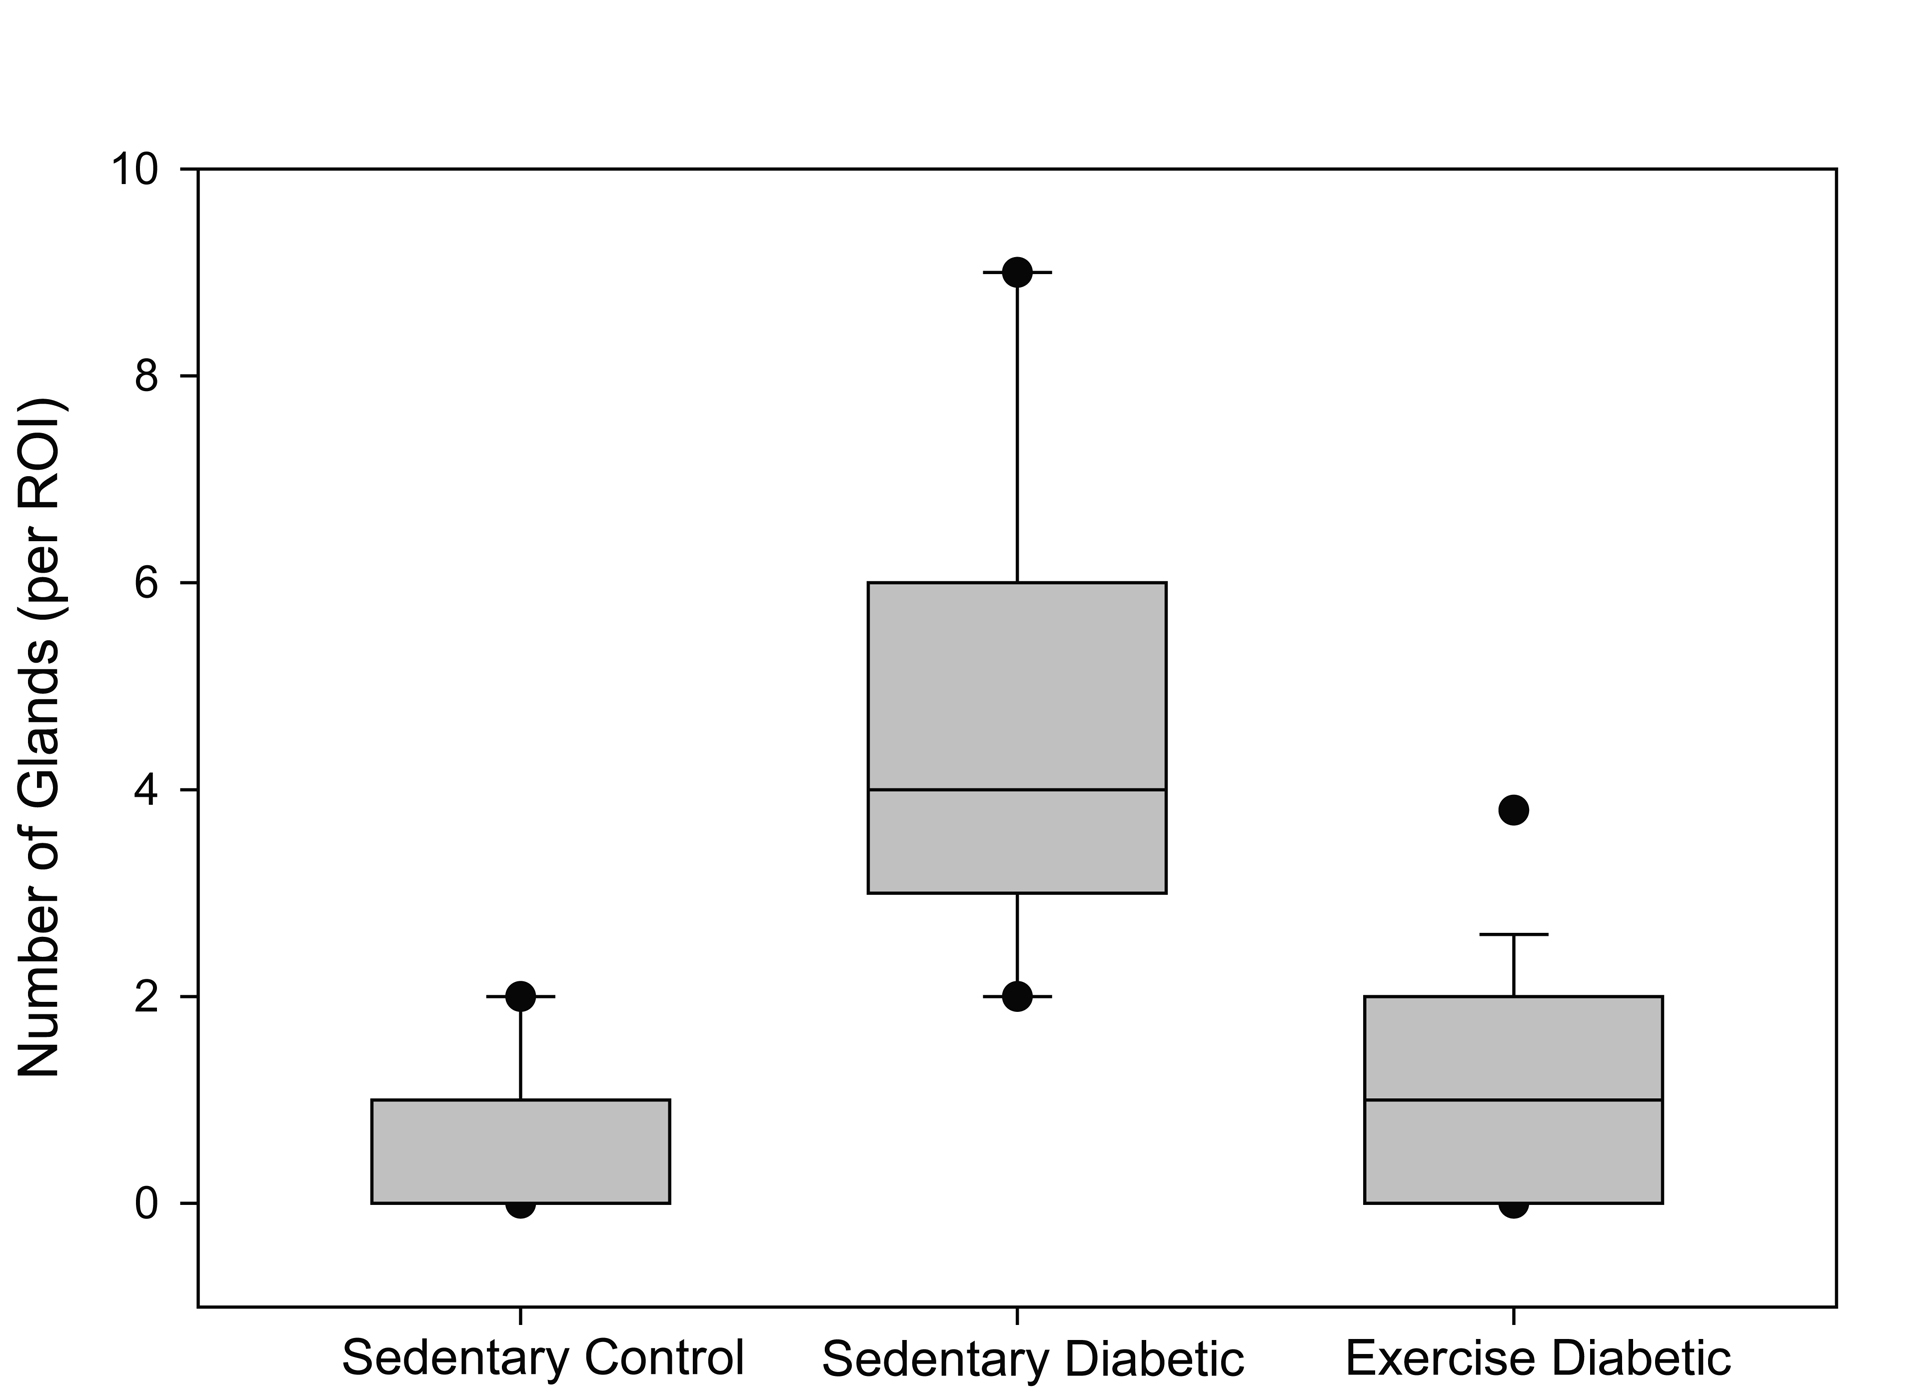
Figure 5. Number of glands. The box plot depicts the median (bold line within the box) number of glands per region of interest (ROI) within the endometrial stroma and the 25th and 75th percentiles (box) between sedentary control, sedentary diabetic and exercised diabetic animals. Vertical lines (whiskers) indicate the 5th and 95th percentiles with outliers shown by the circles.
Table
Table 1. Animal Characteristics
| Group | Initial Weight (g) | Final Weight (g) | Blood glucose (mg/dl) |
|---|
| Sedentary Control (SC) | 120 ± 11 | 143 ± 8 | 104 ± 6 |
| Exercise Control (EC) | 131 ± 12 | 158 ± 13 | 94 ± 9 |
| Sedentary Diabetic (SD) | 125 ± 10 | 134 ± 7 | 430 ± 13* |
| Exercise Diabetic (ED) | 128 ± 11 | 152 ± 12 | 237 ± 10*# |