Journal of Clinical Medicine Research, ISSN 1918-3003 print, 1918-3011 online, Open Access
Article copyright, the authors; Journal compilation copyright, J Clin Med Res and Elmer Press Inc
Journal website https://www.jocmr.org

Original Article

Volume 13, Number 3, March 2021, pages 143-150


Pathologic Characteristics Associated With Local Recurrence of Atypical Meningiomas Following Surgical Resection

Figures

Figure 1.
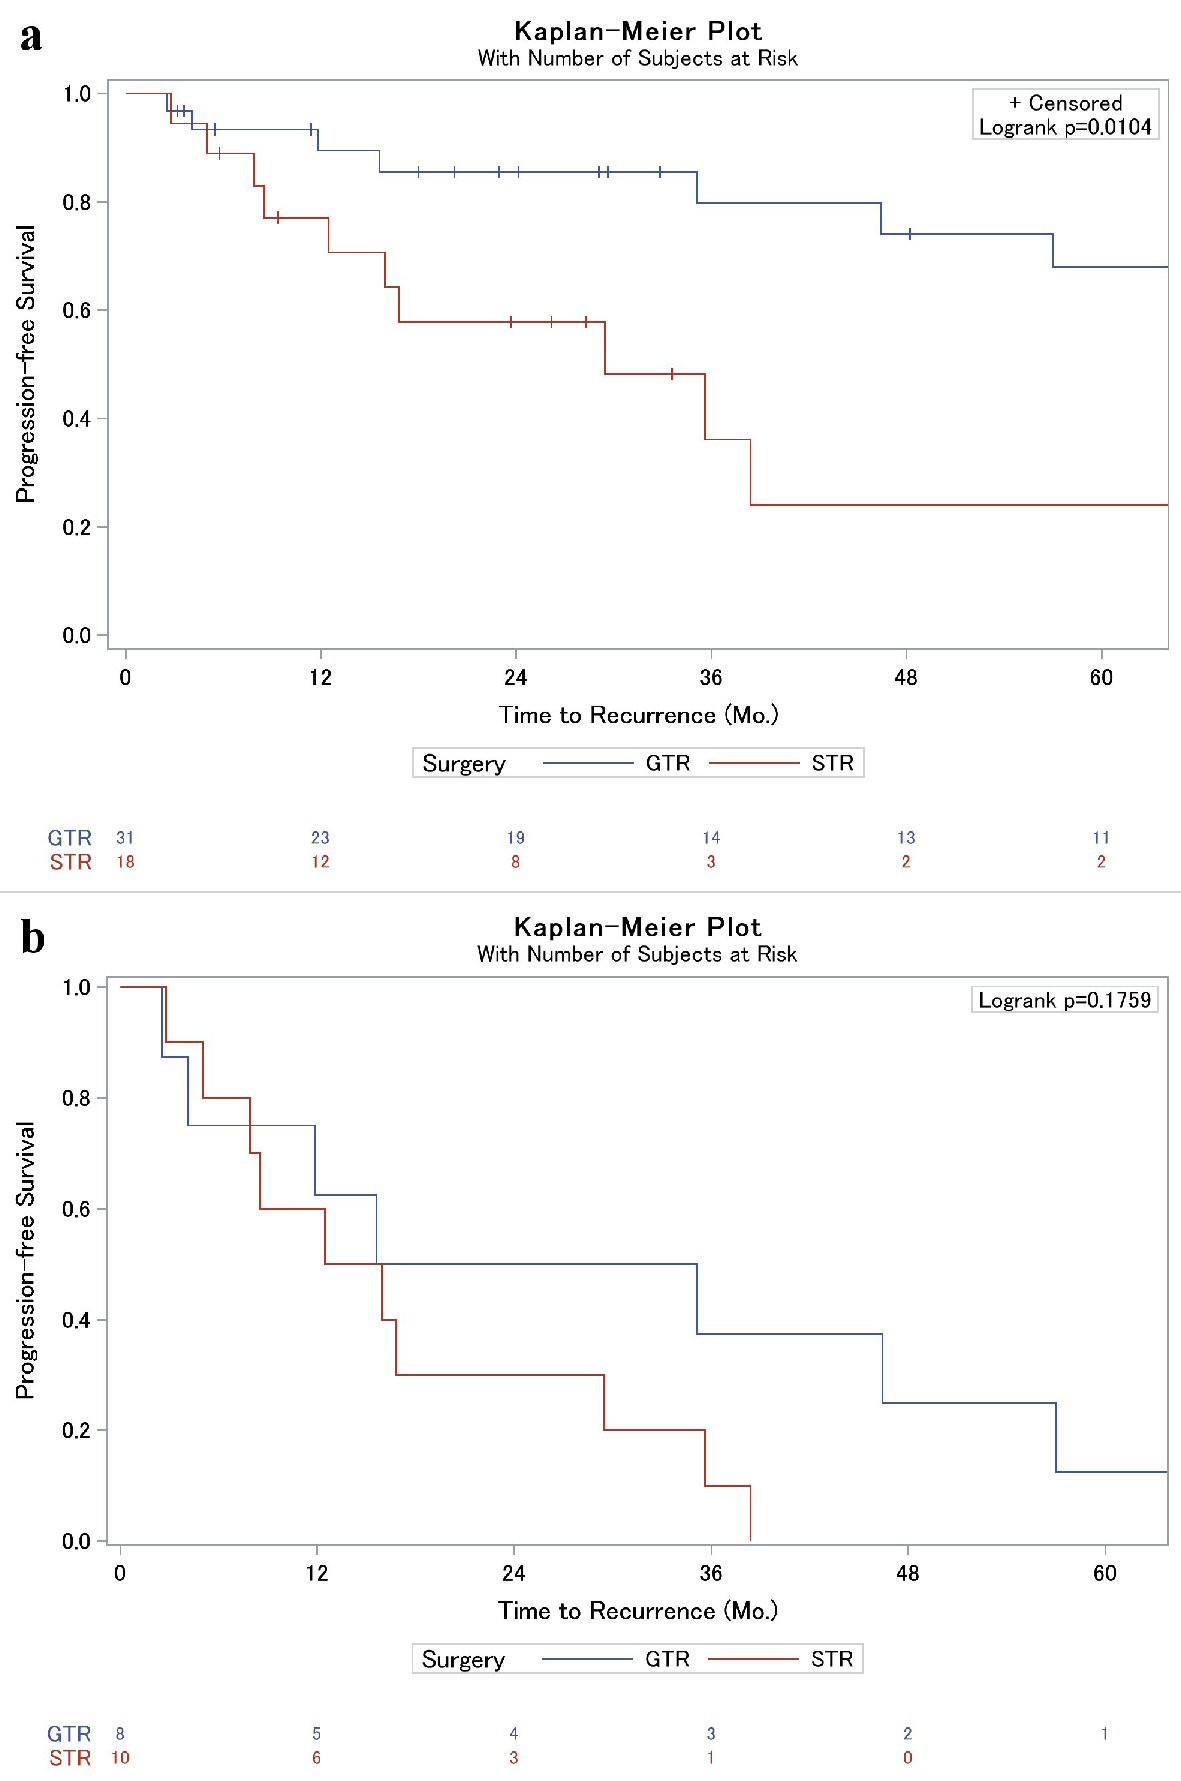
Figure 1. (a) Kaplan-Meier analysis of local failure of grade II meningiomas based on extent of surgical resection. (b) Kaplan-Meier sub-analysis of patients who suffered post-operative local failure (from Fig. 1a) to illustrate time to local failure difference between GTR and STR. Overall, progression was similar between the two cohorts (P = 0.18), but a sub-analysis after 12 months revealed a trend towards significance (P = 0.09). GTR: gross total resection, STR: subtotal resection.
Figure 2.
Figure 2. Kaplan-Meier analysis of local failure of grade II meningiomas based on prior meningioma recurrence.
Figure 3.
Figure 3. Kaplan-Meier analysis of the association of use of radiation therapy (RT) as a portion of post-recurrence patient salvage and time to second local failure.

Tables

Table 1. Patient Demographics and Features Predictive of Local Recurrence After Resection for Grade II Meningiomas
 
VariableRecurrenceP value
NoYes
STR: subtotal resection; GTR: gross total resection; IQR: interquartile range; RT: radiation therapy.
All patients31 (63.3%)18 (36.7%)
Age, median (± IQR)50.5 ( ± 25)50.0 ( ± 27)0.615
Gender
  Male (44.9%)13 (59.1%)9 (40.9%)0.767
  Female (55.1%)18 (66.7%)9 (33.3%)
Surgery
  STR (29.6%)8 (44.4%)10 (55.6%)0.064
  GTR (64.8%)23 (74.2%)8 (25.8%)
Mitosis, median (IQR)4 (0 - 10)4 (0 - 10)0.657
Necrosis
  Absent (32.7%)11 (68.8%)5 (31.2%)0.754
  Present (67.3%)20 (60.6%)13 (39.4%)
Prominent nucleoli
  Absent (59.2%)20 (69.0%)9 (31.0%)0.375
  Present (40.8%)11 (55.0%)9 (45.0%)
Architectural sheeting
  Absent (65.3%)22 (68.8%)10 (31.3%)0.226
  Present (32.7%)8 (50.0%)8 (50.0%)
Hypercellularity
  Absent (49.0%)16 (66.7%)8 (33.3%)0.769
  Present (51.0%)15 (60.0%)10 (40.0%)
Choroid or clear cell
  Absent (93.9%)26 (59.1%)18 (40.9%)0.276
  Present (6.1%)3 (100%)0 (0.0%)
Ki-67, median (IQR)8 (0 - 25)10 (3 - 15)0.763
Bone invasion
  No (81.6%)27 (67.5%)13 (32.5%)0.259
  Yes (18.4%)4 (44.4%)5 (55.6%)
Brain invasion
  No (77.6%)24 (63.2%)14 (36.8%)1.000
  Yes (22.4%)7 (63.6%)4 (36.4%)
Adjuvant RT
  No (89.8%)29 (65.9%)15 (34.1%)0.342
  Yes (10.2%)2 (40.0%)3 (60.0%)
Prior recurrence
  No (75.5%)26 (70.3%)11 (29.7%)0.001
  Yes (24.5%)3 (25.0%)9 (75.0%)


Table 2. Factors Associated With Time to Recurrence Following Resection in Grade II Meningiomas
 
VariableComparison groupRef groupHazard ratio95% CIP value
STR: subtotal resection; GTR: gross total resection; RT: radiation therapy; CI: confidence interval.
Univariable analysis
  GenderMaleFemale0.6460.2551.6370.357
  AgeIncreasing age0.9970.9681.0260.823
  SurgerySTRGTR3.2781.2618.5260.015
  RTNoYes0.4020.1121.4410.162
  NecrosisPresentAbsent1.1950.4253.3570.736
  MitosisIncreasing mitotic count0.9450.7401.2070.765
  NucleoliPresent1.1270.4452.8550.801
  Architectural sheetingAbsentPresent0.5680.2241.4440.235
  HypercellularityAbsentPresent1.1020.4262.8540.841
  ChoroidAbsentPresent4.8890.151157.80.371
  Bone invasionAbsentPresent0.5310.1891.4930.230
  Brain invasionAbsentPresent0.8390.2752.5580.758
  Ki-67Increasing Ki-670.9850.8581.1300.826
  Prior recurrenceNo priorPrior0.2310.0910.5880.002
Multivariable analysis
  SurgerySTRGTR0.4520.1631.2530.127
  Prior recurrenceNo priorPrior0.2681.2018.8970.021


Table 3. Factors Associated With Time to Second Recurrence in Grade II Meningiomas
 
VariableComparison groupReference groupHazard ratio95% CIP value
STR: subtotal resection; GTR: gross total resection; RT: radiation therapy; CI: confidence interval.
Univariable analysis
  GenderMaleFemale0.2740.0671.1320.074
  AgeIncreasing age0.9850.9471.0250.466
  SurgerySTRGTR3.2480.67615.6080.141
  RT after initial resectionNoYes0.0990.0160.6080.013
  NecrosisPresentAbsent1.4160.3605.5670.619
  MitosisIncreasing mitotic count1.0680.8071.4130.646
  NucleoliPresent0.9850.2883.3710.981
  Architectural sheetAbsentPresent0.2080.0401.0690.060
  HypercellularityAbsentPresent0.6470.1682.40.526
  Bone invasionAbsentPresent0.0520.0060.4560.008
  Brain invasionAbsentPresent0.8900.1794.4270.887
  Ki-67Increasing Ki-671.1650.8261.6430.385
  Prior recurrenceNoYes0.5070.1451.7820.289
  Received salvage RTYesNo0.0200.0010.1890.019
  Received salvage resectionYesNo1.9590.5957.1460.296
  Prior recurrenceNo priorPrior0.5070.1451.7820.290
Multivariable analysis
  Bone invasionAbsentPresent0.5500.05010.5080.659
  RT after initial resectionNoYes3.9710.52443.6110.255
  Received salvage RTYesNo0.0110.0010.3160.037