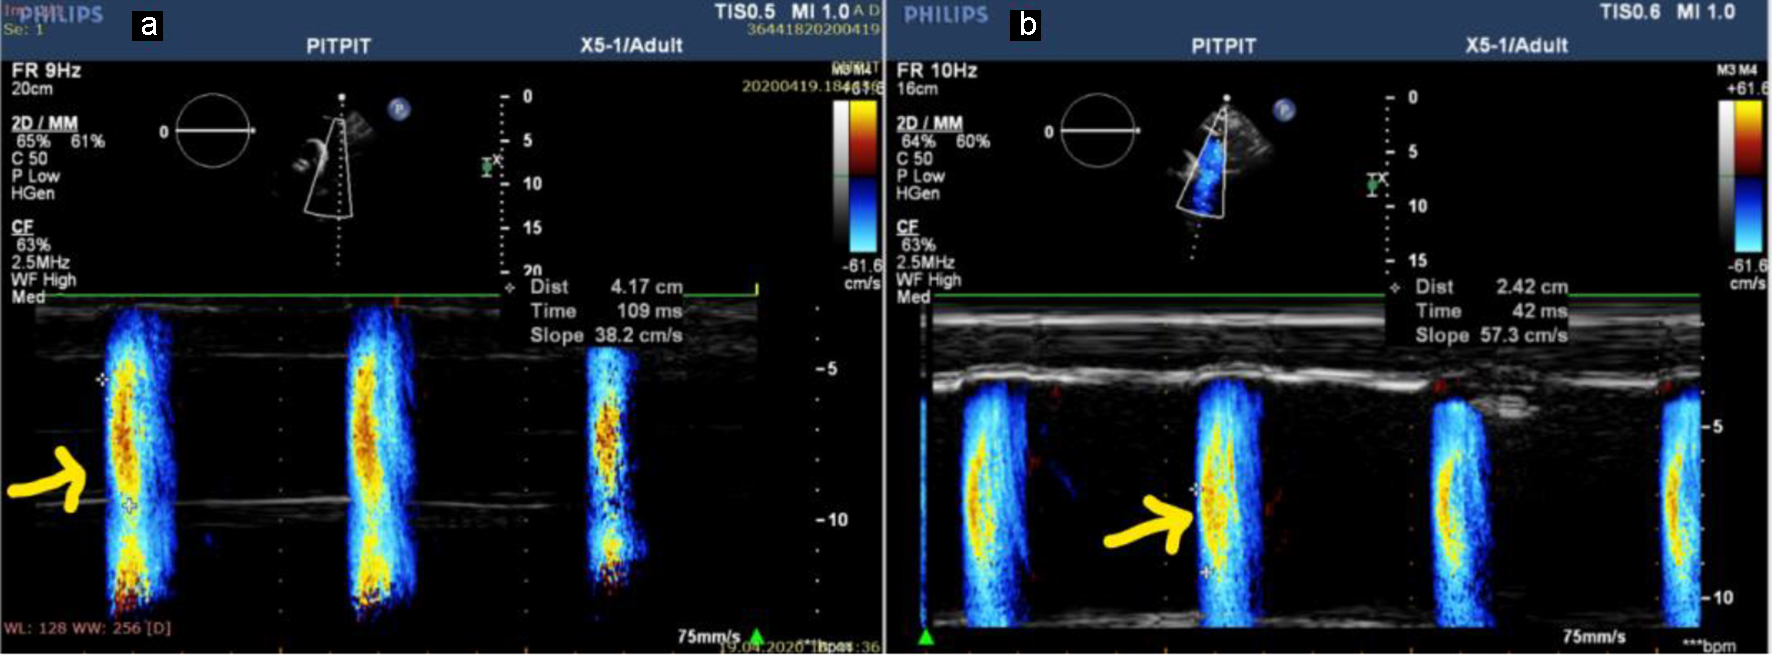
Figure 1. APV in a patient with stage V CKD (APV = 38.2 cm/s) (a) and in a patient with stage III (APV = 57.3 cm/s) (b). APV: aortic propagation velocity; CKD: chronic kidney disease.
| Journal of Clinical Medicine Research, ISSN 1918-3003 print, 1918-3011 online, Open Access |
| Article copyright, the authors; Journal compilation copyright, J Clin Med Res and Elmer Press Inc |
| Journal website https://www.jocmr.org |
Original Article
Volume 13, Number 2, February 2021, pages 121-129
The Association of Glomerular Filtration Rate With Echocardiographic Parameters in Chronic Kidney Disease
Figures
Tables
| Stage I (n = 76) | Stage II (n = 39) | Stage III (n = 25) | Stage IV (n = 15) | Stage V (n = 15) | P value | |
|---|---|---|---|---|---|---|
| aStage I vs. other groups. bStage II vs. other groups. cStage III vs. other groups. dStage IV vs. other groups. BMI: body mass index. | ||||||
| Age (years) | 52.2 ± 12.6 | 63.4 ± 10.3a | 63.9 ± 8.6a | 59.8 ± 12.2 | 63.6 ± 4.6a | < 0.001 |
| Male, n (%) | 53 (70) | 27 (69) | 14 (56) | 8 (53) | 7 (47) | 0.293 |
| BMI (kg/m2) | 29.3 ± 5.0 | 28.9 ± 3.3 | 29.0 ± 4.9 | 29.4 ± 4.5 | 30.1 ± 5.5 | 0.940 |
| Diabetes mellitus, n (%) | 22 (29) | 10 (25) | 8 (32) | 6 (40) | 3 (20) | 0.145 |
| Coronary artery disease, n (%) | 32 (42) | 20 (51) | 19 (76)a, b | 4 (27)c | 13 (87)a, b, d | 0.001 |
| Hypertension, n (%) | 35 (46) | 34 (87)a | 18 (72) | 15 (100)a | 5 (33)b, d | < 0.001 |
| Smoking, n (%) | 37 (49) | 22 (57) | 12 (48) | 6 (40) | 13 (87) | 0.065 |
| Hyperlipidemia, n (%) | 24 (32) | 15 (40) | 13 (52) | 12 (80)a | 3 (20)d | 0.003 |
| White blood cell count (103/mm3) | 8.1 ± 2.0 | 8.5 ± 2.5 | 8.8 ± 1.9 | 6.0 ± 1.4a, b, c | 7.5 ± 0.8 | < 0.001 |
| Hemoglobin (g/dL) | 13.9 ± 1.8 | 12.7 ± 1.8a | 12.7 ± 1.0a | 11.5 ± 1.8a | 10.2 ± 2.6a, b, c | < 0.001 |
| Creatinine (mg/dL) | 1.0 ± 0.2 | 1.3 ± 0.1a | 1.9 ± 0.6a, b | 3.8 ± 0.5a, b, c | 5.9 ± 0.4a, b, c, d | < 0.001 |
| Sodium (mEq/L) | 137.4 ± 3.7 | 135.8 ± 3.1 | 136.8 ± 0.9 | 141.5 ± 5.0a, b, c | 134.2 ± 3.6a, d | < 0.001 |
| Albumin (g/dL) | 3.5 ± 0.4 | 3.5 ± 0.4 | 3.8 ± 0.3a, b | 3.6 ± 0.4 | 3.6 ± 0.3 | 0.036 |
| C-reactive protein (mg/L) | 10.6 ± 8.0 | 15.7 ± 12.2a | 10.9 ± 7.1 | 7.1 ± 9.8b | 15.1 ± 6.0 | 0.007 |
| Total cholesterol (mg/dL) | 205.0 ± 43.2 | 217.2 ± 40.3 | 216.4 ± 46.7 | 213.2 ± 55.8 | 202.9 ± 24.2 | 0.534 |
| Ejection fraction (%) | 58.2 ± 6.6 | 57.2 ± 12.1 | 57.5 ± 17.9 | 60.6 ± 11.0 | 56.5 ± 3.6 | 0.645 |
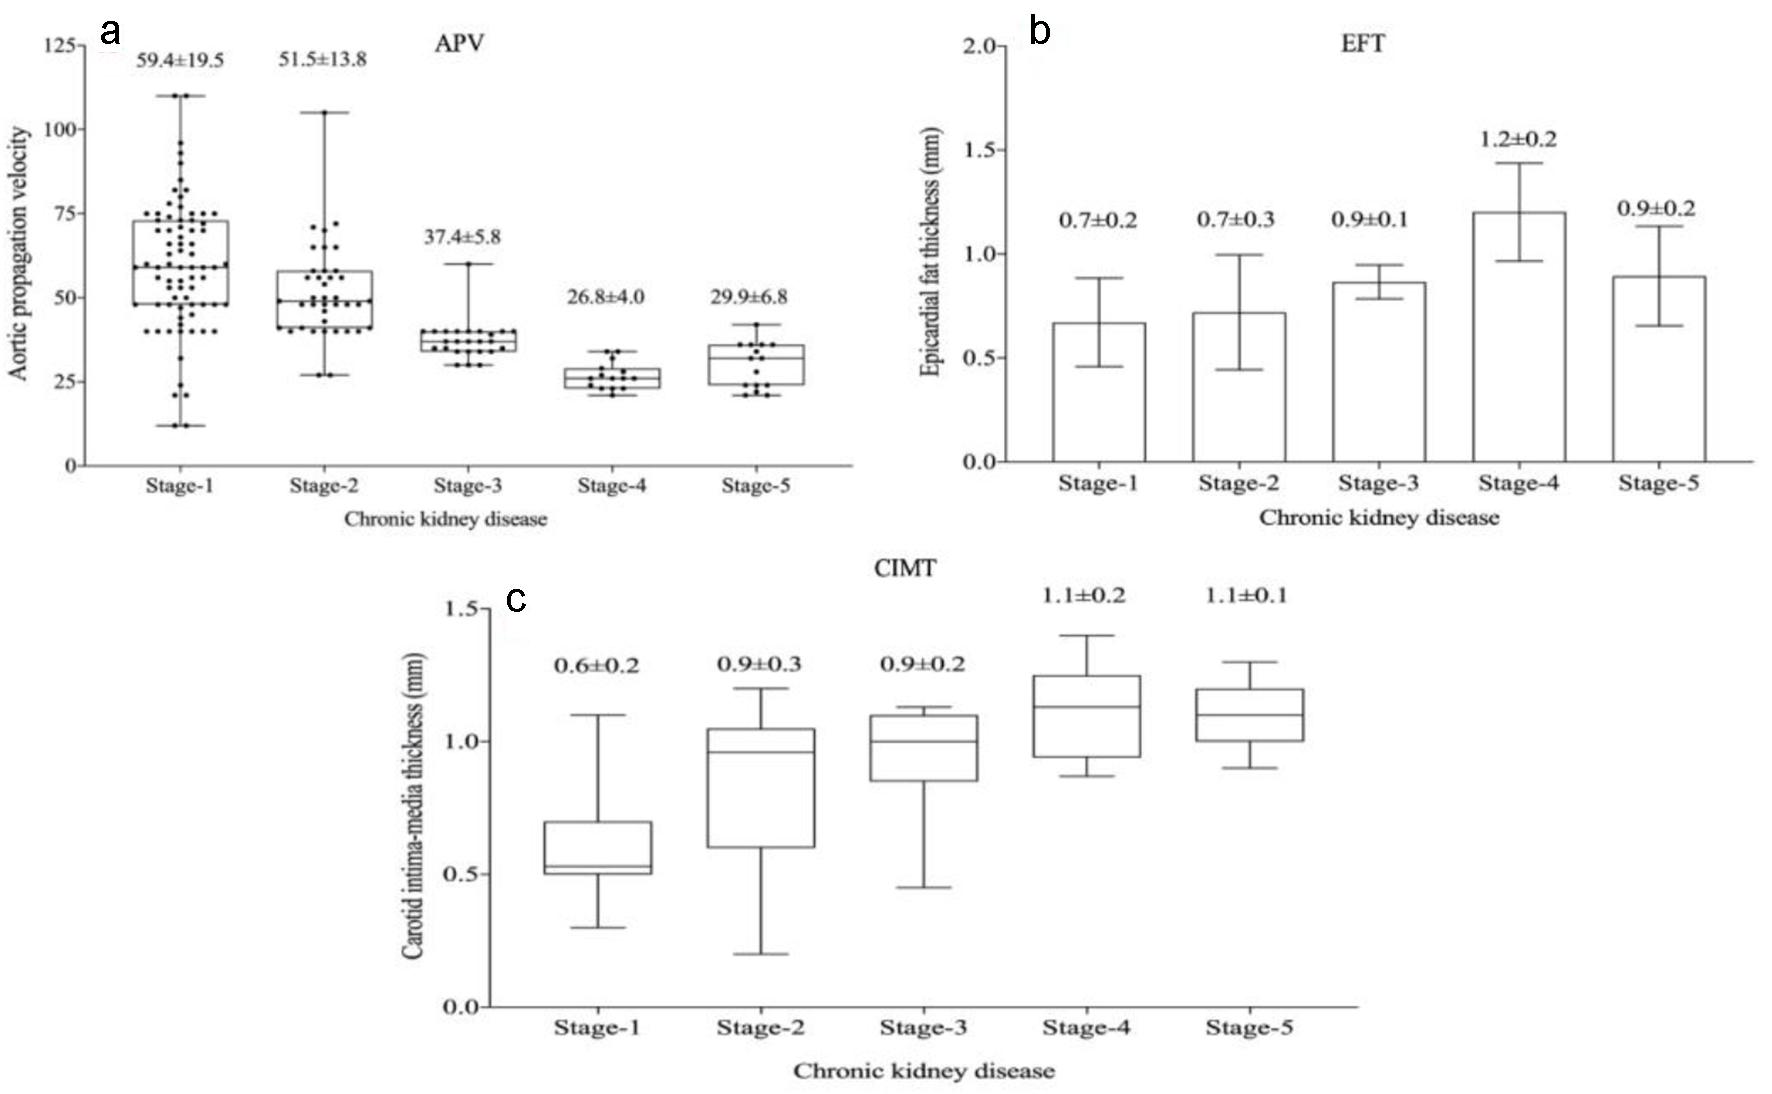
| Aortic propagation velocity (cm/s) | 59.4 ± 19.5 | 51.5 ± 13.8 | 37.4 ± 5.8a, b | 26.8 ± 4.0a, b | 29.9 ± 6.8a, b | < 0.001 |
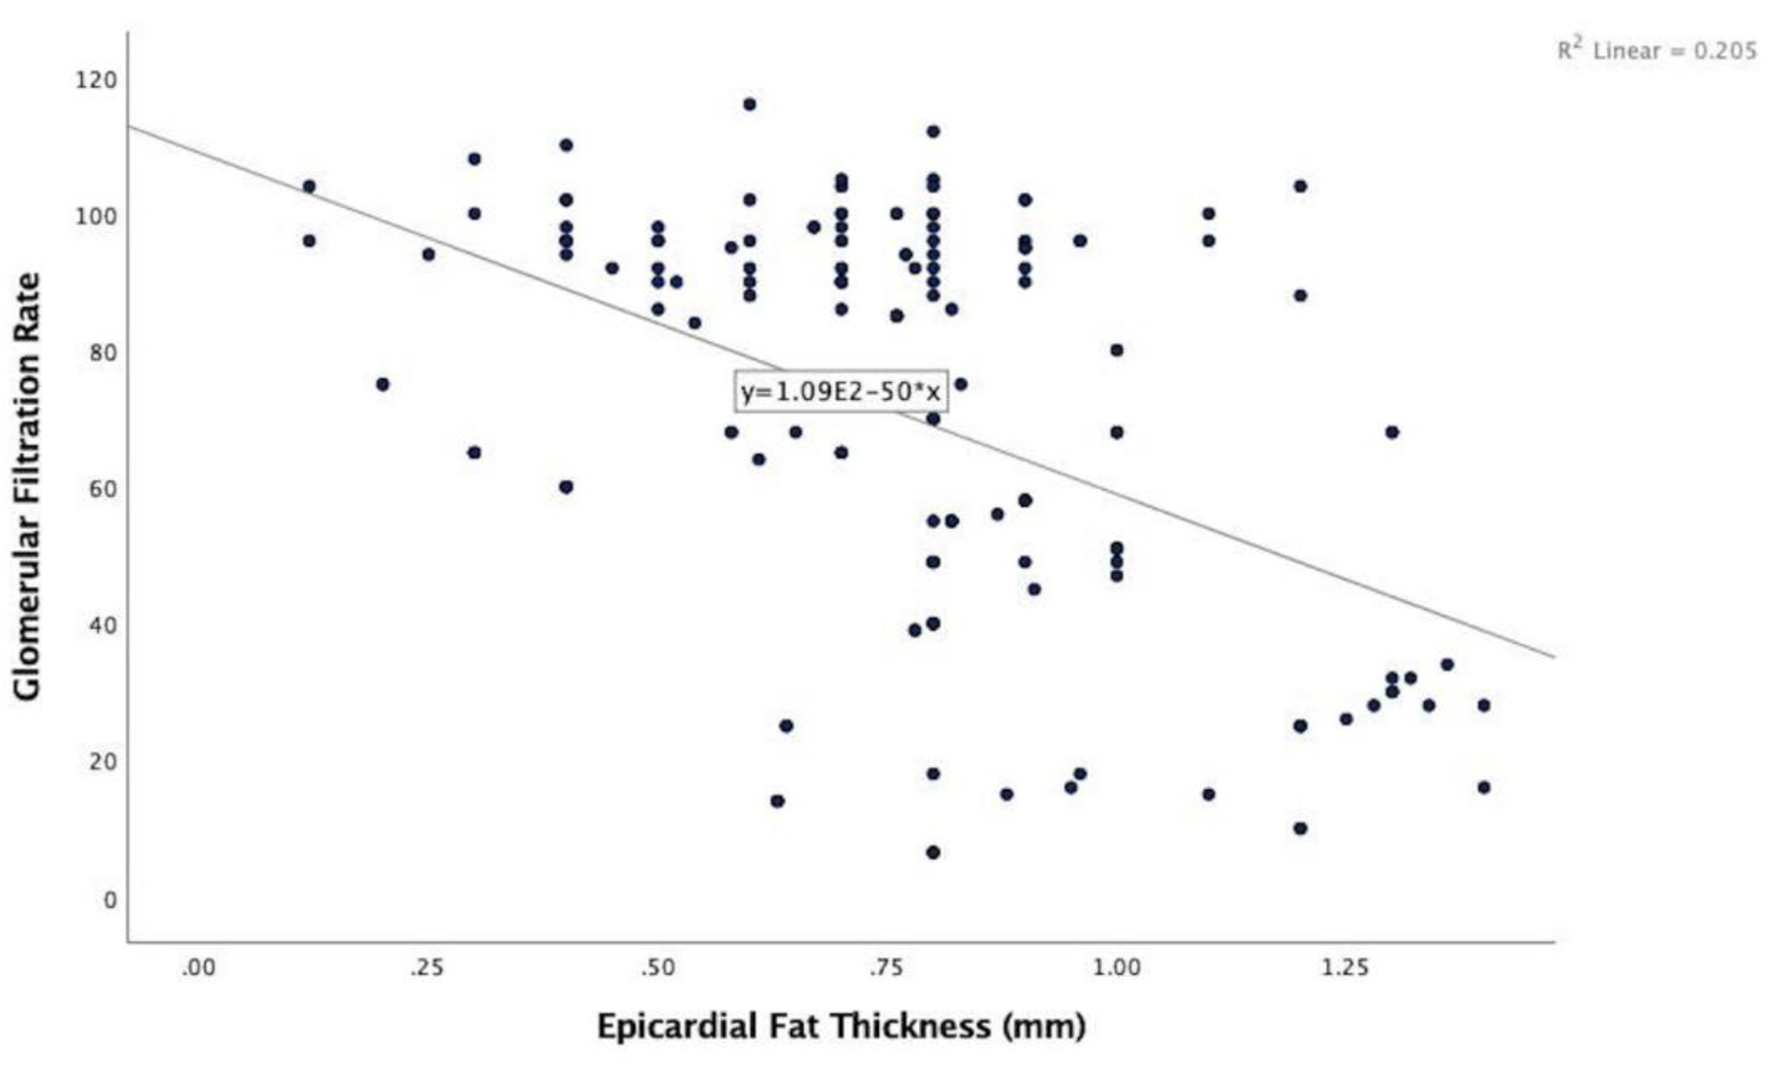
| Epicardial fat thickness (mm) | 0.7 ± 0.2 | 0.7 ± 0.3 | 0.9 ± 0.1a | 1.2 ± 0.2a, b, c | 0.9 ± 0.2a, d | < 0.001 |
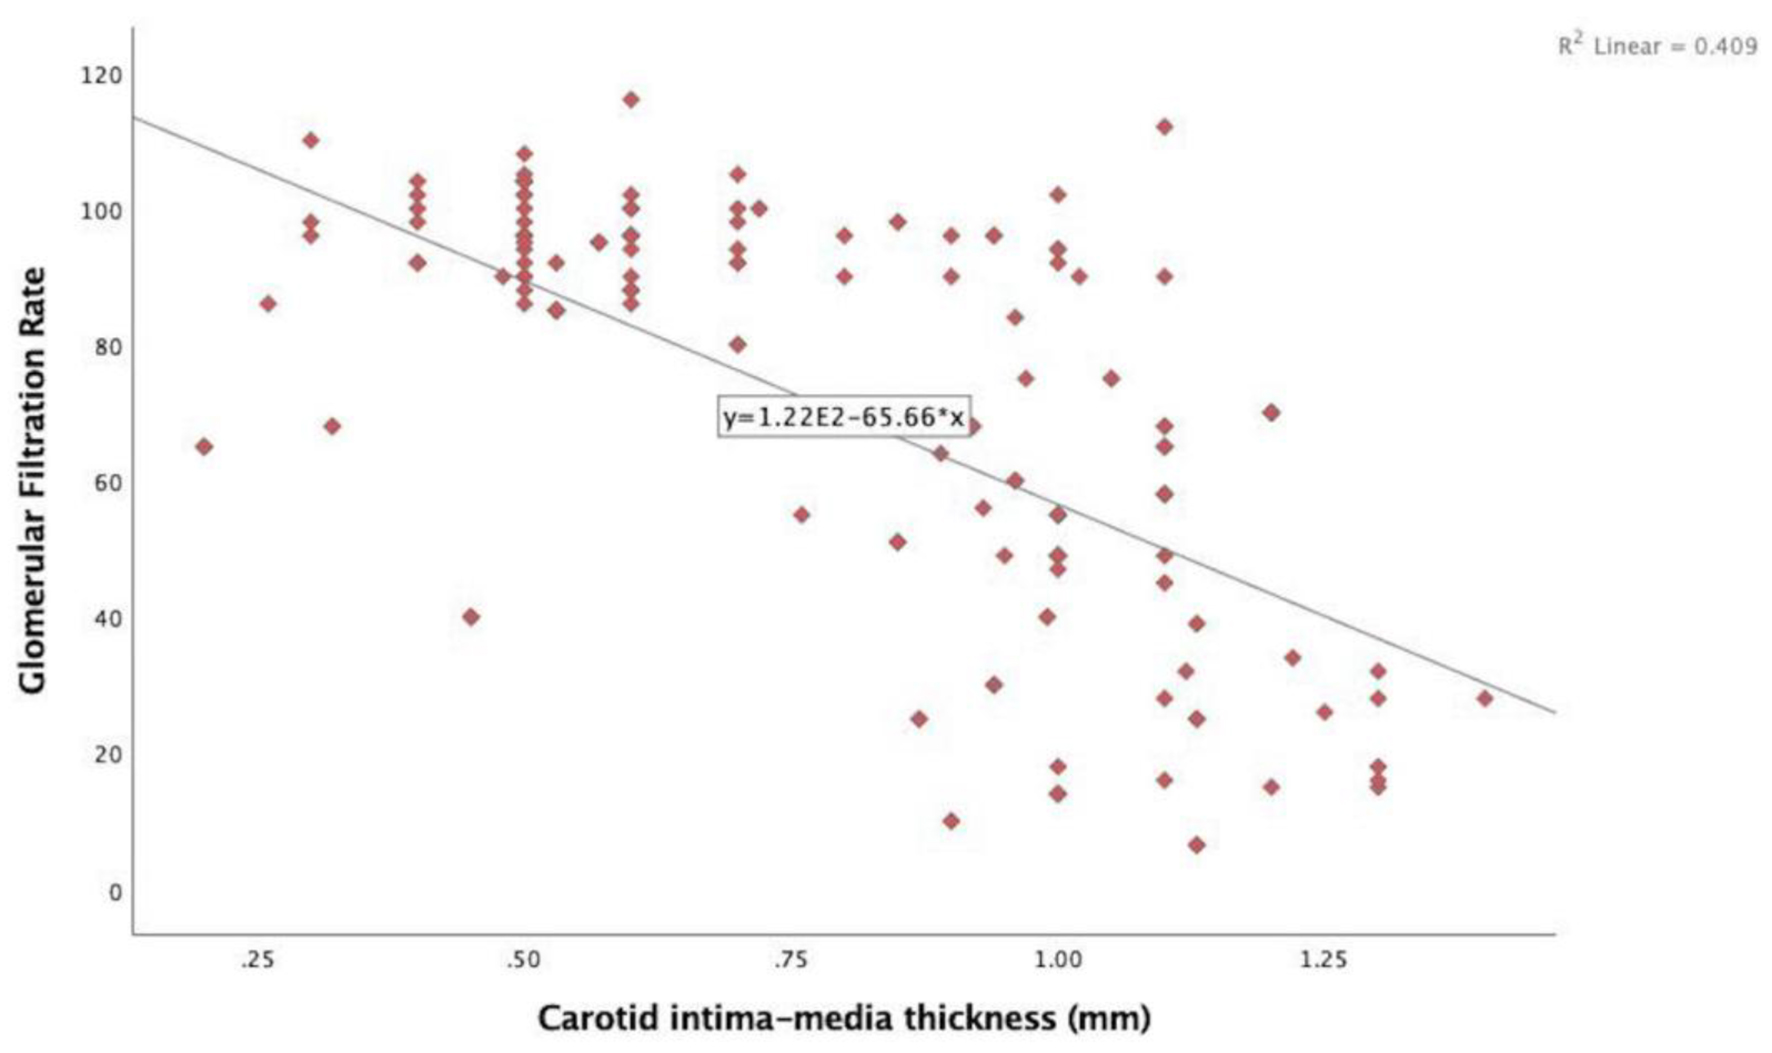
| Carotid intima-media thickness (mm) | 0.6 ± 0.2 | 0.9 ± 0.3a | 0.9 ± 0.2a | 1.1 ± 0.2a, b | 1.1 ± 0.1a, b | < 0.001 |
| Estimated glomerular filtration rate (mL/min) | 95.7 ± 7.8 | 72.0 ± 11.4a | 48.4 ± 6.6a, b | 28.2 ± 3.0a, b, c | 12.9 ± 4.0a, b, c, d | < 0.001 |
| eGFR | APV | EFT | CIMT | |||||
|---|---|---|---|---|---|---|---|---|
| r | P | r | P | r | P | r | P | |
| eGFR: estimated glomerular filtration rate; APV: aortic propagation velocity; EFT: epicardial fat thickness; CIMT: carotid intima-media thickness. | ||||||||
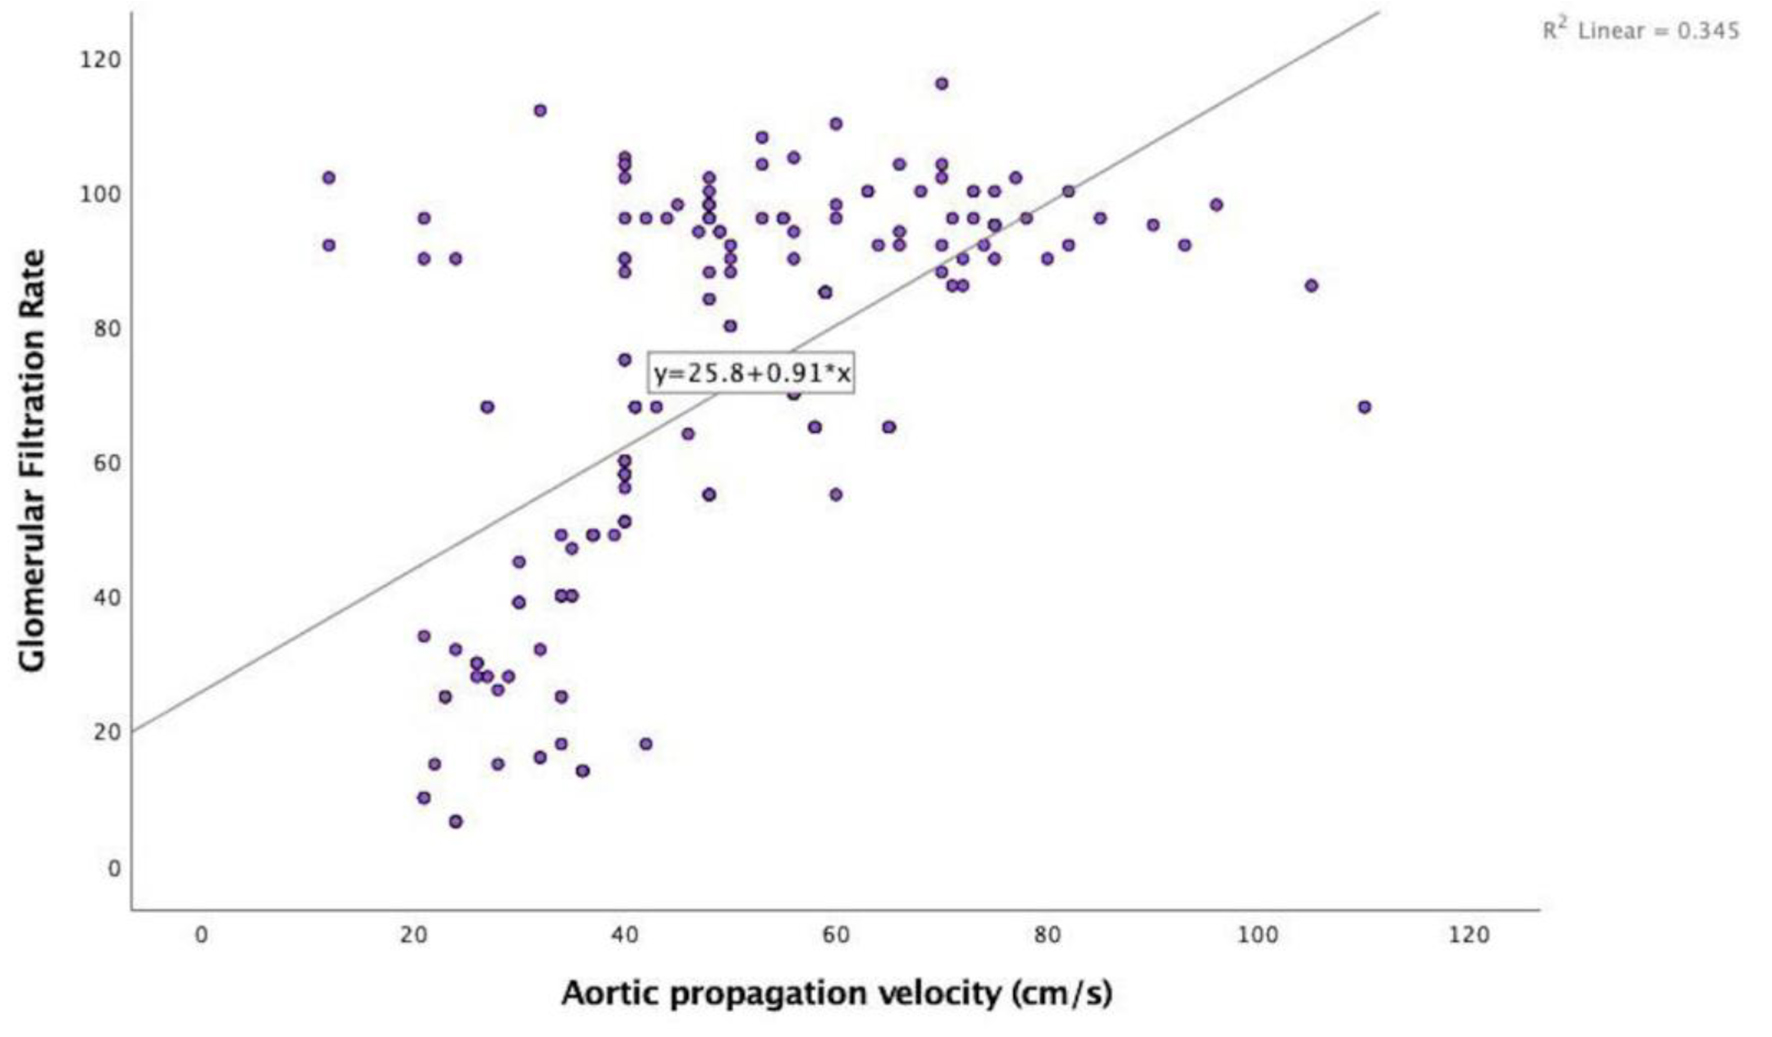
| eGFR | - | - | 0.587 | < 0.001 | -0.453 | < 0.001 | -0.640 | < 0.001 |
| APV | 0.587 | < 0.001 | - | - | -0.401 | < 0.001 | -0.628 | < 0.001 |
| EFT | -0.453 | < 0.001 | -0.401 | < 0.001 | - | - | 0.522 | < 0.001 |
| CIMT | -0.640 | < 0.001 | -0.628 | < 0.001 | 0.522 | < 0.001 | - | - |
| Standardized coefficients beta | t | P | |
|---|---|---|---|
| BMI: body mass index; APV: aortic propagation velocity; EFT: epicardial fat thickness; CIMT: carotid intima-media thickness. | |||
| BMI | -0.032 | -0.561 | 0.576 |
| APV | 0.291 | 3.969 | < 0.001 |
| EFT | -0.131 | -1.967 | 0.048 |
| CIMT | -0.380 | -4.694 | < 0.001 |
| Diabetes mellitus | -0.043 | -0.757 | 0.450 |
| Hypertension | -0.019 | -0.322 | 0.748 |