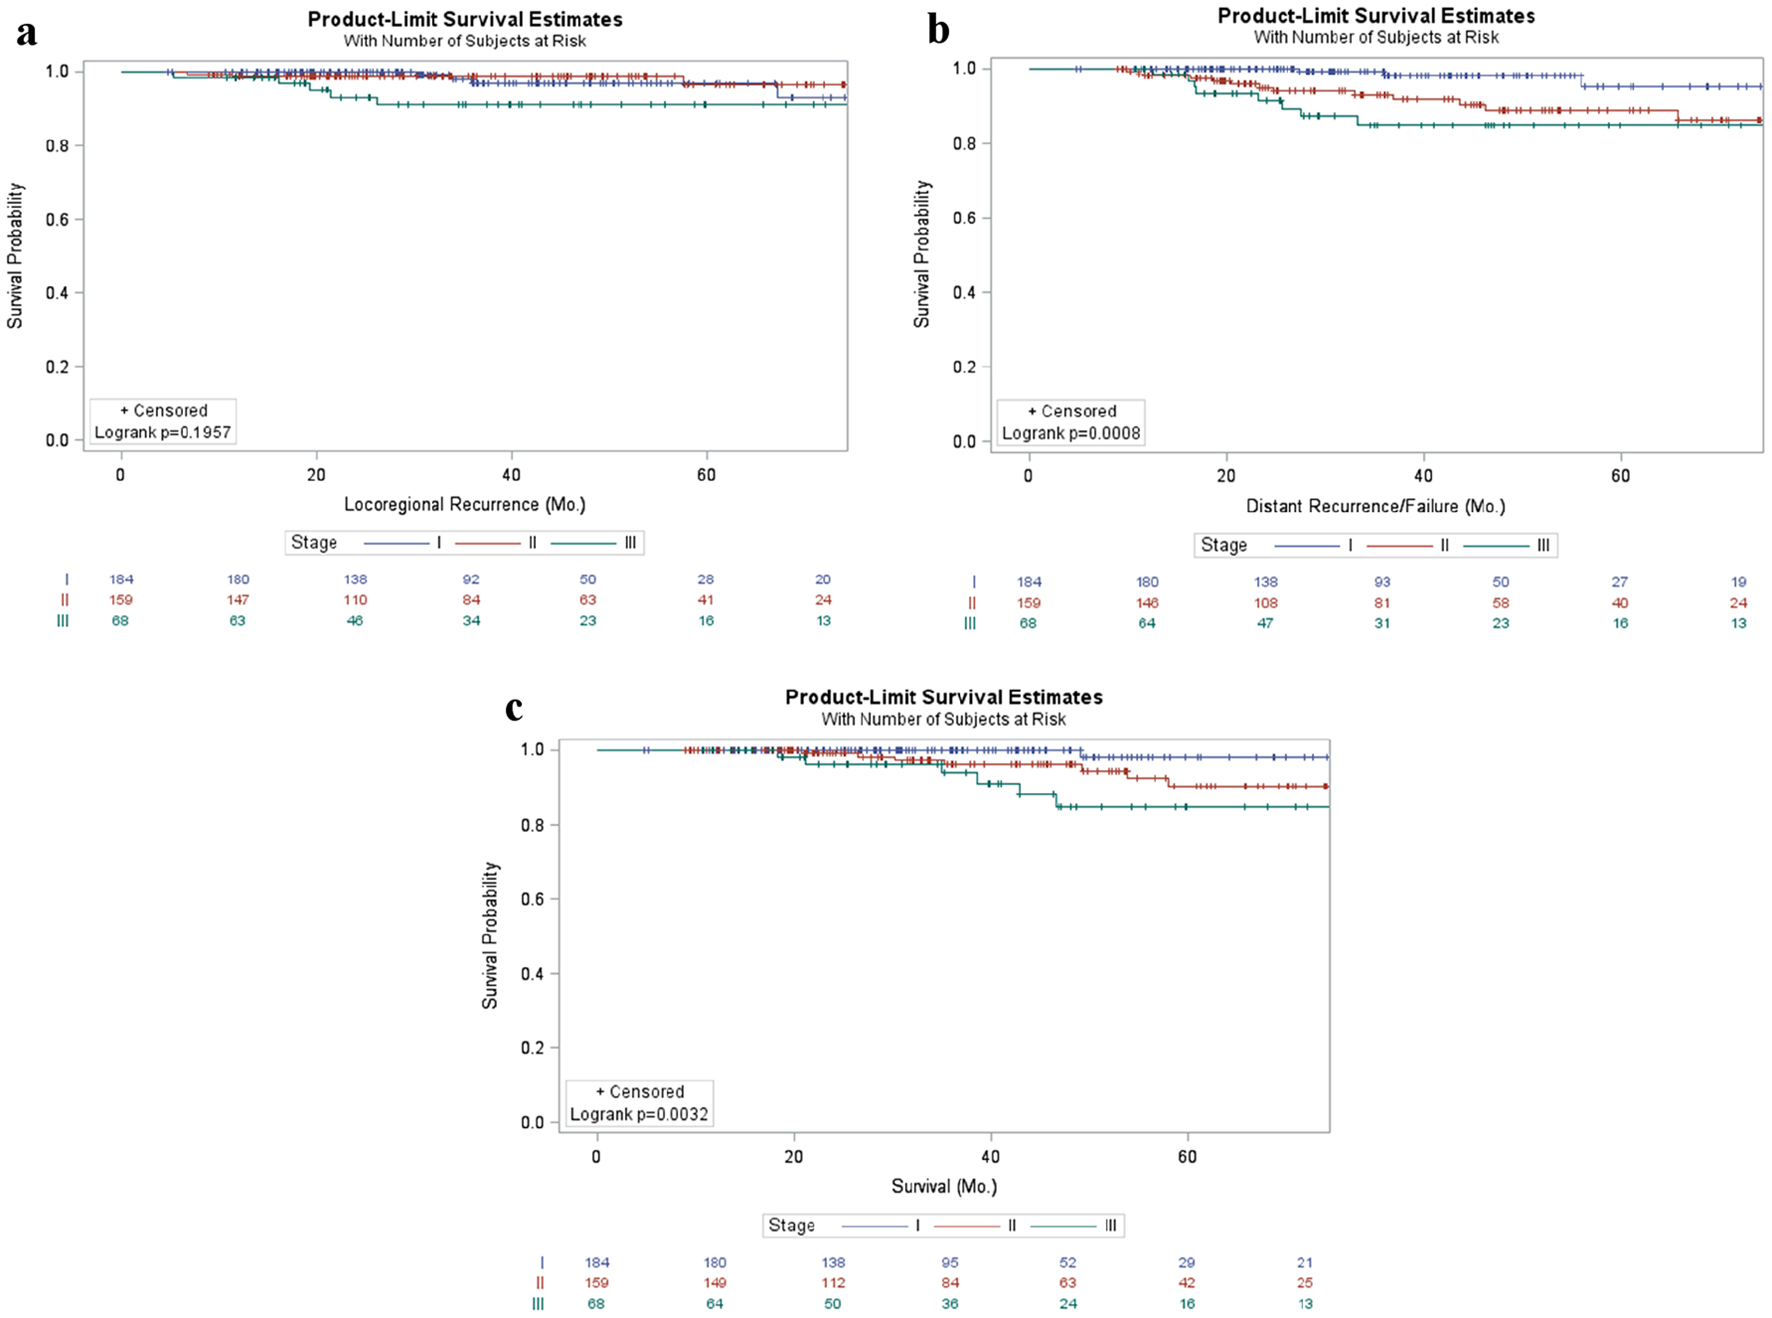
Figure 1. Patient outcomes in breast cancer patients stratified by stage. Kaplan-Meier curves of locoregional (a) and distant failure (b) as well as survival (c) in early stage breast cancer patients stratified by stage.
| Journal of Clinical Medicine Research, ISSN 1918-3003 print, 1918-3011 online, Open Access |
| Article copyright, the authors; Journal compilation copyright, J Clin Med Res and Elmer Press Inc |
| Journal website https://www.jocmr.org |
Original Article
Volume 13, Number 1, January 2021, pages 9-19
Percentage of Hormone Receptor Positivity in Breast Cancer Provides Prognostic Value: A Single-Institute Study
Figures
Tables
| Entire cohort (n = 411) | |
|---|---|
| Age, median (range) | 58.0 (19.8 - 88.1) |
| Sex | |
| Female | 411 (100%) |
| BMI, median (interquartile range) | 28.7 (25.2 - 34.1) |
| Smoking status, # at diagnosis (%) | 49 (15.0%) |
| Year of diagnosis (median) | 2014 |
| Follow-up (months), median (mean)/(range) | 36.6 (44.1)/(4.7 - 304.9) |
| Histology | |
| Invasive ductal carcinoma | 350 |
| Invasive lobular carcinoma | 48 |
| Inflammatory | 2 |
| Metaplastic carcinoma | 2 |
| Mixed | 7 |
| Unknown | 2 |
| Grade | |
| I | 83 |
| II | 154 |
| III | 168 |
| Unknown | 6 |
| T stage | |
| T0 | 2 |
| T1a | 32 |
| T1b | 65 |
| T1c | 127 |
| T2 | 132 |
| T3 | 41 |
| T4 | 1 |
| T4b | 3 |
| T4c | 1 |
| T4d | 5 |
| Unknown | 2 |
| Overall stage | |
| I | 184 |
| II | 159 |
| III | 68 |
| Parameter | Univariate | Multivariate | ||||||
|---|---|---|---|---|---|---|---|---|
| Hazard ratio | 95% hazard ratio, confidence limits | Pr > ChiSq | Hazard ratio | 95% hazard ratio, confidence limits | Pr > ChiSq | |||
| This evaluation was performed considering ER and PR positivity as both acategorical (top) and bcontinuous variables (bottom). ER: estrogen receptor; PR: progesterone receptor. | ||||||||
| ER groupa | ||||||||
| 0% | Reference | |||||||
| 1-79% | 0.24 | 0.04 | 0.88 | 0.063 | 0.09 | 0.01 | 0.46 | 0.009 |
| > 80% | 0.20 | 0.07 | 0.55 | 0.003 | 0.09 | 0.02 | 0.37 | < 0.001 |
| PR groupa | ||||||||
| 0% | Reference | |||||||
| 1-79% | 0.69 | 0.23 | 2.02 | 0.507 | 3.96 | 0.90 | 15.17 | 0.060 |
| > 80% | 0.53 | 0.15 | 1.69 | 0.317 | 3.10 | 0.61 | 14.16 | 0.168 |
| Stagea | ||||||||
| 1 | Reference | |||||||
| 2 vs. 1 | 0.57 | 0.16 | 1.82 | 0.375 | 0.61 | 0.16 | 2.00 | 0.443 |
| 3 vs. 1 | 1.76 | 0.57 | 5.29 | 0.333 | 1.65 | 0.53 | 4.93 | 0.390 |
| ER% increaseb | 0.98 | 0.97 | 0.99 | 0.004 | 0.98 | 0.96 | 0.99 | 0.007 |
| PR% increaseb | 0.99 | 0.98 | 1.00 | 0.225 | 1.01 | 0.99 | 1.02 | 0.387 |
| Stageb 2 vs. 1 | 0.57 | 0.16 | 1.82 | 0.375 | 0.55 | 0.15 | 1.78 | 0.872 |
| Stageb 3 vs. 1 | 1.76 | 0.57 | 5.29 | 0.333 | 1.57 | 0.52 | 4.64 | 0.613 |
| Parameter | Univariate | Multivariate | ||||||
|---|---|---|---|---|---|---|---|---|
| Hazard ratio | 95% hazard ratio, confidence limits | Pr > ChiSq | Hazard ratio | 95% hazard ratio, confidence limits | Pr > ChiSq | |||
| This evaluation was performed considering ER and PR positivity as both acategorical (top) and bcontinuous variables (bottom). ER: estrogen receptor; PR: progesterone receptor. | ||||||||
| ER groupa | ||||||||
| 0% | Reference | |||||||
| 1-79% | 1.14 | 0.38 | 3.23 | 0.813 | 1.01 | 0.27 | 3.34 | 0.988 |
| > 80% | 0.56 | 0.24 | 1.37 | 0.194 | 0.97 | 0.27 | 3.31 | 0.960 |
| PR groupa | ||||||||
| 0% | Reference | |||||||
| 1-79% | 1.02 | 0.45 | 2.31 | 0.973 | 1.01 | 0.35 | 3.32 | 0.987 |
| > 80% | 0.33 | 0.10 | 0.92 | 0.051 | 0.36 | 0.08 | 1.48 | 0.161 |
| Stagea | ||||||||
| 1 | Reference | |||||||
| 2 vs. 1 | 4.23 | 1.44 | 16.40 | 0.020 | 4.22 | 1.44 | 16.34 | 0.020 |
| 3 vs. 1 | 7.85 | 2.57 | 30.00 | 0.001 | 7.00 | 2.27 | 27.90 | 0.002 |
| ER% increaseb | 0.99 | 0.98 | 1.00 | 0.090 | 1.00 | 0.99 | 1.01 | 0.951 |
| PR% increaseb | 0.99 | 0.98 | 0.99 | 0.030 | 0.99 | 0.98 | 1.00 | 0.119 |
| Stageb 2 vs. 1 | 4.23 | 1.44 | 16.40 | 0.020 | 4.24 | 1.44 | 16.45 | 0.019 |
| Stageb 3 vs. 1 | 7.85 | 2.57 | 30.99 | 0.001 | 7.00 | 2.29 | 27.72 | 0.002 |
| Parameter | Univariate | Multivariate | ||||||
|---|---|---|---|---|---|---|---|---|
| Hazard ratio | 95% hazard ratio, confidence limits | Pr > ChiSq | Hazard ratio | 95% hazard ratio, confidence limits | Pr > ChiSq | |||
| This evaluation was performed considering ER and PR positivity as both acategorical (top) and bcontinuous variables (bottom). ER: estrogen receptor; PR: progesterone receptor. | ||||||||
| ER groupa | ||||||||
| 0% | Reference | |||||||
| 1-79% | 0.30 | 0.06 | 1.07 | 0.107 | 0.08 | 0.01 | 0.48 | 0.008 |
| > 80% | 0.20 | 0.07 | 0.56 | 0.004 | 0.10 | 0.03 | 0.51 | 0.003 |
| PR groupa | ||||||||
| 0% | Reference | |||||||
| 1-79% | 0.73 | 0.26 | 2.00 | 0.556 | 4.60 | 0.92 | 18.33 | 0.046 |
| > 80% | 0.25 | 0.05 | 0.90 | 0.064 | 1.13 | 0.17 | 5.45 | 0.890 |
| Stagea | ||||||||
| 1 | Reference | |||||||
| 2 vs. 1 | 5.28 | 1.18 | 49.76 | 0.072 | 5.60 | 1.23 | 53.12 | 0.065 |
| 3 vs. 1 | 11.59 | 2.58 | 109.54 | 0.009 | 11.77 | 2.59 | 111.77 | 0.008 |
| ER% increaseb | 0.98 | 0.97 | 0.99 | 0.003 | 0.99 | 0.97 | 1.00 | 0.119 |
| PR% increaseb | 0.98 | 0.97 | 0.99 | 0.014 | 0.99 | 0.97 | 1.01 | 0.336 |
| Stageb 2 vs. 1 | 5.28 | 1.18 | 49.76 | 0.073 | 4.97 | 1.11 | 46.88 | 0.085 |
| Stageb 3 vs. 1 | 11.59 | 2.58 | 109.54 | 0.008 | 10.22 | 2.29 | 96.30 | 0.012 |